Research / Earnings and valuation
T-Mobile Stock Q3 2026:ARPA Growth Lifts Service Revenue and Cash Flow
As of: Figures are as of T-Mobile US, Inc.'s third-quarter 2026 results (the quarter ended 30 September 2026, reported 28 October 2026 in a Form 8-K) and its Form 10-Q for that quarter, filed 28 October 2026. T-Mobile's fiscal year is the calendar year, so its Q3 2026 covers July to September 2026. The share price used in our valuation is the Nasdaq close of TMUS on 2 November 2026, $160.15; analyst data were accessed on 2 November 2026. Published 2 November 2026.
The short answer. T-Mobile stock Q3 2026 comes down to a quarter in which customers paid more per account and the company kept more of each dollar. In the three months to 30 September 2026 revenue rose 7.4% to $23.58bn, postpaid service revenue rose 9.3% to $16.27bn and average revenue per postpaid account (ARPA) rose 4.2% to $155.73. Core Adjusted EBITDA rose 10.8% to $9.62bn, net income rose 27.3% to $3.46bn and adjusted free cash flow rose 5.3% to $5.07bn. Postpaid net account additions slowed to 274,000 from 396,000 and account churn rose to 1.09%. T-Mobile raised its 2026 guidance for profit and cash flow and lifted its dividend by 15%. Our discounted cash flow model values the shares at $281.35, against a $160.15 close on 2 November 2026; that gap rests mostly on the cost of capital and on how long T-Mobile's roughly $20bn a year of cash flow lasts, so we show below how far it moves when you change those inputs.
Key takeaways
- Customers are paying more. Postpaid ARPA rose 4.2% to $155.73, and T-Mobile now expects about 3.5% ARPA growth for 2026, up from 2.5% to 3%. Management said 60% of new accounts chose premium plans.
- Account growth slowed. T-Mobile added 274,000 postpaid accounts, against 396,000 a year earlier, and 768,000 in nine months, against 919,000. Account churn rose to 1.09% from 0.97%. The full-year target of about 1.0m account additions is unchanged.
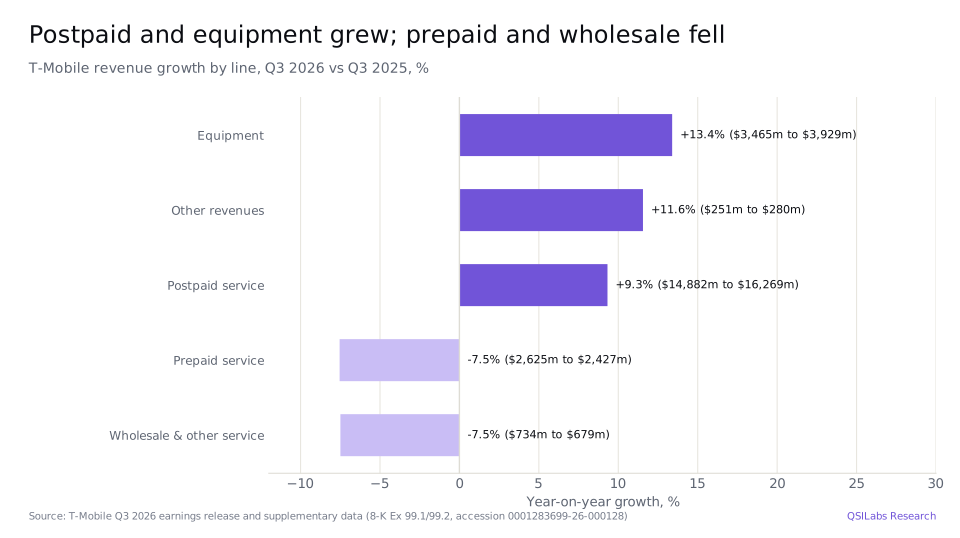
- Service revenue grew 6.2%, postpaid 9.3%. Total revenue was $23,584m, up 7.4%. Prepaid and wholesale revenue each fell 7.5%, partly because the Boost wholesale agreement is rolling off faster.
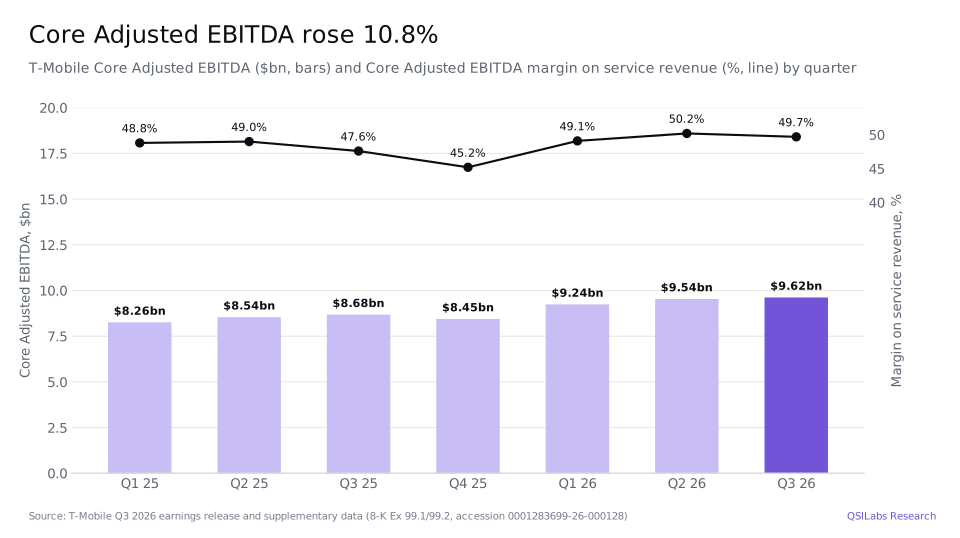
- Profit grew faster than revenue. Core Adjusted EBITDA rose 10.8% to $9,620m, 49.7% of service revenue against 47.6%. Operating income rose 25.0% to $5,661m and diluted earnings per share 33.6% to $3.22.
- Cash flow is steady, and most of it goes back to shareholders. Adjusted free cash flow was $5,071m, up 5.3%, and $18.65bn over 12 months. T-Mobile bought back $9.5bn of shares in nine months and raised the quarterly dividend to $1.17.
- Guidance raised. T-Mobile now expects Core Adjusted EBITDA of $37.35bn to $37.45bn for 2026 and adjusted free cash flow of $18.7bn to $18.8bn, with capital spending of about $10bn.
- Our value: $281.35 a share, against a $160.15 close on 2 November 2026. A two-stage cross-check gives $267.89; analysts' average target is $225.64 and their highest $296.
- What to watch. Account additions and churn in the holiday quarter, whether ARPA keeps growing near 4%, how much T-Mobile spends in the FCC spectrum auctions expected in 2027 and 2028, and the 2027 outlook due with the fourth-quarter results.
Key numbers from T-Mobile's Q3 2026 earnings
| Measure | Q3 2026 | Q3 2025 | Change |
|---|---|---|---|
| Total revenues | $23,584m | $21,957m | +7.4% |
| Service revenues | $19,375m | $18,241m | +6.2% |
| Postpaid service revenues | $16,269m | $14,882m | +9.3% |
| Equipment revenues | $3,929m | $3,465m | +13.4% |
| Operating income | $5,661m | $4,530m | +25.0% |
| Net income | $3,455m | $2,714m | +27.3% |
| Diluted earnings per share | $3.22 | $2.41 | +33.6% |
| Core Adjusted EBITDA | $9,620m | $8,680m | +10.8% |
| Postpaid net account additions | 274,000 | 396,000 | -122,000 |
| Postpaid ARPA | $155.73 | $149.44 | +4.2% |
| Postpaid account churn | 1.09% | 0.97% | +0.12 pts |
| Net cash from operating activities | $7,341m | $7,457m | -1.6% |
| Adjusted free cash flow | $5,071m | $4,818m | +5.3% |
Source: T-Mobile Q3 2026 earnings release and supplementary data (Form 8-K, Exhibits 99.1 and 99.2).
T-Mobile Q3 2026 earnings: what happened
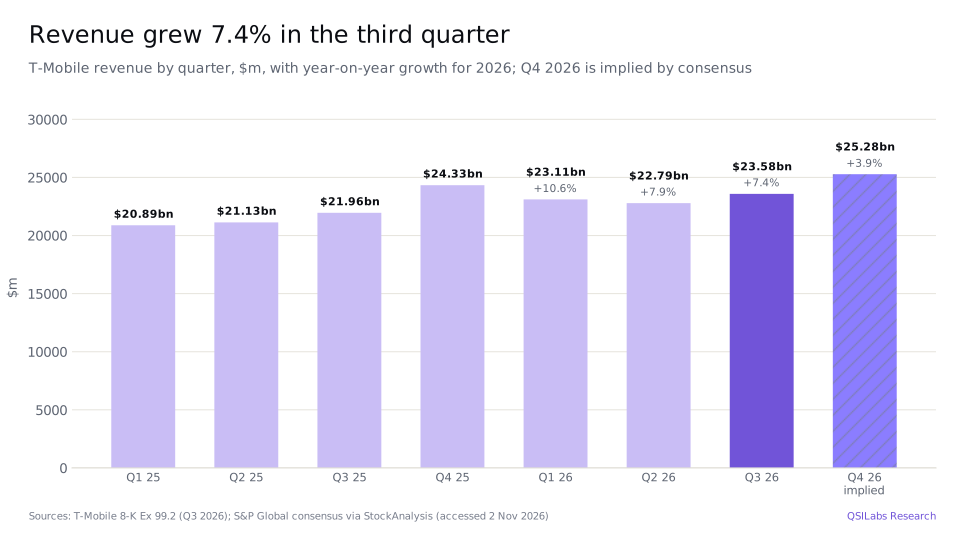
T-Mobile US reported third-quarter results on 28 October 2026. Revenue rose 7.4% to $23,584m from $21,957m. Service revenue, the monthly bills that make up most of the business, rose 6.2% to $19,375m, and equipment revenue, mostly phones sold to customers, rose 13.4% to $3,929m. For the first nine months, revenue was $69,482m, up 8.6%.
Operating income rose 25.0% to $5,661m, a margin of 24.0% against 20.6% a year earlier. Depreciation and amortisation was $3,452m, little changed from $3,408m, and net interest expense rose to $1,031m from $924m. Net income rose 27.3% to $3,455m. Diluted earnings per share rose faster, 33.6% to $3.22 from $2.41, because buybacks cut the diluted share count by about 5%, by our calculation. The quarter included $98m of UScellular merger-related costs after tax; a year earlier net income had been reduced by a $208m after-tax impairment of capitalised software.
Core Adjusted EBITDA, T-Mobile's measure of operating profit before depreciation, amortisation, share-based pay and special items, excluding device lease revenue, rose 10.8% to $9,620m. That was 49.7% of service revenue, up from 47.6% a year earlier but slightly below the 50.2% of the second quarter. In its release T-Mobile described its service revenue, profit and earnings growth as "industry-leading".
Chief executive Srini Gopalan said: "Q3 marked another strong quarter and is further proof that our winning formula of the best network, best value, and best experiences drives durable and profitable growth." On the call he introduced Jessica Uhl as chief financial officer-designate; Peter Osvaldik, the current chief financial officer, said the two would hand over "over the next few months as part of this long-planned succession process".
- 1 Aug 2025Acquisition of the UScellular wireless business completed for $2.8bn of cash plus assumed debtForm 10-Q
- 11 Feb 20262027 targets updated: service revenue $80.5bn-81.5bn, Core Adjusted EBITDA $40bn-41bn, capital spending $9bn-10bn8-K Ex 99.1
- 24 Feb 2026TMUS closes at $221.98, its 52-week closing highYahoo Finance
- 23 Apr 20262026 shareholder return authorisation raised to up to $18.2bn8-K Ex 99.2
- June 2026FCC Auction 113 ends; T-Mobile wins 102 AWS-3 licences for $278mForm 10-Q
- 1 Sep 2026Letter agreement with Jessica Uhl, now chief financial officer-designateForm 10-Q; earnings call
- 1 Oct 2026i3 Broadband fiber joint venture completed; T-Mobile pays $671m for 50%Form 10-Q
- 23 Oct 2026TMUS closes at $146.54, its 52-week closing low; $791m of shares bought back from 1 OctoberYahoo Finance; Form 10-Q
- 28 Oct 2026Q3 results: ARPA up 4.2%, 2026 guidance raised, dividend raised 15% to $1.17; TMUS closes at $148.088-K; call; Yahoo
- 2 Nov 2026TMUS closes at $160.15, the price used in our valuationYahoo Finance
- 2027-2028FCC spectrum auctions expected; management says more capital will probably go to spectrumQ3 2026 earnings call
How fast are T-Mobile's accounts and ARPA growing?
T-Mobile now focuses its customer reporting on accounts, a household or business that pays one bill, rather than phone lines. It added 274,000 postpaid accounts in the third quarter, against 396,000 a year earlier and 277,000 in the second quarter, and ended September with 34.97m, up 2.9% in a year. In nine months it added 768,000, against 919,000 in 2025, and it still expects about 1.0m for the year, which implies about 232,000 in the fourth quarter.
The money per account grew faster. Postpaid ARPA rose 4.2% to $155.73 and has risen every quarter this year. T-Mobile now expects about 3.5% ARPA growth for 2026, up from 2.5% to 3%, which Osvaldik put down to "customer adoption of premium rate plans, deepening relationships with customers as well as our rate plan modernization initiatives". Management said 60% of new accounts are choosing premium plans. Gopalan said that on average T-Mobile's "existing customers actually pay less than our new customers", and in the week of the results T-Mobile launched T-Mix, plans that let customers choose and change their benefits.
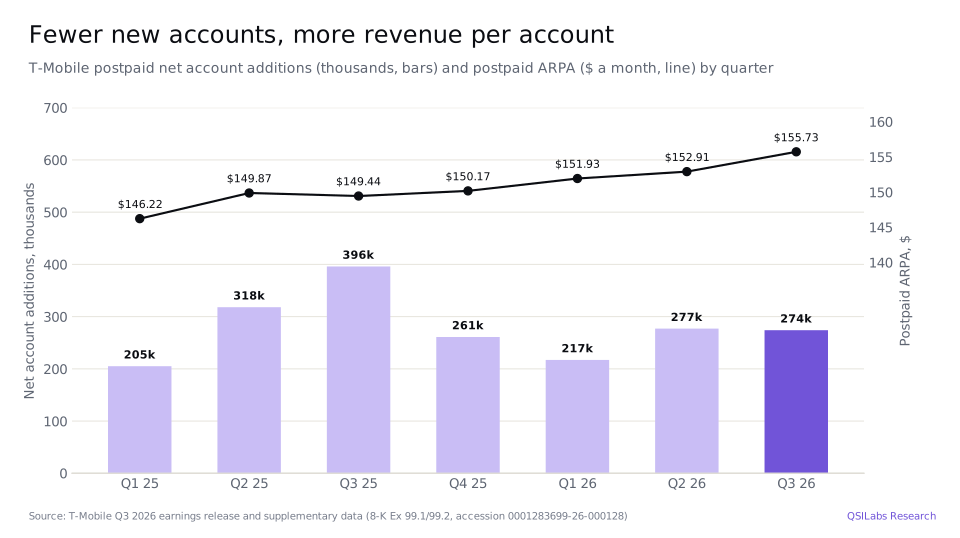
More customers left. Postpaid account churn, the share of accounts leaving each month, rose to 1.09% from 0.97% a year earlier and 0.99% in the second quarter. T-Mobile did not give a postpaid phone churn figure; Osvaldik said it "came in about as we expected". Management expects churn to be higher in the fourth quarter, the holiday season.
Digital sales are changing how T-Mobile sells. Its T-Life app had 32m monthly active users, and over 80% of upgrades and about half of new phone lines were done digitally in the quarter. Gopalan said T-Mobile's enterprise business had its 17th straight quarter of positive ports, more customers moving their numbers in than out, and management said T-Mobile had won the top spot in the Department of Justice's wireless purchasing contract.
Which revenue lines grew and which shrank?
Postpaid did all the work. Postpaid service revenue rose 9.3% to $16,269m, and T-Mobile expects organic postpaid service revenue growth of about 7% in the fourth quarter. Prepaid revenue fell 7.5% to $2,427m and wholesale and other service revenue fell 7.5% to $679m; Osvaldik pointed to "the faster roll-off of the Boost MVNO", a wholesale agreement under which Boost Mobile customers used T-Mobile's network, and to trends in prepaid. Equipment revenue rose 13.4% to $3,929m and other revenue 11.6% to $280m.
T-Mobile now expects service revenue of about $76.8bn in 2026, 8% growth, partly helped by the UScellular wireless business, which it bought on 1 August 2025 for $2.8bn of cash plus assumed debt. Its February 2026 targets put service revenue at $80.5bn to $81.5bn in 2027.
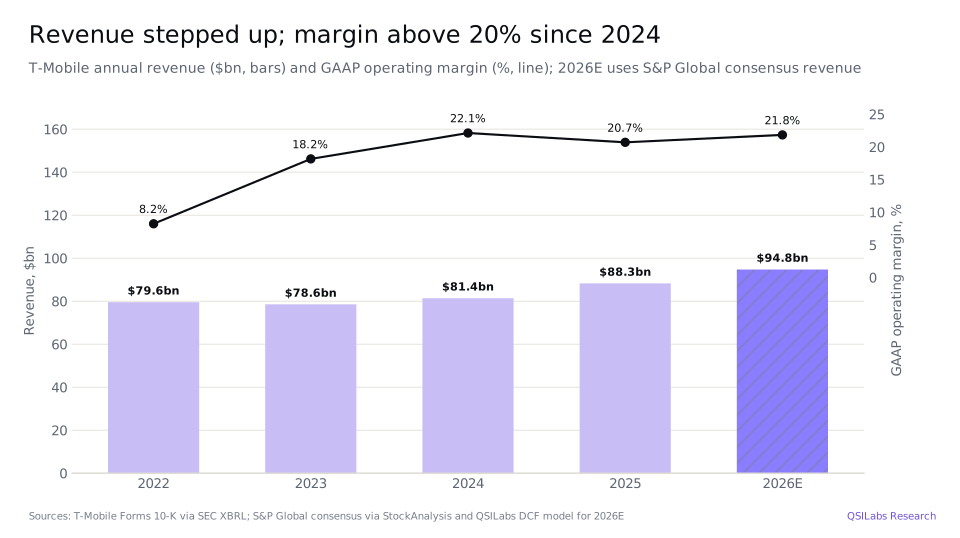
Over a longer period, growth has come in steps. Annual revenue was $79.6bn in 2022, $78.6bn in 2023, $81.4bn in 2024 and $88.3bn in 2025, and S&P Global consensus expects $94.8bn in 2026, up 7.3%. The GAAP operating margin rose from 8.2% in 2022 to 22.1% in 2024, and is 21.8% in our 2026 estimate.
How is T-Mobile's broadband and fiber business doing?
T-Mobile sells home internet two ways: 5G broadband, also called fixed wireless access, delivered over its mobile network, and fiber through joint ventures. It does not publish broadband customer additions, but Andre Almeida, chief strategy officer, said it "had industry-leading FWA nets this quarter", and Gopalan said it is "tracking well ahead of the pace" toward 15m 5G broadband customers by the end of the decade. Revenue per 5G broadband customer grew both from a year earlier and from the second quarter.
Fiber is newer. T-Mobile bought 50% stakes in the Lumos fiber business in April 2025 for $932m and in Metronet in July 2025 for $4.6bn, and on 1 October 2026 completed a third joint venture, paying $671m for half of i3 Broadband. Gopalan said fiber has reached about 20% penetration after 12 months and that T-Mobile is "well on track" to 3m to 4m fiber customers by 2030.
The network is the other lever. T-Mobile won 102 AWS-3 licences in the FCC's Auction 113 for $278m and bought 600 MHz licences in September. John Saw, president of technology, said AI-based radio planning had produced bigger gains in spectral efficiency than expected in tests in New York, and T-Mobile is building Kinetic Edge with Amazon Web Services, a computing platform at the edge of its network for robots and other machines. Gopalan said physical AI is in its "very early innings".
How much free cash flow does T-Mobile generate?
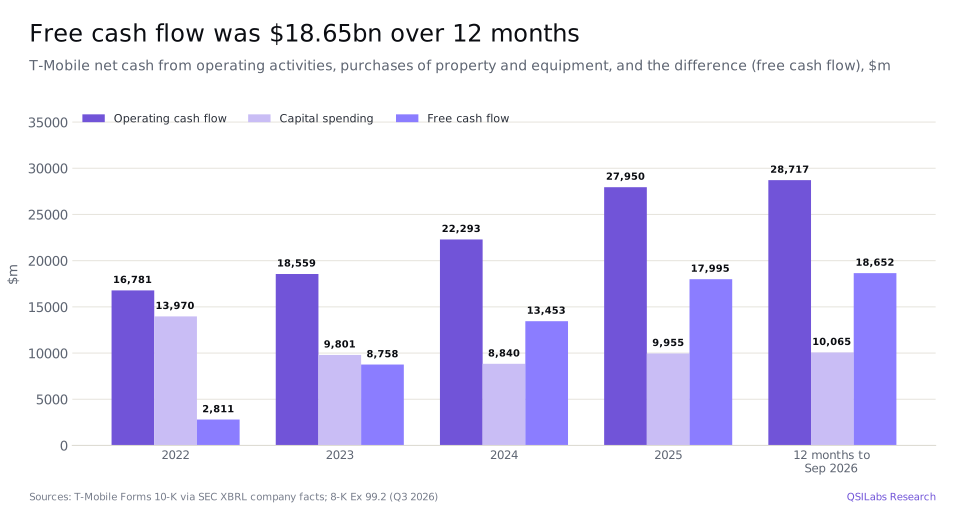
About $18.7bn a year. Adjusted free cash flow, which this quarter equalled net cash from operating activities less cash capital spending, was $5,071m in the third quarter, up 5.3% from $4,818m, a 26.2% margin on service revenue. Operating cash flow was $7,341m, down 1.6%, and capital spending fell to $2,270m from $2,639m. For the first nine months adjusted free cash flow was $14,467m, up 4.8%.
Over the 12 months to September 2026, operating cash flow was $28,717m and capital spending $10,065m, giving $18,652m, against $17,995m for 2025 and $2,811m in 2022, when capital spending peaked at $13,970m. T-Mobile now expects 2026 adjusted free cash flow of $18.7bn to $18.8bn, up $150m at the midpoint, with capital spending of about $10bn.
Most of that cash goes back to shareholders. T-Mobile bought 48.4m shares for $9.5bn in the first nine months, at an average of $195.81, and another $791m worth from 1 to 23 October at an average of $158.68; it had up to $4.6bn left of its $18.2bn 2026 shareholder return programme at 23 October. It paid a $1.02 quarterly dividend, $1.1bn, in September, and declared $1.17 for December, up 15%. Osvaldik said that in 2027 and 2028 "more and more of our capital allocation envelope" would probably go to spectrum.
At the guidance midpoint, 2026 adjusted free cash flow of $18.75bn is about 11.1% of T-Mobile's $169.6bn market value at the 2 November close. The new dividend of $1.17 a quarter is $4.68 a year, a yield of 2.9%.
How has TMUS stock performed in 2026?
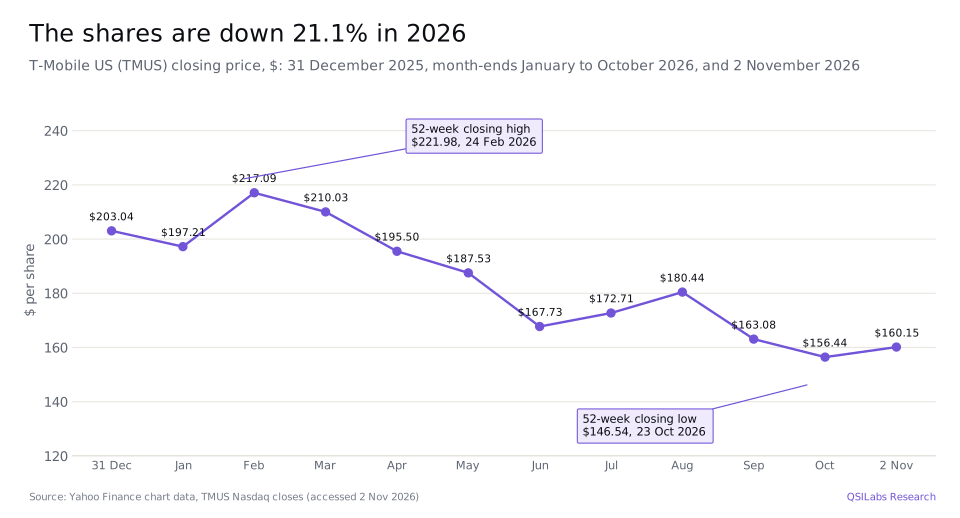
T-Mobile shares closed at $160.15 on 2 November 2026, down 21.1% from $203.04 at the end of 2025. They reached a 52-week closing high of $221.98 on 24 February, then fell for most of the year, to $167.73 at the end of June and $163.08 at the end of September. On 23 October they fell 7.7% in a day to $146.54, their 52-week closing low.
On results day, 28 October, the shares closed at $148.08. They rose 6.2% to $156.44 on 30 October and closed at $160.15 on 2 November, 9.3% above the October low.
T-Mobile stock Q3 2026: is TMUS undervalued?
On our numbers, yes. Our discounted cash flow model values T-Mobile at $281.35 a share, about 1.76 times the $160.15 close on 2 November 2026. At that price the equity was worth about $169.6bn, on 1,059m shares, and the enterprise value, adding debt of $89.4bn and deducting $5.6bn of cash, about $253.4bn. That is 6.9 times the $36.84bn of Core Adjusted EBITDA T-Mobile reported for the past four quarters, and 14.7 times our estimate of 2026 unlevered free cash flow, $17.21bn. The price is 13.2 times consensus 2026 earnings per share of $12.10.
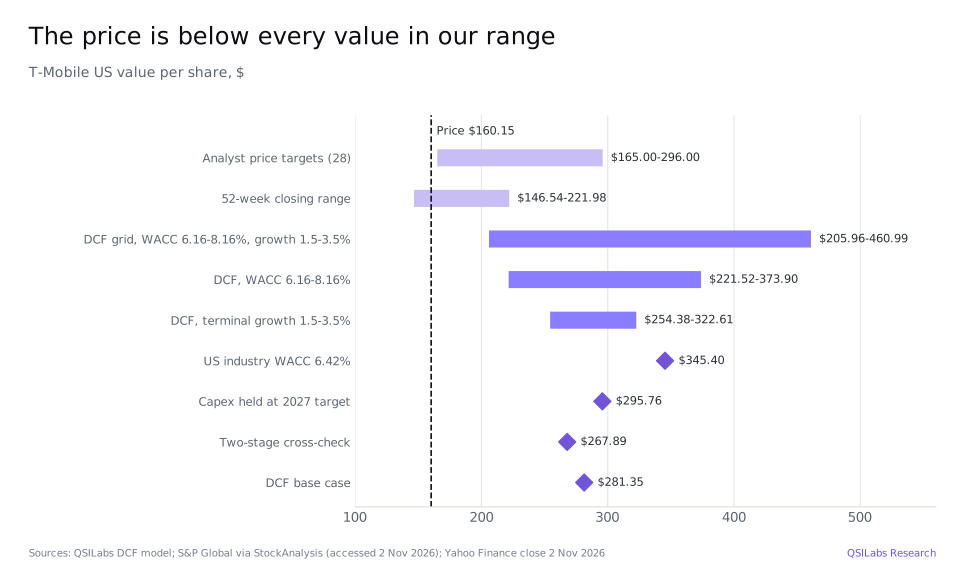
The gap comes from the cost of capital and from how long the market thinks T-Mobile's cash flow will last. We discount at 7.16%. At the market price, the same cash flows imply a much higher rate, above the 8.16% top row of our table, or cash flows that stop growing well before 2035. Our enterprise value of $375.5bn is 10.2 times trailing Core Adjusted EBITDA.
Analysts are in between. The 28 analysts tracked by S&P Global rate T-Mobile a Buy on average, with an average price target of $225.64, a median of $235 and a range from $165 to $296. In October 15 rated it a Strong Buy, 9 a Buy and 4 a Hold.
Method
We forecast revenue and GAAP operating margin year by year to 2035, apply a 24.5% tax rate, the midpoint of T-Mobile's lowered 2026 guidance of 24% to 25%, and deduct capital spending, including spectrum and finance leases, and working capital to reach unlevered free cash flow. We discount those cash flows at a 7.16% weighted average cost of capital. Equity is 65.5% of capital at a cost of 8.67%, from a 5.12% risk-free rate, a beta of 0.795 and an equity risk premium of 4.46% for the US, where T-Mobile earns its revenue; the beta is Damodaran's January 2026 global unlevered beta for wireless telecom companies, 0.570, relevered at T-Mobile's ratio of debt to equity, 0.53. Debt is 34.5% of capital at a pre-tax cost of 5.74%, the yield on T-Mobile's own bonds blended with its lease rate, taxed at 25%. After 2035 we assume growth of 2.5% a year; that terminal value is 63.8% of our enterprise value of $375.5bn. Deducting debt of $89.38bn, which includes $2.29bn of financing leases and $3.42bn of tower obligations, adding cash of $5.62bn, the $5.53bn T-Mobile paid for its Lumos and Metronet fiber stakes, which we carry at that cost rather than valuing them, and about $1.82bn of cash generated between 30 September and 2 November, and deducting the $0.79bn of October buybacks, gives equity value of $298.3bn, or $281.35 a share on 1,060m diluted shares.
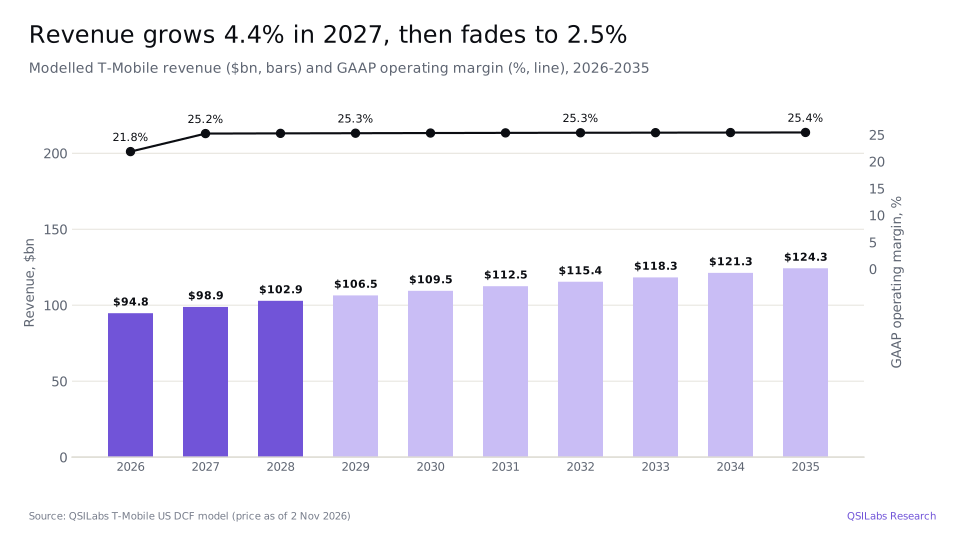
For 2026 we use the S&P Global consensus revenue of $94.76bn, up 7.3%, which implies fourth-quarter revenue of about $25.28bn, and GAAP operating income of $20.69bn, a 21.84% margin: nine-month operating income of $15.65bn and fourth-quarter operating income of about $5.04bn, in line with the Core Adjusted EBITDA guidance midpoint. For 2027 we use consensus revenue of $98.90bn, up 4.37%. For 2028 growth of 4.05% takes revenue to about $102.9bn, in line with S&P Global's three-year forecast of 5.23% a year from 2025. Growth then slows to 3.46% in 2029 and 2.87% in 2030, MarketLine's forecast for US wireless telecom services from $230.6bn in 2025 to $265.6bn in 2030, and to 2.5% from 2033. Revenue reaches $124.3bn in 2035.
The operating margin is 25.19% in 2027, which is T-Mobile's 2027 target of $40bn to $41bn of Core Adjusted EBITDA less depreciation and amortisation at the third-quarter rate, share-based pay and about $1bn of merger and restructuring costs, and edges up to 25.40% by 2035. We hold the margin before amortisation of acquired intangible assets at its 2027 level and keep that amortisation at a fixed dollar amount, so it shrinks as a share of revenue. Capital spending is $12.34bn in 2026: the $10bn guidance, $1.11bn of spectrum and $1.23bn of finance-lease additions. In 2027 it is $12.57bn, the $9.5bn midpoint of T-Mobile's 2027 target plus spectrum and finance leases, 12.7% of revenue, and it rises to $21.35bn by 2035, about 17.2% of revenue. Depreciation and amortisation is 14.9% of revenue in 2026 and 14.0% from 2027.
We forecast unlevered free cash flow of $17.2bn in 2026 and $19.9bn in 2027, $20.3bn in 2030 and $19.7bn in 2035; only the part of 2026 after 2 November is discounted. Our 2026 figure is below T-Mobile's adjusted free cash flow guidance because we charge spectrum and finance leases as capital spending and tax operating profit at the full rate, although it is measured before interest. Our previous model, dated 28 October and priced at $148.08, gave $302.20 at a 6.42% cost of capital from Damodaran's US industry data. It assumed a 22.8% operating margin in 2027, growth of 2.5% to 6% a year by revenue line, D&A falling to 12.5% of revenue and a fourth-quarter operating profit of about $5.5bn, none of them tied to a source; we have replaced them with the consensus, company targets and industry forecast above. With those old assumptions at today's date, price and 7.16% cost of capital, the model gives $245.13.
How the number moves if you argue with us
The table shows our value per share at different costs of capital and terminal growth rates. Even at an 8.16% cost of capital and 1.5% terminal growth, the model gives $205.96, about 1.3 times the share price.
| Cost of capital | Growth 1.5% | Growth 2.0% | Growth 2.5% | Growth 3.0% | Growth 3.5% |
|---|---|---|---|---|---|
| 6.16% | $323.79 | $345.89 | $373.90 | $410.63 | $460.99 |
| 6.66% | $285.70 | $301.97 | $322.06 | $347.52 | $380.89 |
| 7.16% | $254.38 | $266.60 | $281.35 | $299.55 | $322.61 |
| 7.66% | $228.19 | $237.50 | $248.54 | $261.86 | $278.28 |
| 8.16% | $205.96 | $213.14 | $221.52 | $231.45 | $243.42 |
Capital spending is one assumption that pulls the other way. Our long-run rule ties capital spending to depreciation plus the investment needed for 2.5% growth, which takes it to 17.2% of revenue by 2035, well above the 12.7% of T-Mobile's 2027 target and about 15.5% in 2025 including spectrum and finance leases. Holding capital spending at 12.7% of revenue from 2028 gives $295.76. A two-stage version of the model, which extends the fade over more years, gives $267.89. Damodaran's US wireless industry cost of capital, 6.42%, which our previous model used, gives $345.40.
Two checks point lower. T-Mobile's own five-year beta is 0.38, half the 0.795 we use, which would lower the cost of capital, but a bottom-up cost of capital of 8.35%, our cross-check, is above every row in the table and would put the value below the $221.52 of the 8.16% row. Debt is 34.5% of capital, a moderate weight, so the result does not depend on an unusually high share of cheap debt.
Our numbers and the market's can both be right only if T-Mobile's cash flow stops growing soon, or if investors demand a much higher return than the cost of capital for telecom companies implies. The pressures are real: slower account growth, higher churn, price competition from other carriers, and heavy spending on spectrum in 2027 and 2028. We think the price already allows for most of that.
Risks to the T-Mobile investment case
- Slower account growth. Net account additions fell to 274,000 from 396,000 and churn rose to 1.09%. If rivals compete harder on price, T-Mobile may have to choose between growth and ARPA.
- Prepaid and wholesale decline. Prepaid and wholesale and other service revenue each fell 7.5%, and the Boost agreement is rolling off faster. Postpaid has to carry the whole company's growth.
- Spectrum spending. Management expects FCC auctions in 2027 and 2028 and said more of its capital would probably go to spectrum, which could reduce buybacks or raise debt.
- Debt and interest. Total debt is $89.4bn including tower obligations and leases, and net interest expense rose 11.6% in the quarter to $1,031m.
- Leadership change. Jessica Uhl is taking over from Peter Osvaldik as chief financial officer; a new finance chief may change priorities for spending and shareholder returns.
- Valuation risk. Our value depends heavily on the terminal value, 63.8% of enterprise value, and on a 7.16% cost of capital; a higher rate or slower long-term growth would bring it closer to the share price.
FAQ
What value does QSILabs put on T-Mobile stock?
Our discounted cash flow model gives $281.35 a share, against a $160.15 close on 2 November 2026. Across costs of capital from 6.16% to 8.16% and terminal growth from 1.5% to 3.5% the value ranges from $205.96 to $460.99. A two-stage cross-check gives $267.89.
Should I buy T-Mobile stock after the Q3 2026 results?
We do not give personal advice. On our numbers the shares trade well below the value of their cash flows, and the third quarter showed higher ARPA, higher profit and raised guidance. But account growth slowed and churn rose, and the case depends on the cost of capital and steady long-term cash flow, so read the risks above before deciding.
How much revenue did T-Mobile make last quarter?
T-Mobile reported revenue of $23,584m for the third quarter of 2026, the three months to 30 September, up 7.4% from $21,957m. Service revenue was $19,375m, of which postpaid $16,269m, and equipment revenue $3,929m. Net income was $3,455m, or $3.22 a diluted share.
What dividend does T-Mobile pay?
T-Mobile paid $1.02 a share in September and has declared $1.17 a share, up 15%, payable on 10 December 2026 to shareholders of record on 25 November. At $4.68 a year that is a yield of about 2.9% at the $160.15 close on 2 November 2026.
What price target do analysts have for TMUS?
The 28 analysts tracked by S&P Global have an average target of $225.64, about 41% above the $160.15 close on 2 November 2026, with a median of $235, a low of $165 and a high of $296. Their consensus rating is Buy.
How much does T-Mobile owe?
Total debt excluding tower obligations was $86.0bn at 30 September 2026 and net debt on the same basis $80.3bn, according to T-Mobile. Including $3.4bn of tower obligations, the debt we deduct in our valuation is $89.4bn, against cash of $5.6bn.
What did T-Mobile change in its 2026 outlook?
T-Mobile now expects about 1.0m postpaid net account additions, Core Adjusted EBITDA of $37.35bn to $37.45bn, up $100m at the midpoint, adjusted free cash flow of $18.7bn to $18.8bn, service revenue of about $76.8bn and an effective tax rate of 24% to 25%, down from 25% to 26%. Capital spending is still about $10bn.
What is T-Mix?
T-Mix is a range of T-Mobile wireless plans launched in October 2026 that lets customers choose which benefits they want and change them later. Gopalan said "84% of surveyed customers want more control of how their wireless plans are structured".
Who runs T-Mobile?
Srini Gopalan is chief executive of T-Mobile US. Peter Osvaldik is chief financial officer and is handing over to Jessica Uhl, the chief financial officer-designate, over the coming months.
Sources
- T-Mobile US, Inc., third-quarter 2026 earnings release (Form 8-K, Exhibit 99.1, 28 Oct 2026; accession 0001283699-26-000128) www.sec.gov
- T-Mobile US, Inc., third-quarter 2026 supplementary financial and operating data (Form 8-K, Exhibit 99.2, 28 Oct 2026; accession 0001283699-26-000128) www.sec.gov
- T-Mobile US, Inc., Form 10-Q for the quarter ended 30 Sep 2026 (filed 28 Oct 2026; accession 0001283699-26-000129) www.sec.gov
- T-Mobile US, Inc., update of 2027 targets (Form 8-K, Exhibit 99.1, 11 Feb 2026; accession 0001193125-26-045679) www.sec.gov
- SEC XBRL company facts for T-Mobile US, Inc. (CIK 1283699): annual revenue, operating income, operating cash flow and capital expenditure from Forms 10-K data.sec.gov
- T-Mobile (TMUS) Q3 2026 earnings call transcript, 28 Oct 2026 (The Motley Fool; accessed 2 Nov 2026) www.fool.com
- StockAnalysis: T-Mobile US forecast and analyst ratings, S&P Global data (accessed 2 Nov 2026) stockanalysis.com
- StockAnalysis: T-Mobile US statistics (accessed 2 Nov 2026) stockanalysis.com
- MarketLine, Wireless Telecommunication Services North America (NAFTA) Industry Guide 2021-2030, July 2026 (MarketPublishers summary) pdf.marketpublishers.com
- Yahoo Finance chart data: TMUS closing prices and dividends (November 2025 to November 2026) query1.finance.yahoo.com
- Damodaran Online: industry betas (global) and equity risk premiums, January 2026 pages.stern.nyu.edu
- QSILabs T-Mobile US discounted cash flow model (internal; price as of 2 Nov 2026)
Disclaimer
This article is for information only and is not investment advice, a recommendation or an offer to buy or sell any security. QSI Labs and its authors may hold positions in the securities discussed. Forecasts and valuations are estimates that depend on assumptions that may prove wrong. Figures are taken from company filings and third-party sources believed to be reliable, but we do not guarantee their accuracy. Do your own research or consult a licensed adviser before investing.
More from QSI Labs
Related analysis: Verizon stock Q3 2026: phones and fiber, Comcast stock Q3 2026: broadband and Peacock, Cisco stock Q3 2026: AI networking orders and Netflix stock Q3 2026: ads and buybacks.
Read our white paper, QSI Labs: An AI-Native Trading Firm Built on a Training Loop (October 2026), available on request, or browse the research index.