Research / Earnings and valuation
ServiceNow Stock Q3 2026:Revenue Up 20.5% as the AI Target Rises to $1.7bn
As of: Figures are as of ServiceNow's third-quarter 2026 results (the quarter ended 30 September 2026, reported 28 October 2026 in a Form 8-K) and its Form 10-Q for the same quarter. ServiceNow's fiscal year is the calendar year, so its Q3 2026 covers July to September 2026. The share price used in our valuation is the NYSE close of NOW on 2 November 2026, $106.01; per-share figures reflect the five-for-one stock split of December 2025. Analyst data were accessed on 2 November 2026. Published 2 November 2026.
The short answer. ServiceNow stock Q3 2026 is a story of strong results and a weak share price. ServiceNow reported revenue of $4,106m for the three months to 30 September 2026, up 20.5%, beat the top of its own guidance for subscription revenue, current remaining performance obligations (cRPO) and operating margin, and raised its target for annual contract value (ACV) from AI products to $1.7bn by the end of 2026. But it guided to cRPO growth of 18.5% in constant currency for the fourth quarter, against 21% in the third, and the shares fell 27.0% the next day. GAAP operating income fell 32.7% to $385m because of acquisition amortisation, stock-based pay and severance. Our discounted cash flow model values the shares at $74.66, against a $106.01 close on 2 November 2026; that gap rests mostly on an 11.23% cost of capital and on treating stock-based pay as a cost, so we show below how far it moves when you change those and the other inputs.
Key takeaways
- Revenue grew 20.5%. Total revenue was $4,106m and subscription revenue $3,988m, up 20.9%, or 20.5% in constant currency, 50 basis points above the top of ServiceNow's guidance.
- Backlog grew too. cRPO, contracted revenue due in the next 12 months, was $13.65bn, up 20.5%, or 21% in constant currency. Total remaining performance obligations were $29.7bn, up 22%.
- AI target raised again. ServiceNow now expects AI ACV of $1.7bn by the end of 2026, against $1bn at the start of the year. AI net new ACV grew 65% in the quarter.
- GAAP profit fell. GAAP operating income was $385m, down from $572m, a margin of 9.5%. Non-GAAP operating income rose 17.4% to $1,338m, a margin of 32.5%, 150 basis points above guidance.
- The Q4 cRPO guide hit the shares. ServiceNow expects cRPO growth of 18.5% in constant currency in the fourth quarter. The shares fell from $150.13 to $109.67 on 29 October.
- Acquisitions changed the balance sheet. ServiceNow bought Armis for about $7.6bn and Veza for about $1.2bn in 2026, and debt rose to $7.52bn from $1.49bn at the end of 2025.
- Our value: $74.66 a share, against a $106.01 close on 2 November 2026. A two-stage cross-check gives $74.77; with the 10.50% US software cost of capital the model gives $81.85. Analysts' average target is $154.69.
- What to watch. Whether cRPO growth recovers in 2027, AI consumption turning into revenue, the integration of Armis and Veza, and stock-based pay, which ServiceNow aims to cut to below 10% of revenue by 2029.
Key numbers from ServiceNow's Q3 2026 earnings
| Measure | Q3 2026 | Q3 2025 | Change |
|---|---|---|---|
| Subscription revenues | $3,988m | $3,299m | +20.9% |
| Professional services and other revenues | $118m | $108m | +9.3% |
| Total revenues | $4,106m | $3,407m | +20.5% |
| Gross profit | $2,895m | $2,633m | +10.0% |
| Income from operations (GAAP) | $385m | $572m | -32.7% |
| Non-GAAP income from operations | $1,338m | $1,140m | +17.4% |
| Net income | $277m | $502m | -44.8% |
| Diluted earnings per share | $0.27 | $0.48 | -43.8% |
| Non-GAAP diluted earnings per share | $1.00 | $0.95 | +5.3% |
| Free cash flow (non-GAAP) | $822m | $592m | +38.9% |
Source: ServiceNow Q3 2026 earnings release (Form 8-K, Exhibit 99.1). Per-share figures reflect the five-for-one stock split effective 17 December 2025.
ServiceNow Q3 2026 earnings: what happened
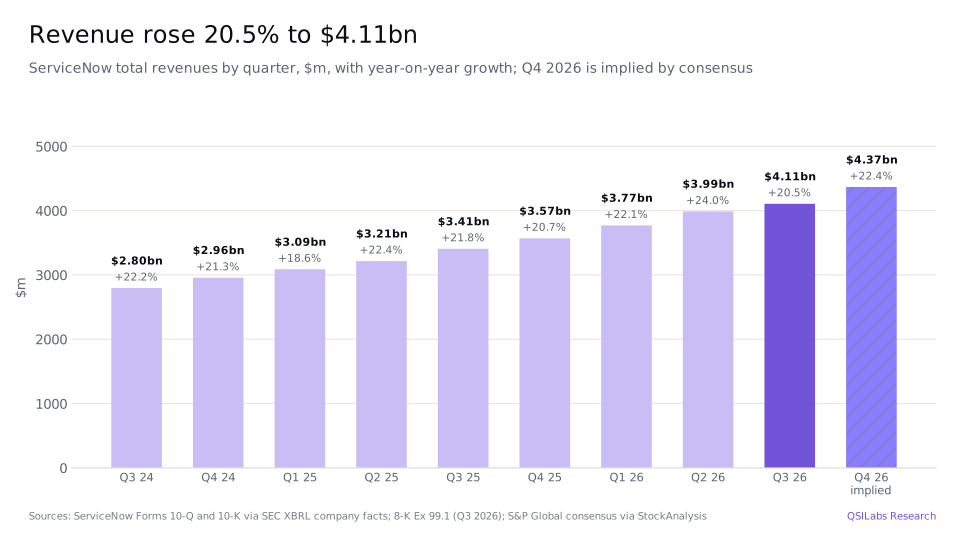
ServiceNow reported third-quarter results on 28 October 2026. Total revenue rose 20.5% to $4,106m from $3,407m. Subscription revenue, 97% of the total, rose 20.9% to $3,988m, or 20.5% in constant currency. Professional services and other revenue rose 9.3% to $118m. For the first nine months revenue was $11,863m, up 22.2%.
Chairman and chief executive Bill McDermott called the quarter "more than another beat-and-raise quarter" and "the inflection point for ServiceNow as the Super Intelligence Control Tower", the company's pitch to be the system that governs AI agents across a business. President and chief financial officer Gina Mastantuono said ServiceNow had exceeded "the high end of our guidance across every top line and profitability metric".
ServiceNow had 19 transactions worth more than $5m in net new ACV in the quarter, up more than 135%, and ended it with 680 customers paying more than $5m a year, up about 23%. The renewal rate was 98%. McDermott said the public sector again delivered in its biggest quarter of the year, and U.S. federal deals worth more than $1m grew more than 30%.
- 3 Nov 2025NOW closes at $182.77, its 52-week closing high (split-adjusted)Yahoo Finance
- 15 Dec 2025Acquisition of Moveworks completedForm 10-Q
- 17 Dec 2025Five-for-one stock split takes effect8-K Ex 99.1
- 31 Dec 2025NOW ends 2025 at $153.19Yahoo Finance
- 2 Mar 2026Veza acquired for about $1.2bnForm 10-Q
- 10 Apr 2026NOW closes at $83.00, its 52-week closing lowYahoo Finance
- 20 Apr 2026Armis acquired for about $7.6bn in cash, partly funded by a $4.0bn term loanForm 10-Q
- May 2026Financial Analyst Day targets for 2030; $4.0bn of senior notes issued and the term loan repaidQ2 2026 8-K Ex 99.1; Form 10-Q
- 28 Oct 2026Q3 results; AI ACV target raised to $1.7bn; NOW closes at $150.138-K Ex 99.1; Yahoo Finance
- 29 Oct 2026Shares fall 27.0% to $109.67 after the Q4 cRPO guidanceYahoo Finance; Q3 2026 earnings call
- 2 Nov 2026NOW closes at $106.01, the price used in our valuationYahoo Finance
Why did ServiceNow shares fall 27% after the results?
The shares closed at $150.13 on 28 October, before the results, and at $109.67 on 29 October, down 27.0%. On the call, Wolfe Research analyst Alex Zukin said the stock was "down pretty meaningfully after market on some of the, I think, the 4Q guide", and the guidance for cRPO stood out: ServiceNow expects growth of 18.5% in constant currency in the fourth quarter, against 21% in the third.
Mastantuono gave three reasons. Strong early renewals in the third quarter, which she said contributed about half of the cRPO beat, were pulled forward from the fourth. Strong public sector demand is raising the share of on-premise deals in the fourth quarter, which counts toward revenue but not cRPO, a 25 basis point headwind. And ServiceNow has started to include delivery expertise with some large AI deals; that part of the contract is booked as professional services rather than subscription revenue, which she put at about 25 basis points of subscription growth in the third quarter and about 50 in the fourth. She said the value returns to subscription revenue when the contracts renew.
For the fourth quarter ServiceNow expects subscription revenue of $4,245m to $4,255m, up 22.5% to 23%, or 21.5% in constant currency, a non-GAAP operating margin of 32% and a GAAP operating margin of 12%. For 2026 it raised its subscription revenue guidance by $15m at the midpoint to $15,780m to $15,790m, up 22.5%, and its free cash flow margin target to 36% from 35%, which Mastantuono said was "driven by lower CapEx spend". It kept its non-GAAP operating margin guidance at 31.5%, up 50 basis points from 2025.
Why did GAAP operating income fall while revenue grew 20.5%?
Because of costs ServiceNow excludes from its non-GAAP figures. Stock-based compensation rose to $633m, 15.5% of revenue, from $492m. Amortisation of purchased intangibles rose to $198m from $33m after the Armis and Veza acquisitions. Severance was $87m, against $24m, and acquisition-related costs $35m. Together these came to $953m, against $568m a year earlier.
GAAP gross profit rose 10.0% to $2,895m, and the subscription gross margin fell to 73.5% from 80%, as reported. Sales and marketing rose 20.4% to $1,271m and research and development 27.5% to $956m. GAAP operating income fell 32.7% to $385m, a margin of 9.5% against 17%. Interest expense rose to $81m from $6m after the acquisition borrowing, and interest income fell to $69m from $115m as cash was spent. Net income fell 44.8% to $277m, or $0.27 a diluted share.
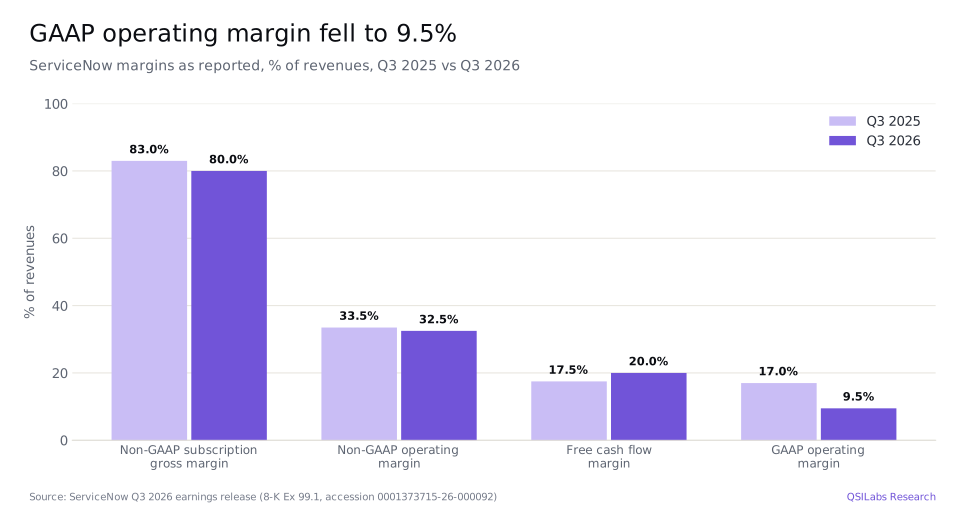
Excluding those items, non-GAAP operating income rose 17.4% to $1,338m and non-GAAP earnings per share rose 5.3% to $1.00. Mastantuono said internal use of AI is "now generating more than $1 billion in annualized value", more than double the level at the end of 2025. She said that lets ServiceNow hire fewer support and operations staff while quota-carrying sales staff are up by double digits.
How fast is ServiceNow's AI business growing?
Faster than the rest. AI net new ACV grew 65% in the third quarter, McDermott said, and net new ACV for Control Tower grew more than six times. The number of AI deals worth more than $1m grew 4.5 times, and EmployeeWorks, an AI assistant for employees, reached $100m of ACV in less than three quarters. ServiceNow started 2026 with a target of $1bn of AI ACV by the end of the year, raised it to $1.5bn at its Financial Analyst Day in May, and now expects $1.7bn or more.
Mastantuono said consumption of agentic AI in production is up more than 13 times so far this year, and that the company is "absolutely on path and trajectory" to its target for AI to make up 30% of ACV by 2030. McDermott said seat-based pricing still suits customers' budgets, while consumption could raise revenue per user "by a factor of 5x". Asked by William Blair's Arjun Bhatia whether AI adds to or replaces software spending, McDermott said the business cases for AI projects show returns 10 times greater than earlier software.
ServiceNow also completed two security acquisitions this year: Veza, an AI identity security company, on 2 March for about $1.2bn, and Armis, which manages security risk on connected devices, on 20 April for about $7.6bn in cash. McDermott called ServiceNow "the fastest-growing cybersecurity company at scale"; Security and Risk products were in 16 of the top 20 deals in the quarter.
How did ServiceNow grow by region?
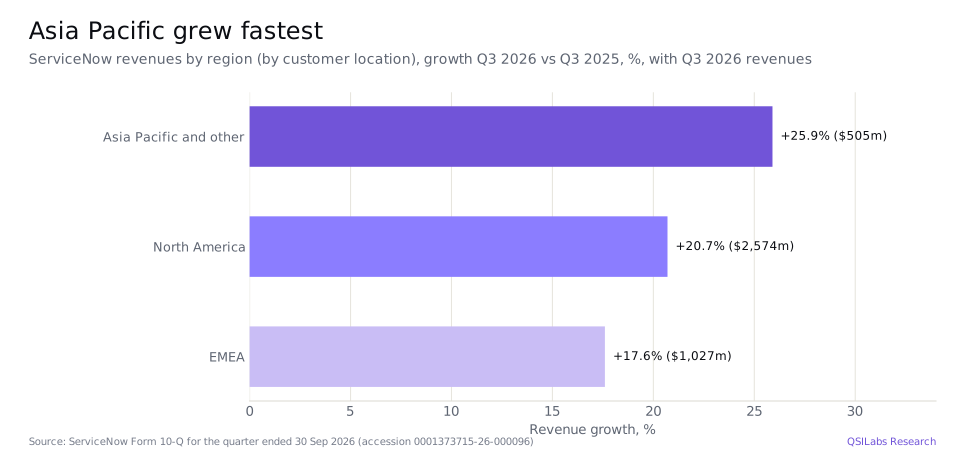
All three regions grew by double digits. North America, 63% of revenue, grew 20.7% to $2,574m; the United States accounts for 95% of the region. Europe, the Middle East and Africa grew 17.6% to $1,027m, and Asia Pacific and other 25.9% to $505m.
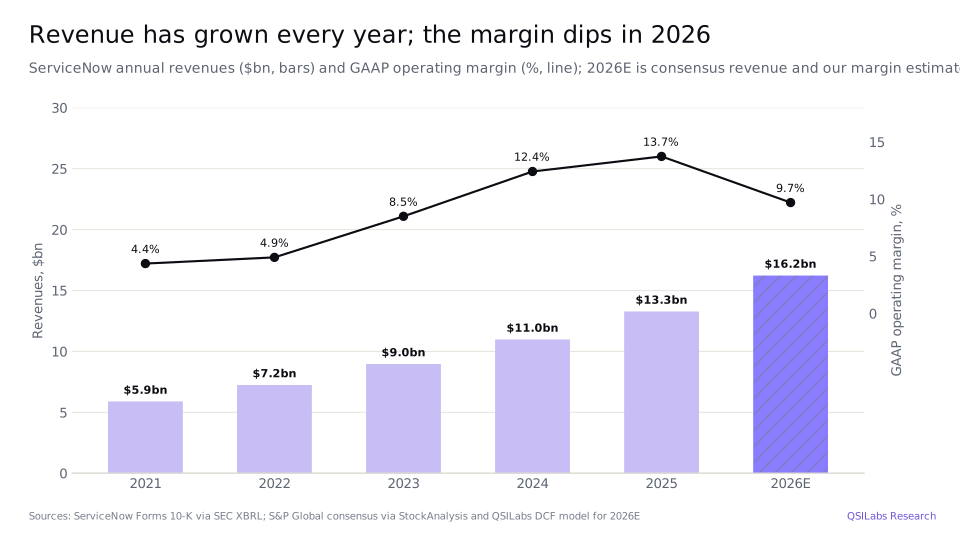
Over a longer period, revenue has grown from $5.9bn in 2021 to $13.3bn in 2025, and consensus is $16.23bn for 2026. The GAAP operating margin rose from 4.4% in 2021 to 13.7% in 2025; on our estimate it falls to 9.7% in 2026, close to ServiceNow's guidance of 10%, because of acquisition amortisation and costs.
How much cash does ServiceNow generate?
A lot, before stock-based pay. Cash flow from operations was $5,444m in 2025 and capital spending $868m, leaving free cash flow of $4,576m, up from $3,415m in 2024. Stock-based compensation, which does not use cash but dilutes shareholders, was $1,955m in 2025. In the first nine months of 2026 cash flow from operations was $3,096m and capital spending $346m, down from $630m; ServiceNow's non-GAAP free cash flow, which adds back $371m of acquisition-related costs, was $3,121m.
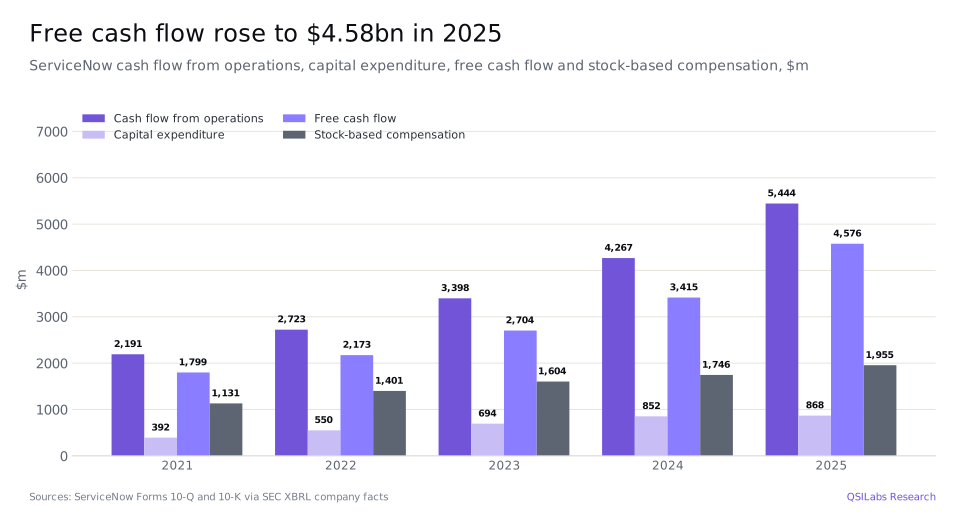
ServiceNow pays no dividend. It bought back $2,225m of shares in the first nine months of 2026, none in the third quarter, and had about $4.2bn left under its repurchase authorisation at 30 September. Debt was $7,524m: $2,086m due within a year, mostly commercial paper at an average rate of 4.05%, and $5,438m of long-term notes, including $4.0bn issued in May 2026 to repay the term loan that funded Armis. Cash and marketable securities were $6,961m.
How has NOW stock performed in 2026?
Badly. NOW closed at $106.01 on 2 November 2026, down 30.8% from $153.19 at the end of 2025 and 42.0% below its 52-week closing high of $182.77 on 3 November 2025. The 52-week closing low was $83.00 on 10 April 2026. The shares recovered to $147.99 at the end of August before the 27.0% fall on 29 October.
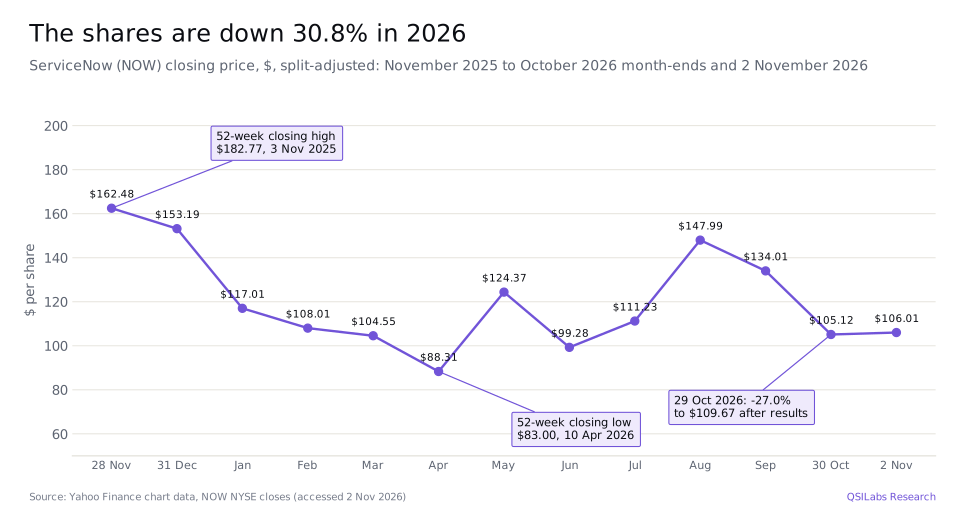
The 49 analysts compiled by StockAnalysis from S&P Global data have an average price target of $154.69, a median of $155, a low of $72 and a high of $266, and their consensus rating is Strong Buy. They expect non-GAAP earnings per share of $3.95 in 2026 and $4.80 in 2027, so the shares trade at about 27 times this year's expected earnings and 22 times next year's.
ServiceNow stock Q3 2026: is NOW overvalued?
On our numbers, yes. Our discounted cash flow model values ServiceNow at $74.66 a share, about 30% below the $106.01 close on 2 November 2026. At that price the market value of the equity was about $110.1bn on 1,038.3m shares, and the enterprise value, adding debt of $7.5bn and deducting cash and marketable securities of $7.0bn, about $110.6bn: 36 times our estimate of 2026 unlevered free cash flow, $3.09bn. Our free cash flow is lower than ServiceNow's own measure, which was 36% of revenue in its guidance, because we count stock-based pay as a cost.
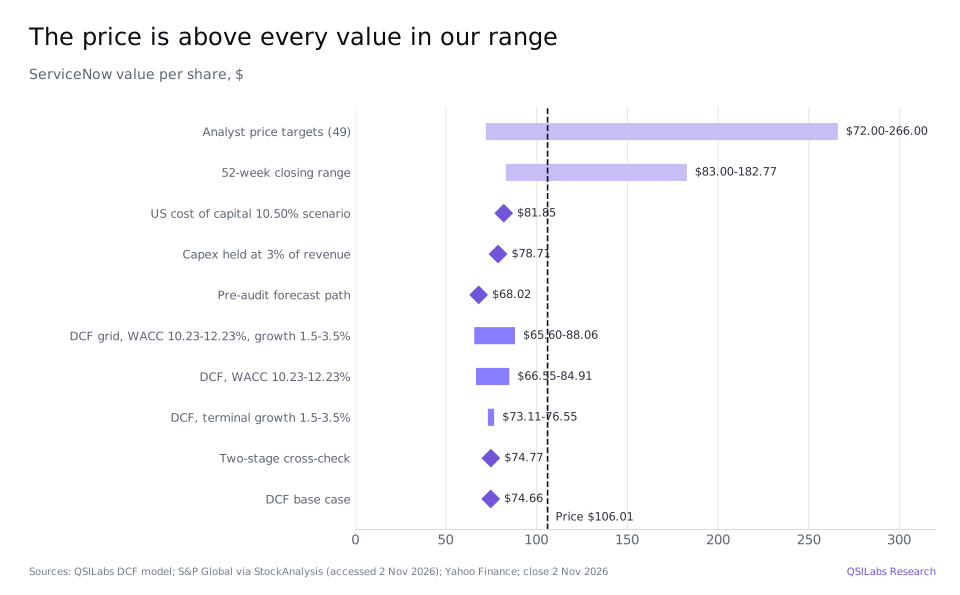
We discount forecast cash flows at a cost of capital of 11.23%. It uses a US 10-year Treasury yield of 5.12%, a beta of 1.36 and an equity risk premium of 4.80%, giving a cost of equity of 11.66%. The beta is the global software (system and application) industry's unlevered beta of 1.30 relevered at ServiceNow's debt-to-equity ratio of 0.07. The risk premium is the average of regional premiums weighted by where ServiceNow's users are: the U.S. was 59.7% of revenue in the first nine months of 2026, Europe, the Middle East and Africa 25.3%, Asia Pacific and other 11.8% and Canada 3.1%. Debt is 6.4% of capital, at an after-tax cost of 4.85%. After 2035 we assume growth of 2.5% a year; that terminal value is 51.1% of our enterprise value of $77.8bn. Adding cash and marketable securities of $6.96bn, deducting debt of $7.52bn and adding $0.28bn for cash generated between 30 September and 2 November, net of interest, gives equity value of $77.5bn, or $74.66 a share. We do not add the $2.05bn of strategic investments, about $1.97 a share.
For 2026 we use consensus revenue of $16.23bn, from S&P Global Market Intelligence data published by StockAnalysis, which implies fourth-quarter revenue of about $4.37bn, up 22.4%. For 2027 we use consensus revenue of $19.26bn, up 18.7%. For 2028 growth of 18.3% takes revenue to $22.78bn, in line with the consensus three-year forecast of 19.71% annual growth from 2025. Growth of 16.4% a year in 2029 and 2030 takes revenue to $30.85bn, which matches ServiceNow's target, set at its May 2026 Financial Analyst Day, of "$30 billion+ in subscription revenues" by 2030 once professional services are added at their current 2.8% share. Growth is then 14.1% in 2031, Precedence Research's forecast of annual growth in the IT service management market from 2026 to 2035 (The Business Research Company forecasts 13.9% to 2030), before fading to 2.5% by 2035.
The GAAP operating margin is 9.7% in 2026 and rises to 13.5% in 2027, 16.7% in 2028, 21.1% in 2030 and 29.7% by 2034. We start from consensus earnings, which imply a non-GAAP operating margin of 32.0% in 2027 and 33.0% in 2028, and deduct stock-based pay, which we treat as a real cost: 13.4% of revenue in 2027, falling to 8% by 2031, plus 1% for payroll taxes on it. The resulting margin, 17.6% in 2027, converges by 2034 to 29.7%, the median of mature software companies such as Microsoft, Oracle, Adobe, Intuit and SAP. We then deduct amortisation of acquired intangibles, which ServiceNow's 10-Q puts at $783m in 2027 falling to $649m in 2030. Tax is 21%, the long-term rate ServiceNow uses for its non-GAAP results. Capital spending is 3.0% of revenue in 2026 and 2027, in line with ServiceNow's guidance of 3% for 2026, rising to 7.6% by 2035, the level our house rule sets so that long-run investment is consistent with 2.5% growth and a 15% return on new capital.
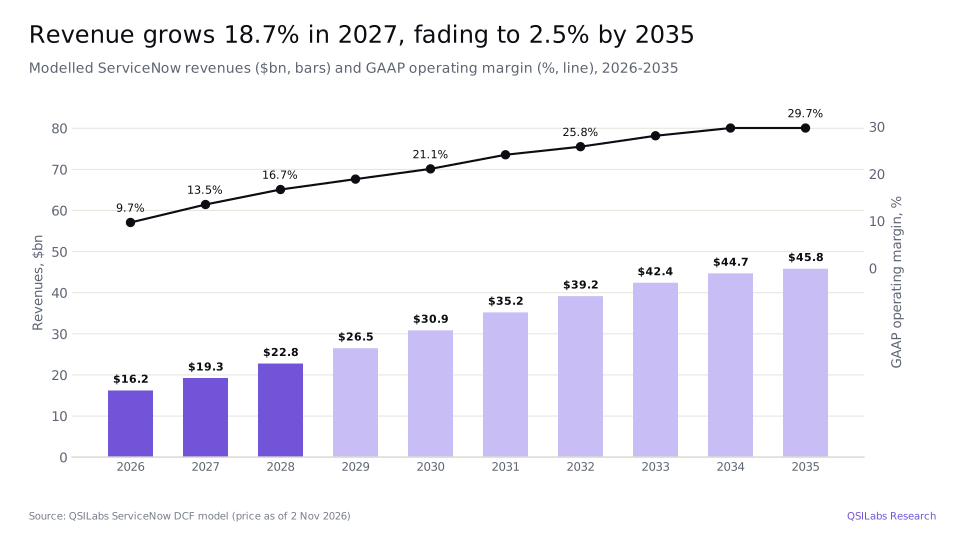
We forecast unlevered free cash flow of $3.09bn in 2026 and $4.00bn in 2027, rising to $6.54bn in 2030 and $8.96bn in 2035; only the part of 2026 after 2 November is discounted. Our previous model, dated 28 October and priced at $150.13, gave $74.82. It used the 10.50% cost of capital for US software companies, pre-results consensus earnings, revenue growth of 18.8% in 2027 and 17% in 2028 falling to 3.5% in 2035 without a cited source, depreciation and amortisation of 5% of revenue, capital spending of $900m in 2027 and a 20% tax rate; it also entered the margin before acquisition amortisation as the GAAP operating margin. Run in today's model, that old growth path gives $68.02, so the sourced forecast adds value. With the old 10.50% cost of capital the new forecast gives $81.85, and with capital spending held at 3% of revenue throughout it gives $78.71.
How the number moves if you argue with us
The table shows our value per share at different costs of capital and terminal growth rates. Even at a 10.23% cost of capital and 3.5% terminal growth, the model gives $88.06, about 83% of the share price.
| Cost of capital | Growth 1.5% | Growth 2.0% | Growth 2.5% | Growth 3.0% | Growth 3.5% |
|---|---|---|---|---|---|
| 10.23% | $82.42 | $83.60 | $84.91 | $86.38 | $88.06 |
| 10.73% | $77.50 | $78.44 | $79.47 | $80.62 | $81.90 |
| 11.23% | $73.11 | $73.85 | $74.66 | $75.55 | $76.55 |
| 11.73% | $69.17 | $69.75 | $70.38 | $71.08 | $71.84 |
| 12.23% | $65.60 | $66.06 | $66.55 | $67.09 | $67.68 |
A two-stage version of the model, which adds a 10-year period after 2035 in which growth fades gradually to 2.5% and returns on new investment fall to 2 percentage points above the cost of capital, gives $74.77. Using regional cost of capital tables, each with its own industry beta, gives a 10.52% cost of capital and $81.61.
Two checks point higher. The beta of 1.36 is well above ServiceNow's own five-year beta of 0.99, as reported by StockAnalysis, so the market has treated the stock as less risky than the average global software company; a lower beta would mean a lower cost of capital and a higher value. And our terminal value is only 7.0 times 2035 EBITDA, well below the multiple the market pays for ServiceNow today.
For the share price to be justified on our method, ServiceNow would need to keep growing well above 15% for longer than we assume, cut stock-based pay faster than we model, or keep capital spending near today's 3% of revenue as it grows. The company's commitment to bring stock-based pay below 10% of revenue by 2029 and its falling capital spending both point that way. On our numbers, the price already allows for much of that.
Risks to the ServiceNow investment case
- Slower bookings. cRPO growth is guided to 18.5% in constant currency for the fourth quarter, against 21% in the third. If it does not recover in 2027, revenue growth would slow toward that rate.
- AI and seat-based pricing. Investors question whether AI agents will reduce the number of software seats companies buy. ServiceNow is moving toward consumption pricing, which could raise revenue per user but makes revenue less predictable.
- Acquisitions. ServiceNow paid about $7.6bn for Armis and $1.2bn for Veza. Goodwill rose to $10.0bn from $3.6bn, amortisation of purchased intangibles rose to $198m a quarter and acquisition-related costs were $153m in the first nine months.
- Stock-based pay. Stock-based compensation was 15.5% of revenue in the third quarter. ServiceNow aims to cut it to below 10% by 2029; until then it dilutes shareholders or uses cash for buybacks.
- Higher interest costs. Debt rose to $7.52bn, and quarterly interest expense to $81m from $6m. About $2.1bn is commercial paper that has to be refinanced within months.
- Valuation risk. Our value depends on an 11.23% cost of capital built on an industry beta well above ServiceNow's own; with the 10.50% US software rate it rises to $81.85, and a lower rate still would raise it further.
FAQ
What value does QSILabs put on ServiceNow stock?
Our discounted cash flow model gives $74.66 a share, against a $106.01 close on 2 November 2026. Across costs of capital from 10.23% to 12.23% and terminal growth from 1.5% to 3.5% the value ranges from $65.60 to $88.06. A two-stage cross-check gives $74.77, and the model gives $81.85 with a 10.50% cost of capital.
Should I buy ServiceNow stock after the Q3 2026 results?
We do not give personal advice. On our numbers the shares trade above the value of their cash flows even after the 27% fall, although the third quarter beat guidance and the AI business is growing quickly. Our value depends heavily on the cost of capital and on treating stock-based pay as a cost, and analysts are more positive, so read the sensitivity table and the risks above before deciding.
How much revenue did ServiceNow make last quarter?
ServiceNow reported revenue of $4,106m for the third quarter of 2026, the three months to 30 September, up 20.5% from $3,407m. Subscription revenue was $3,988m and professional services and other revenue $118m. Net income was $277m, or $0.27 a diluted share, and non-GAAP earnings per share were $1.00.
What is ServiceNow's AI annual contract value target?
ServiceNow expects $1.7bn or more of annual contract value from AI products by the end of 2026. It started the year with a $1bn target and raised it to $1.5bn in May. AI net new ACV grew 65% in the third quarter, and the company aims for AI to make up 30% of ACV by 2030.
Does ServiceNow pay a dividend?
No. ServiceNow returns cash through share buybacks instead: it repurchased $2,225m of shares in the first nine months of 2026, none in the third quarter, and had about $4.2bn left under its authorisation at 30 September 2026.
What price target do analysts have for NOW?
The 49 analysts compiled by StockAnalysis have an average target of $154.69, about 45.9% above the $106.01 close on 2 November 2026, with a median of $155, a low of $72 and a high of $266. Their consensus rating is Strong Buy. Stifel kept a Buy rating and a $160 target on 29 October.
How much debt does ServiceNow have?
Debt was $7,524m at 30 September 2026: $2,086m due within a year, mostly commercial paper, and $5,438m of long-term senior notes. Cash and marketable securities were $6,961m, so net debt was about $0.56bn. ServiceNow issued $4.0bn of notes in May 2026 to repay the loan that funded Armis.
What companies did ServiceNow buy in 2026?
ServiceNow bought Veza, an AI identity security company, on 2 March 2026 for about $1.2bn, and Armis, a cyber-exposure management company, on 20 April 2026 for about $7.6bn in cash. It completed the purchase of Moveworks, which provides enterprise search and virtual agent technology, on 15 December 2025.
What guidance did ServiceNow give for Q4 2026?
ServiceNow expects fourth-quarter subscription revenue of $4,245m to $4,255m, up 21.5% in constant currency, cRPO growth of 18.5% in constant currency and a non-GAAP operating margin of 32%. For 2026 it expects subscription revenue of $15,780m to $15,790m, a non-GAAP operating margin of 31.5% and a free cash flow margin of 36%.
Who runs ServiceNow?
Bill McDermott is chairman and chief executive of ServiceNow, and Gina Mastantuono is president and chief financial officer. Amit Zavery is president, chief product officer and chief operating officer.
Sources
- ServiceNow, third-quarter 2026 financial results (Form 8-K, Exhibit 99.1, 28 Oct 2026; accession 0001373715-26-000092) www.sec.gov
- ServiceNow, Form 10-Q for the quarter ended 30 Sep 2026 (accession 0001373715-26-000096) www.sec.gov
- ServiceNow, second-quarter 2026 financial results, including the Financial Analyst Day targets (Form 8-K, Exhibit 99.1; accession 0001373715-26-000072) www.sec.gov
- SEC XBRL company facts for ServiceNow (CIK 1373715): quarterly and annual revenue, operating income, cash flow and stock-based compensation from Forms 10-Q and 10-K data.sec.gov
- ServiceNow Q3 2026 earnings call transcript, 28 Oct 2026 (The Motley Fool; accessed 2 Nov 2026) www.fool.com
- StockAnalysis: ServiceNow forecast and analyst ratings, S&P Global data (accessed 2 Nov 2026) stockanalysis.com
- StockAnalysis: ServiceNow statistics (accessed 2 Nov 2026) stockanalysis.com
- Precedence Research, IT Service Management Market size 2025-2035 (summary page, accessed 2 Nov 2026) www.precedenceresearch.com
- The Business Research Company, IT Service Management (ITSM) Global Market Report (summary page, accessed 2 Nov 2026) www.thebusinessresearchcompany.com
- Yahoo Finance chart data: NOW closing prices (November 2025 to November 2026) query1.finance.yahoo.com
- Damodaran Online: global industry betas and regional equity risk premiums, January 2026 pages.stern.nyu.edu
- QSILabs ServiceNow discounted cash flow model (internal; price as of 2 Nov 2026)
Disclaimer
This article is for information only and is not investment advice, a recommendation or an offer to buy or sell any security. QSI Labs and its authors may hold positions in the securities discussed. Forecasts and valuations are estimates that depend on assumptions that may prove wrong. Figures are taken from company filings and third-party sources believed to be reliable, but we do not guarantee their accuracy. Do your own research or consult a licensed adviser before investing.
More from QSI Labs
Related analysis: Oracle stock Q3 2026: OCI, RPO and capex, Microsoft stock Q3 2026: Azure and Copilot, IBM stock Q3 2026: software and Confluent and CrowdStrike stock Q3 2026: ARR and Falcon Flex.
Read our white paper, QSI Labs: An AI-Native Trading Firm Built on a Training Loop (October 2026), available on request, or browse the research index.