Research / Earnings and valuation
Oracle Stock Q3 2026:OCI Up 121%, a $664bn Backlog and $28.5bn of Quarterly Capex
As of: Figures are as of Oracle's fiscal first-quarter 2027 results (three months ended 31 August 2026, reported 10 September 2026 in a Form 8-K) and its Form 10-Q for that quarter (filed 11 September 2026), updated for the 28 October 2026 Investor Day and the debt and equity offerings launched on 2 November 2026. Oracle's fiscal year ends on 31 May, so its fiscal first quarter is the company's report for the summer of 2026, and we file it with our Q3 2026 earnings coverage. The share price is the NYSE close of ORCL on 30 October 2026, $130.67. Published 2 November 2026.
The short answer. Oracle stock Q3 2026 coverage means Oracle's fiscal first quarter of 2027, the three months to 31 August 2026. Revenue rose 30% to $19.3bn, cloud infrastructure (OCI) revenue rose 121% to $7.4bn and remaining performance obligations, the contracted backlog, reached $664bn. The cost is visible in the cash flow statement: capital spending of $28.5bn in a single quarter left free cash flow at minus $5.4bn, and Oracle sold $20bn of new shares to help pay for it. Our discounted cash flow model puts Oracle at $76.97 a share, against a $130.67 close on 30 October 2026. The growth is real and contracted; the question is how much cash it produces, and when.
Key takeaways
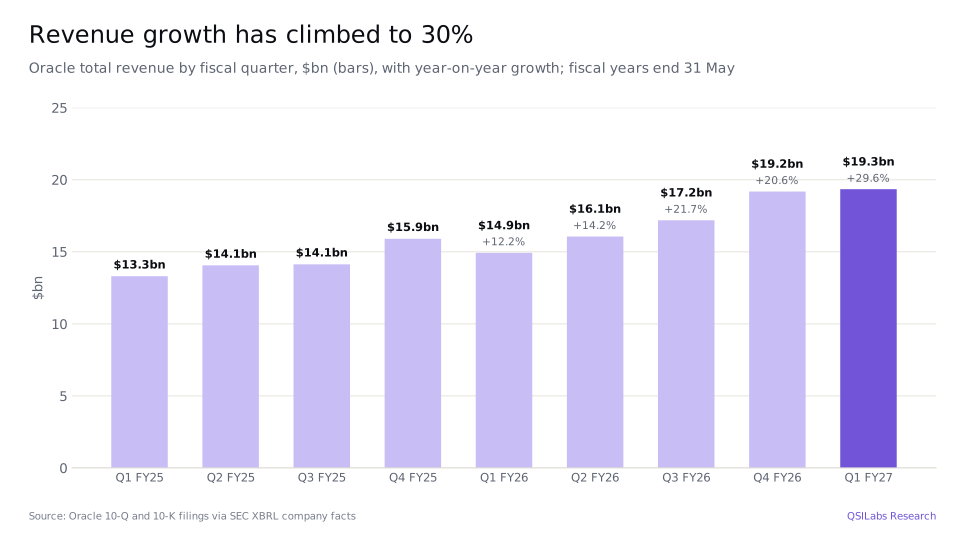
- Revenue up 30%. Fiscal Q1 FY2027 total revenue was $19,345m, up from $14,926m. Cloud revenue rose 62% to $11,607m and is now 60% of the total.
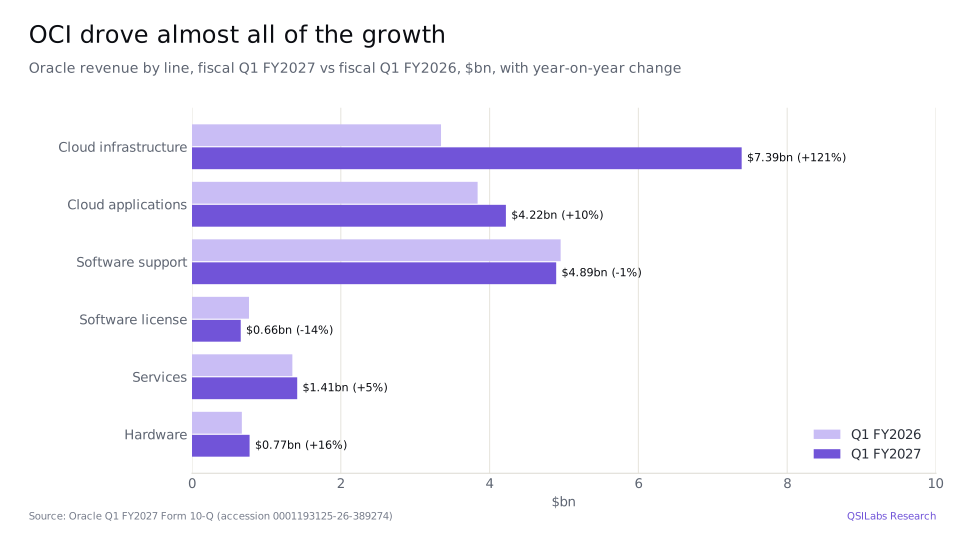
- OCI more than doubled. Cloud infrastructure revenue rose 121% to $7,388m, from $3,347m a year earlier. Cloud applications rose 10% to $4,219m; software revenue fell 3% to $5,550m.
- Earnings up 55%. GAAP operating income rose 57% to $6,728m, a 34.8% margin. Diluted EPS was $1.56, up from $1.01; non-GAAP EPS was $1.92, up 30%.
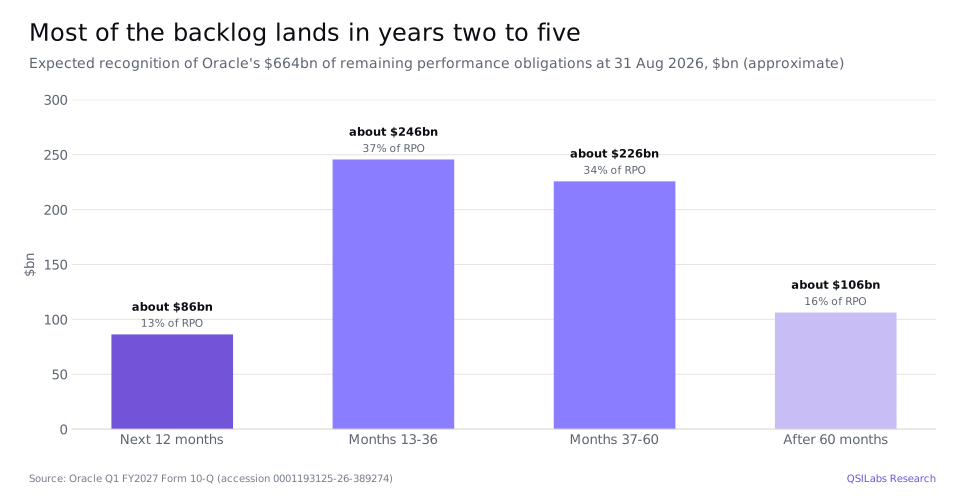
- A $664bn backlog. Remaining performance obligations rose $209bn in a year. Oracle expects to recognise about 13% (roughly $86bn) in the next 12 months and 37% in months 13 to 36.
- Capex of $28.5bn. Capital spending more than tripled from $8.5bn. Operating cash flow was a record $23.1bn, helped by $11.4bn of customer prepayments, so free cash flow was minus $5.4bn.
- More capital raised. Oracle sold $20bn of stock through its at-the-market programme in the quarter and on 2 November 2026 launched $10bn of senior notes and $10bn of common stock.
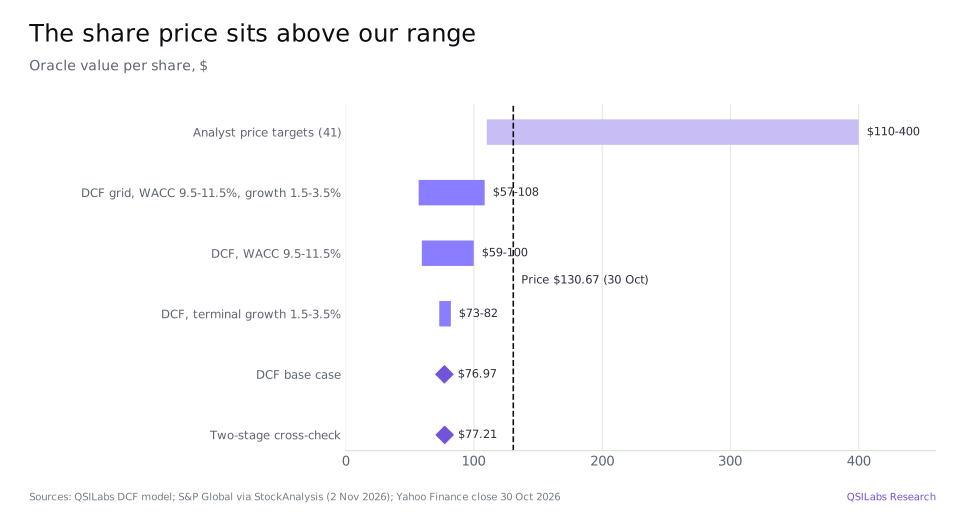
- Our value: $76.97 a share, up $0.11 from $76.85, and about 41% below the $130.67 close on 30 October. A two-stage cross-check gives $77.21; analysts' average target is $234.
Key numbers from Oracle's Q3 2026 earnings
| Metric | Fiscal Q1 FY2027 | Fiscal Q1 FY2026 | Change |
|---|---|---|---|
| Total revenue | $19,345m | $14,926m | +29.6% |
| Cloud revenue | $11,607m | $7,186m | +61.5% |
| Cloud infrastructure (OCI) | $7,388m | $3,347m | +120.7% |
| Cloud applications | $4,219m | $3,839m | +9.9% |
| Software revenue | $5,550m | $5,721m | -3.0% |
| GAAP operating income | $6,728m | $4,277m | +57.3% |
| GAAP operating margin | 34.8% | 28.7% | +6.1pt |
| Net income | $4,760m | $2,927m | +62.6% |
| Diluted EPS | $1.56 | $1.01 | +54.5% |
| Non-GAAP EPS | $1.92 | +30% | |
| Operating cash flow | $23,103m | $8,140m | +184% |
| Capital expenditure | $28,499m | $8,502m | +235% |
| Free cash flow | -$5,396m | -$362m | |
| Remaining performance obligations | $664bn | $455bn | +46% |
Oracle Q3 2026 earnings: what happened in fiscal Q1 FY2027
Oracle reported its fiscal first quarter on 10 September 2026 and filed its Form 10-Q the next day. Its fiscal year ends on 31 May, so the quarter ran from 1 June to 31 August 2026. That makes it the company's report for the summer of 2026 and the closest match to a calendar third quarter, which is why we cover it as Oracle's Q3 2026 earnings.
Growth accelerated again. Total revenue rose 29.6%, up from 12.2% in the same quarter a year earlier and 20.6% in fiscal Q4 2026. The source was almost entirely one business: cloud infrastructure, which rented out GPU and compute capacity to AI developers. Oracle said it delivered more than 300,000 GPUs to AI cloud customers since the end of fiscal Q4 and added 850MW of data center capacity, almost triple the capacity delivered in the previous quarter.
- 1 Jun 2026Fiscal 2027 begins; fiscal 2026 closed with revenue of $67.4bn and capital spending of $55.7bnForm 10-K
- 31 Aug 2026Fiscal Q1 FY2027 ends; the $20bn at-the-market share sale is complete (141 million shares, $19.9bn net)Form 10-Q
- 10 Sep 2026Fiscal Q1 results: revenue $19.3bn (+30%), OCI $7.4bn (+121%), RPO $664bn, free cash flow -$5.4bn8-K Ex 99.1
- 12 Sep 2026Larry Ellison cancels his 10b5-1 plan to sell Oracle stock; no shares were sold under it8-K Ex 99.1 (14 Sep)
- 28 Oct 2026Investor Day: fiscal 2030 targets of $225bn+ revenue and $21+ non-GAAP EPS; FY29 free cash flow of $30bn+8-K Ex 99.1 (28 Oct)
- 30 Oct 2026ORCL closes at $130.67 on the NYSE, the price used in our valuationYahoo Finance; 424B5
- 2 Nov 2026Oracle launches $10bn of senior notes and $10bn of common stock; ORCL closes at $119.22424B2; 424B5; Yahoo Finance
Profit rose faster than revenue. GAAP operating income rose 57% to $6,728m and the operating margin widened to 34.8% from 28.7%, as sales and marketing and research costs fell slightly while revenue rose by $4.4bn. The cost of running the cloud rose quickly too: cloud and software expenses rose 77% to $6,400m and depreciation more than doubled to $3,156m from $1,351m. Interest expense rose 55% to $1,428m as debt built up. Net income was $4,760m and diluted EPS $1.56, up 55%; on Oracle's non-GAAP measure, which excludes stock compensation, amortisation and restructuring, EPS was $1.92, up 30%.
The Americas did most of the work. Revenue there rose 42% to $13,711m, while EMEA and Asia Pacific each grew about 7%, to $3,726m and $1,908m. That pattern fits where Oracle is building its largest AI data centers.
How fast is Oracle Cloud Infrastructure growing?
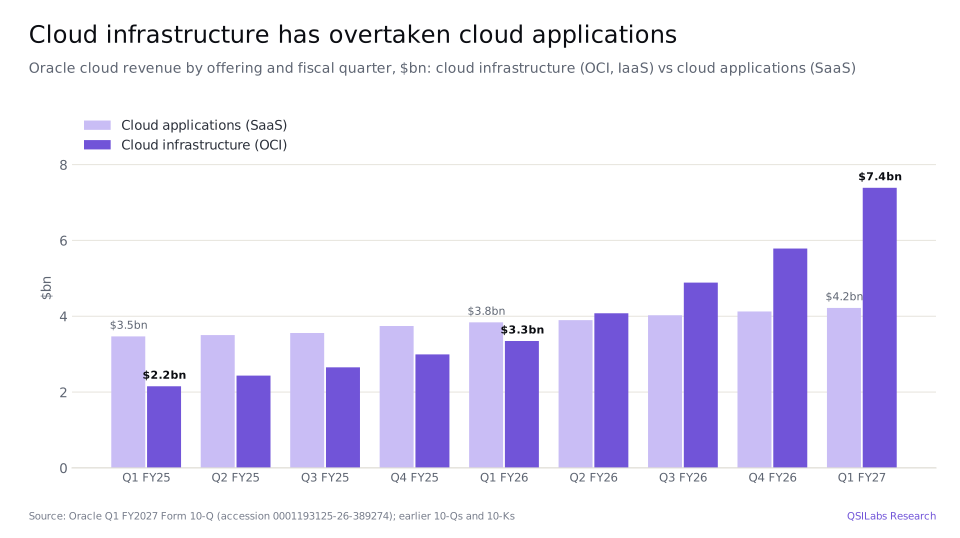
Very fast, and still speeding up. Cloud infrastructure revenue rose 121% to $7,388m in fiscal Q1 FY2027, after growth of 68% in fiscal Q2 2026, 84% in fiscal Q3 and 93% in fiscal Q4. In one year OCI has gone from a business smaller than cloud applications to one 75% larger. It is now 38% of Oracle's revenue, against 22% a year earlier.
The rest of Oracle is growing slowly. Cloud applications, which include Fusion ERP and NetSuite, grew 10% to $4,219m. Software support, the maintenance fees on licenses customers already own, fell 1% to $4,895m, and new license sales fell 14% to $655m as customers move to the cloud. Services rose 5% to $1,414m and hardware 16% to $774m. Taken together, everything except OCI grew about 3% in the quarter.
That split matters for the valuation. The legacy database and applications business is highly profitable and needs little capital. OCI needs enormous amounts of capital up front and earns its return over the life of long contracts. As OCI becomes the larger part of Oracle, the company's growth rises but its capital intensity rises much faster.
For the next quarter, Oracle guided to revenue growth of 30% to 34% and cloud revenue growth of 65% to 71% in US dollars, with non-GAAP EPS of $1.85 to $1.93. For the full fiscal year it expects revenue of at least $90bn, up about 34%, and non-GAAP EPS of $8.10.
What is Oracle's $664bn RPO and how fast will it turn into revenue?
Remaining performance obligations are revenue Oracle has contracted but not yet recognised. They stood at $664bn on 31 August 2026, up from $455bn a year earlier and $638bn at the end of May. Oracle said it booked more than $30bn of additional AI cloud contracts in the quarter. Two years earlier the figure was $99bn.
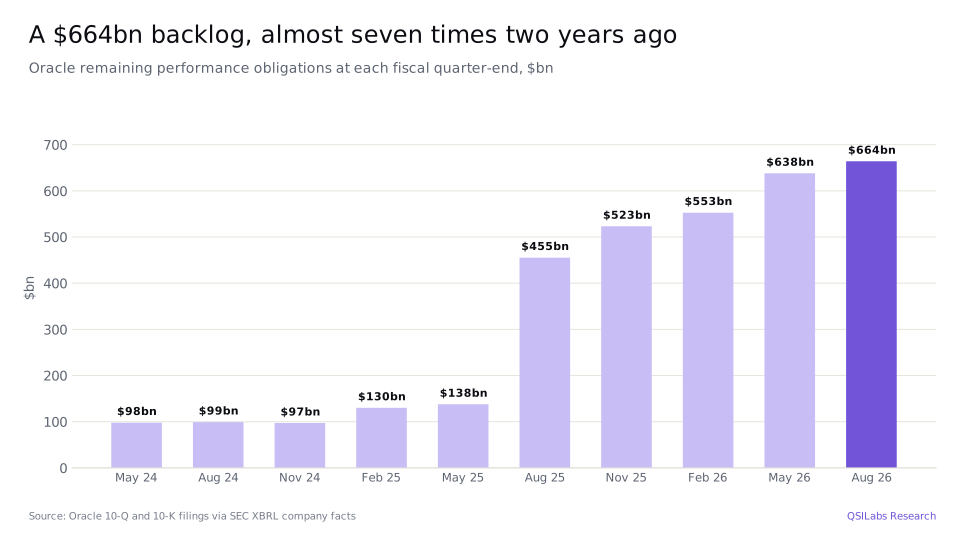
The backlog is long-dated. Oracle expects to recognise about 13% of it as revenue over the next 12 months, 37% in months 13 to 36, 34% in months 37 to 60 and the remainder after that. In dollars that is roughly $86bn in the first year, $246bn in the following two years, $226bn in the two years after that and $106bn later. Most of it depends on data centers that are still being built, many of them on sites leased from developers.
The backlog is also concentrated. Most of the increase since mid-2025 came from a small number of very large AI training and inference contracts; the largest customer is widely reported to be OpenAI. Oracle's filings describe the increase as "primarily attributable to certain significant cloud contracts". A contract of that size is only as good as the customer's ability to pay over five years or more, which is why we do not take the full $664bn at face value in our model.
How much is Oracle spending on AI data centers?
More than any quarter in its history. Capital spending was $28,499m in fiscal Q1 FY2027, against $8,502m a year earlier and $55,663m in the whole of fiscal 2026. Depreciation will follow: property, plant and equipment reached $127.8bn on the 31 August balance sheet.
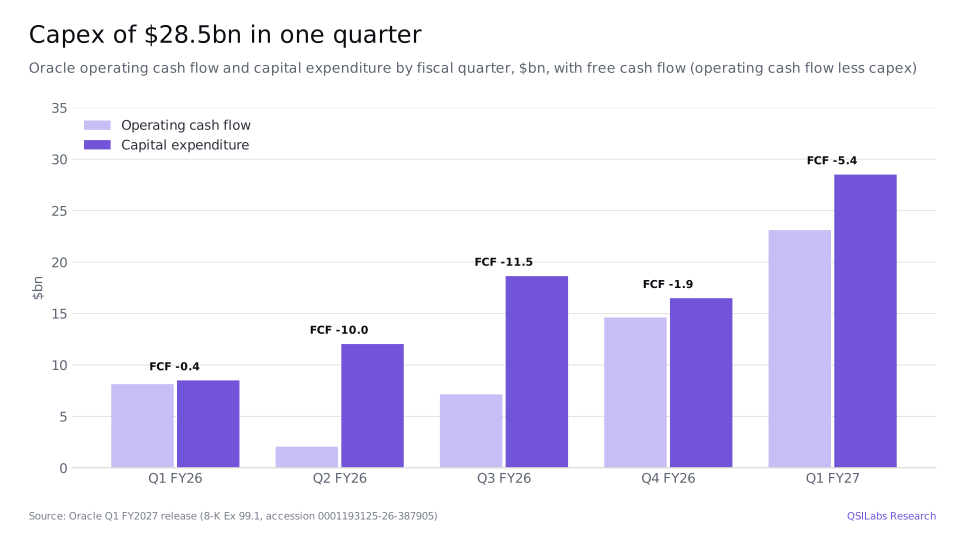
Operating cash flow rose 184% to a record $23,103m, but that included $11.4bn of prepayments from customers, cash received before Oracle delivers the capacity. Free cash flow, operating cash flow less capital spending, was minus $5,396m. It was negative in every quarter of fiscal 2026, for a total of minus $23.7bn. Oracle also reports a "net cash outlay" for capex that subtracts short-term financing tied to equipment and the customer prepayments; on that basis the quarter's outlay was about $18.0bn.
The on-balance-sheet figures understate the commitment. At 31 August Oracle had $288bn of additional lease commitments, substantially all for data centers, that had not yet started. They are expected to begin between fiscal Q2 2027 and fiscal 2029 and run for 15 to 19 years. Existing operating lease liabilities were $34.6bn and finance lease liabilities $9.2bn, and the company had a further $34.2bn of unconditional purchase obligations, mainly for cloud components and power.
How is Oracle paying for its AI build-out?
With a mix of shareholders' money, debt and customers' cash. In the quarter Oracle completed a $20bn at-the-market share programme, issuing 141 million shares for net proceeds of $19.9bn. Shares outstanding rose to 3,024 million from 2,880 million at the end of May, an increase of 5% in three months. It also repaid $4.2bn of notes and other borrowings, leaving $125.3bn of notes and borrowings against $36.4bn of cash and $0.7bn of marketable securities.
On 2 November 2026 Oracle launched two more offerings under a new shelf registration: $10bn of senior notes, in a floating-rate 2029 tranche and fixed-rate tranches due 2029, 2031, 2033, 2037 and 2046, and $10bn of common stock. Neither offering had been priced when we published. The proceeds are for general corporate purposes, which may include capital expenditure and repaying debt. These are the $10bn of equity and $10bn of gross debt Oracle described at its Investor Day as the only further capital it plans to raise through fiscal 2030, excluding refinancing.
The market did not welcome the news. ORCL closed at $119.22 on 2 November, down 8.8% on the day, near the bottom of its 52-week range of $114.99 to $257.85.
Oracle also lists other levers that reduce its up-front cash needs: vendor financing, hardware supplied by customers and customer prepayments. It still pays a quarterly dividend of $0.50 a share, about 1.5% a year at the 30 October price, which cost $1,565m in the quarter. On 12 September Larry Ellison, Executive Chair and Chief Technology Officer, cancelled a plan to sell Oracle shares; none had been sold under it.
What did Oracle promise at its 2026 Investor Day?
A great deal. On 28 October 2026 Oracle set a fiscal 2030 outlook of at least $225bn of revenue, more than 35% compound annual growth from fiscal 2026, a non-GAAP operating margin of 40% or more and non-GAAP EPS of at least $21. It said free cash flow will turn positive in the second half of fiscal 2028 and reach at least $30bn in fiscal 2029, after capital spending peaks in fiscal 2027 and 2028 and then steps down.
Oracle also said growth will be self-funded from fiscal 2029, and that net debt, including vendor financing and lease liabilities, will be below 3.5 times adjusted EBITDA that year. It reaffirmed its fiscal 2027 outlook of at least $90bn of revenue and non-GAAP EPS of $8.10. The shares rose 10.7% to $144.54 on the day, then gave back the gain over the next two sessions.
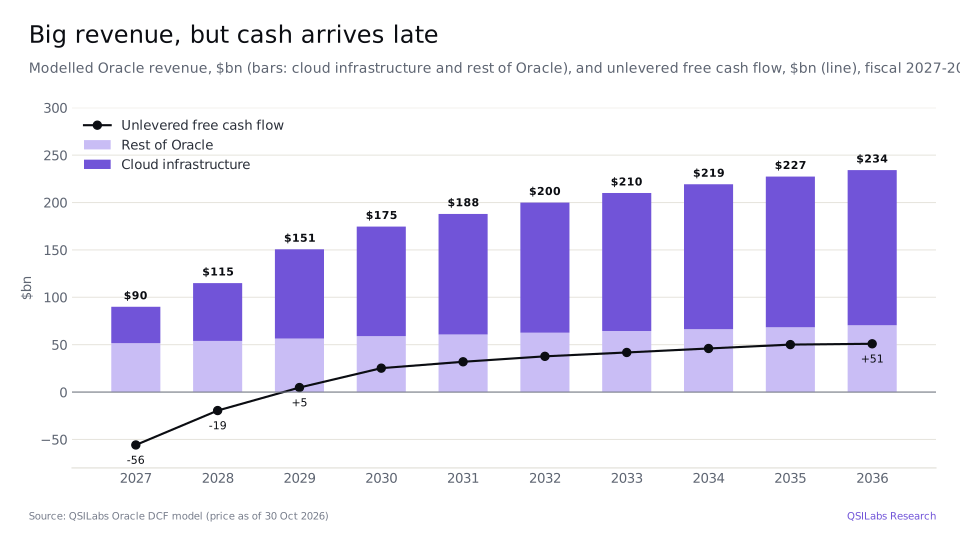
These targets are far above our forecast. If Oracle delivers $21 of non-GAAP EPS in fiscal 2030, the 30 October price would be about six times that figure, and the stock would look cheap. Our model reaches $175bn of revenue in fiscal 2030, not $225bn, and positive free cash flow in fiscal 2029 of about $5bn, not $30bn. The gap between those two paths is the whole debate about Oracle stock.
Oracle stock Q3 2026: is ORCL overvalued?
On our numbers, yes. Our discounted cash flow model values Oracle at $76.97 a share, against a $130.67 close on 30 October 2026. At that price Oracle's equity was worth about $395bn, and its enterprise value, after about $97bn of net debt, was close to $500bn. That is about 16 times the analyst consensus of $8.14 of non-GAAP EPS for fiscal 2027 and 22 times fiscal 2026 GAAP EPS of $5.83.
On earnings multiples that is not expensive for a company growing at 30%. The problem is cash. Oracle's earnings are rising, but its spending is rising much faster, and in our forecast free cash flow does not turn meaningfully positive until fiscal 2029. A large part of the value therefore sits years away and is exposed to the cost of capital, the price of GPUs and the health of a few customers.
We are not saying the business is weak. Oracle has a contracted backlog of $664bn, a profitable database and applications franchise, and a cloud business more than doubling. We are saying the price assumes that the AI build-out earns high returns quickly, and that the backlog converts in full and on time. Our enterprise value of $354bn is about 70% of the market's.
Analysts are much more optimistic. Of the 41 covering the stock tracked by StockAnalysis, the consensus rating is Buy, with an average price target of $234.10 and a range from $110 to $400. The consensus forecasts revenue of $90.4bn in fiscal 2027 and $131.9bn in fiscal 2028.
Method
We forecast cloud infrastructure and the rest of Oracle separately. OCI revenue follows the conversion schedule of the backlog, with a 9% haircut on contract value for counterparty risk at the largest AI customer. The rest of Oracle grows at about 3% to 5% a year. Together that gives revenue of $90.0bn in fiscal 2027, in line with Oracle's floor, $115.0bn in fiscal 2028, $150.6bn in fiscal 2029 and $234.2bn in fiscal 2036. We use a GAAP operating margin of 33.4% in fiscal 2027, easing to about 31% as depreciation on the new data centers builds.
Capital spending is about $96bn in fiscal 2027, including assets acquired under finance leases, then $73bn in fiscal 2028 and $62bn in fiscal 2029, before settling near 30% of revenue. We apply a 19% tax rate and discount the cash flows at a 10.5% weighted average cost of capital from Damodaran's January 2026 industry data; a bottom-up calculation gives 8.9%, which we show as a cross-check. After fiscal 2036 we assume growth of 2.5% a year and a 15% return on new investment. The terminal value is 70% of our enterprise value.
From the enterprise value of $354.4bn we subtract $134.5bn of debt and finance leases and add $37.1bn of cash and securities. We also deduct $0.4bn of minority interests, $5.0bn of convertible preferred stock, $10.6bn of AI customer prepayments that Oracle must still deliver as service and $5.7bn of estimated cash used between the 31 August balance sheet and the 30 October valuation date. That leaves equity of $235.3bn, or $76.97 a share on 3,057.7 million diluted shares.
Our value rose $0.11 a share in this update. Rolling the valuation date forward from 28 to 30 October added about $0.16, and two more days of estimated cash use took away about $0.05. The 2 November offerings are not in our base case because they had not been priced. As an illustration, selling $10bn of stock at the 2 November close of $119.22 would add about 84 million shares and $10bn of cash, lifting our value to about $78, because the shares would be sold above our estimate of their worth. The $10bn of notes would add equal amounts of cash and debt, leaving net debt unchanged until the money is spent.
How the number moves if you argue with us
The table shows our value per share at different costs of capital and terminal growth rates. Even at a 9.5% cost of capital and 3.5% terminal growth, the model reaches $108.34, about 17% below the 30 October price.
| Cost of capital | Growth 1.5% | Growth 2.0% | Growth 2.5% | Growth 3.0% | Growth 3.5% |
|---|---|---|---|---|---|
| 9.5% | $93.32 | $96.38 | $99.84 | $103.78 | $108.34 |
| 10.0% | $82.50 | $84.92 | $87.61 | $90.66 | $94.13 |
| 10.5% | $72.95 | $74.86 | $76.97 | $79.33 | $81.99 |
| 11.0% | $64.46 | $65.97 | $67.62 | $69.45 | $71.50 |
| 11.5% | $56.87 | $58.06 | $59.36 | $60.78 | $62.35 |
The bigger levers are the speed of backlog conversion, the margin on AI capacity and the amount of capital it takes. If Oracle hits its own fiscal 2030 targets, $225bn of revenue at a 40% non-GAAP operating margin with capex falling from fiscal 2029, our value would be far higher than the share price. If GPU rental prices fall, a large customer slows its spending, or the build-out costs more than planned, free cash flow would stay negative for longer and the value would fall below our range.
What are the biggest risks for Oracle stock?
- Customer concentration. A large share of the $664bn backlog comes from a few AI developers, and the largest is widely reported to be OpenAI. If one of them cannot fund its commitments, Oracle could be left with data centers and leases it must still pay for.
- Funding and leverage. Oracle has $125bn of notes and borrowings, $288bn of data center leases not yet started and negative free cash flow. It has now raised $20bn of equity and launched $20bn more of debt and equity. Higher rates or a credit rating cut would raise its cost of capital.
- Dilution. Shares outstanding rose 5% in one quarter, and the 2 November offering adds roughly 3% more at recent prices. Further issuance beyond the plan would reduce value per share.
- Execution on capacity. The backlog becomes revenue only when power, buildings and GPUs are ready. Delays in construction, power supply or chip deliveries would push revenue out while costs keep running.
- Pricing and technology risk. GPU rental prices could fall as more capacity comes online, and each new chip generation shortens the useful life of the last. Faster depreciation would cut margins.
- Upside risk. If Oracle converts the backlog on schedule, lands more contracts at good returns and reaches its target of $30bn of free cash flow in fiscal 2029, earnings and cash flow would be far above our forecast and our value would rise sharply.
FAQ
What is Oracle stock worth after its Q3 2026 earnings?
QSILabs values Oracle at $76.97 a share, based on a discounted cash flow model updated for the fiscal first-quarter 2027 results and the October 2026 Investor Day. That is about 41% below the $130.67 close on 30 October 2026. A two-stage cross-check gives $77.21; analysts' average price target is $234.10.
Is Oracle stock a buy after Q3 2026?
Our model says ORCL trades above what its cash flows justify, because heavy capital spending keeps free cash flow negative until fiscal 2029 in our forecast. The business is growing fast: revenue up 30%, cloud infrastructure up 121% and a $664bn contracted backlog. This is not investment advice.
Why does Q3 2026 for Oracle mean its fiscal first quarter of 2027?
Oracle's fiscal year ends on 31 May. Its fiscal first quarter of 2027 covered the three months from 1 June to 31 August 2026, the summer quarter, and was reported on 10 September 2026. It is the closest match to a calendar third quarter, so we include it in our Q3 2026 earnings coverage.
How much revenue did Oracle make in its latest quarter?
Oracle's fiscal Q1 FY2027 total revenue was $19,345m, up 29.6% from $14,926m. Cloud revenue was $11,607m, of which cloud infrastructure was $7,388m and cloud applications $4,219m. Software revenue was $5,550m, services $1,414m and hardware $774m.
What is Oracle's cloud infrastructure growth rate?
Oracle Cloud Infrastructure revenue rose 121% to $7,388m in the quarter to 31 August 2026, up from $3,347m a year earlier. Oracle guided to total cloud revenue growth of 65% to 71% in fiscal Q2 2027 and expects fiscal 2027 revenue of at least $90bn.
What is Oracle's RPO?
Oracle's remaining performance obligations were $664bn at 31 August 2026, up $209bn from a year earlier. Oracle expects to recognise about 13% as revenue in the next 12 months, 37% in months 13 to 36 and 34% in months 37 to 60, with the rest later.
Why is Oracle's free cash flow negative?
Because capital spending is running ahead of cash generation. In fiscal Q1 2027 operating cash flow was $23,103m, including $11.4bn of customer prepayments, while capital spending was $28,499m, so free cash flow was -$5,396m. Oracle expects free cash flow to turn positive in the second half of fiscal 2028.
What are Oracle's 2 November 2026 debt and stock offerings?
On 2 November 2026 Oracle launched $10bn of senior notes due between 2029 and 2046 and $10bn of common stock, in separate preliminary prospectus supplements. They are the $20bn of further funding Oracle said at its Investor Day it would raise through fiscal 2030. The shares fell 8.8% to $119.22 that day.
Does Oracle pay a dividend?
Yes. Oracle pays a quarterly dividend of $0.50 a share, a yield of about 1.5% at the 30 October 2026 price of $130.67. It paid $1,565m of dividends in fiscal Q1 2027, and also pays a 6.50% dividend on its Series D mandatory convertible preferred stock.
Sources
- Oracle Corporation, Q1 fiscal 2027 earnings release (Form 8-K, Exhibit 99.1, 10 Sep 2026; accession 0001193125-26-387905) www.sec.gov
- Oracle Corporation, Form 10-Q for the quarter ended 31 Aug 2026 (filed 11 Sep 2026; accession 0001193125-26-389274) www.sec.gov
- Oracle Corporation, Form 10-K for the fiscal year ended 31 May 2026 (filed 22 Jun 2026; accession 0001193125-26-277521) www.sec.gov
- Oracle Corporation, Forms 10-Q for the quarters ended 30 Nov 2025 and 28 Feb 2026 (accessions 0001193125-25-315925 and 0001193125-26-101045): cloud revenue by offering www.sec.gov
- Oracle Corporation, Investor Day 2026 press release (Form 8-K, Exhibit 99.1, 28 Oct 2026; accession 0001193125-26-435853) www.sec.gov
- Oracle Corporation, preliminary prospectus supplement for $10bn of senior notes (Form 424B2, 2 Nov 2026; accession 0001193125-26-442722) www.sec.gov
- Oracle Corporation, preliminary prospectus supplement for $10bn of common stock (Form 424B5, 2 Nov 2026; accession 0001193125-26-442729) www.sec.gov
- Oracle Corporation, automatic shelf registration statement (Form S-3ASR, 2 Nov 2026; accession 0001193125-26-442669) www.sec.gov
- SEC XBRL company facts for Oracle (CIK 1341439): quarterly and annual revenue, operating income, cash flow and remaining performance obligations data.sec.gov
- StockAnalysis: Oracle forecast and analyst ratings, S&P Global data (accessed 2 Nov 2026) stockanalysis.com
- Yahoo Finance chart data: ORCL closing prices (one year to 2 Nov 2026) query1.finance.yahoo.com
- Damodaran Online: cost of capital by industry (US), January 2026 pages.stern.nyu.edu
- QSILabs Oracle discounted cash flow model (internal; price as of 30 Oct 2026)
Disclaimer
This article is for information only and is not investment advice, a recommendation or an offer to buy or sell any security. QSI Labs and its authors may hold positions in the securities discussed. Forecasts and valuations are estimates that depend on assumptions that may prove wrong. Figures are taken from company filings and third-party sources believed to be reliable, but we do not guarantee their accuracy. Do your own research or consult a licensed adviser before investing.
More from QSI Labs
Related analysis: Microsoft stock Q3 2026, NVIDIA stock Q3 2026, Meta stock Q3 2026: Muse and AI capex and Cisco stock Q3 2026: AI networking orders.
Read our white paper, QSI Labs: An AI-Native Trading Firm Built on a Training Loop (October 2026), available on request, or browse the research index.