Research / Earnings and valuation
Mastercard stock Q3 2026:a $9.8bn quarter, 19% services growth and a stablecoin bet
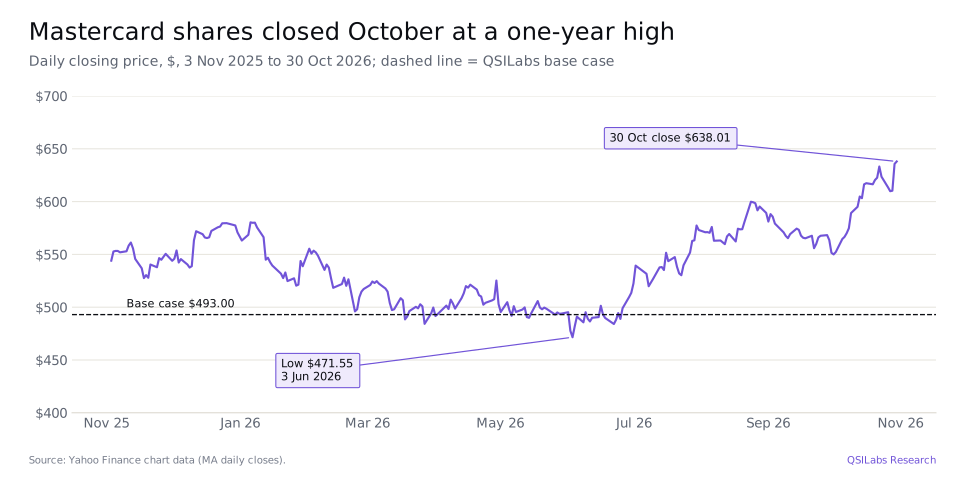
Mastercard stock ends October 2026 at a one-year high after a quarter that showed both halves of the business working at once. Mastercard stock in Q3 2026 rests on two engines: the card network, which grew payment network revenue 11%, and value-added services and solutions, which grew 19% and now make up 41% of net revenue. Net revenue rose 14% to $9.8bn and diluted earnings per share rose 22% to $5.28. All figures are as of Mastercard's Q3 2026 results, reported on 29 October 2026; share prices are as of the 30 October 2026 close of $638.01.
Key takeaways
- Value: the QSILabs discounted cash flow value for Mastercard (MA) is $493.00 per share as of its Q3 2026 results, against a $638.01 close on 30 October 2026, about 23% lower.
- Quarter: Mastercard net revenue was $9,807m in Q3 2026 (quarter ended 30 September 2026), up 14% from $8,602m a year earlier, with diluted EPS of $5.28 (+22%) and adjusted EPS of $5.31 (+21%) (Mastercard 8-K, 29 October 2026).
- Services: value-added services and solutions revenue rose 19% to $4,058m, while payment network revenue rose 11% to $5,749m.
- Network: gross dollar volume rose 7% in local currency to $2.95 trillion, cross-border volume rose 11% and switched transactions 9%.
- Outlook: Mastercard expects 2026 and fourth-quarter net revenue growth at the high end of the low double digits, currency-neutral and excluding acquisitions; analysts expect 2026 revenue of $37.35bn and 2027 revenue of $42.05bn.
- Cash returns: in the first nine months of 2026 Mastercard spent $11.9bn on buybacks and $2.3bn on dividends, more than its $10.7bn of free cash flow, and closed the $1.4bn acquisition of stablecoin company BVNK.
Mastercard stock Q3 2026 in brief
Short answer: Mastercard is growing faster than most companies of its size and turning about 60% of revenue into operating profit. Our discounted cash flow value is $493.00 per share (a QSILabs estimate), about 23% below the $638.01 close and little changed from $495.71 before the results. The quarter was strong and the gap is not about it. It is about how long growth stays in double digits: we assume net revenue growth of 12.6% in 2027, fading to 4% by 2035, an operating margin that edges up from 59% to 60% and an 8.09% discount rate. The share price implies a longer run of double-digit growth than that.
| Key number, Q3 2026 | Value | Year on year | Source |
|---|---|---|---|
| Net revenue | $9,807m | +14% | 8-K Ex 99.1 |
| Payment network revenue | $5,749m | +11% | 10-Q |
| Value-added services and solutions | $4,058m | +19% | 10-Q |
| Rebates and incentives | $6,369m | +18% | 10-Q |
| GAAP operating income / margin | $5,862m / 59.8% | from $5,061m / 58.8% | 8-K Ex 99.1 |
| Diluted / adjusted EPS | $5.28 / $5.31 | +22% / +21% | 8-K Ex 99.1 |
| Gross dollar volume | $2.95tn | +7% local currency | 8-K Ex 99.1 |
| Nine-month free cash flow | $10,718m | operating cash flow $11,859m | 10-Q |
| QSILabs value per share | $493.00 | vs $638.01 price | QSILabs estimate |
How did Mastercard do in Q3 2026?
Mastercard's third quarter was another quarter of double-digit growth across the board. Net revenue rose 14%, both as reported and on a currency-neutral basis, to $9.8bn. Operating expenses rose 11% to $3.9bn, so operating income rose 16% to $5.9bn and the operating margin widened by 0.9 points to 59.8%. A lower tax rate, 19.4% against 21.5% a year earlier, lifted net income 18% to $4.6bn, and a smaller share count turned that into 22% growth in diluted EPS, to $5.28.
Special items were small this quarter. Mastercard booked $74m of litigation provisions, mainly for settlements with merchants who opted out of US class actions. Excluding those and gains and losses on equity investments, adjusted net income was $4.7bn and adjusted EPS $5.31, up 21%, with an adjusted operating margin of 60.5%. Chief executive Michael Miebach called it "another strong quarter for Mastercard" and said: "From advancing Agentic Commerce to our new Global Money Platform through BVNK, we're shaping how people pay, manage and exchange across currencies."
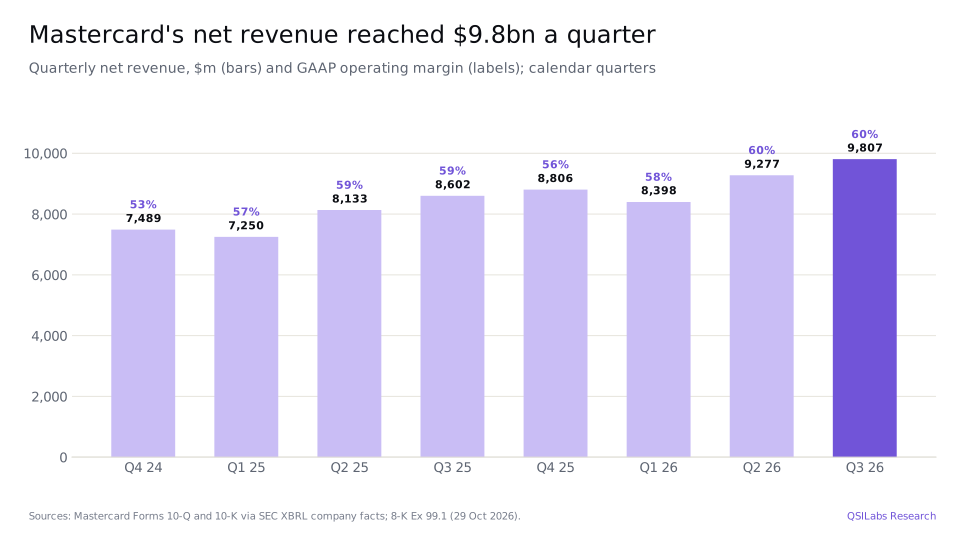
For the first nine months of 2026, net revenue was $27.5bn, up 15% (13% currency-neutral), operating income $16.4bn and net income $12.9bn, or $14.59 per diluted share. Adjusted EPS for the nine months was $14.94. The first quarter carried a $202m restructuring charge, which is why its margin looks lower in the chart.
- Q1 2026$202m restructuring charge; Q1 net revenue $8.4bnMastercard 10-Q
- 3 Jun 202652-week closing low of $471.55Yahoo Finance
- 30 Jul 2026Q2 2026 results: net revenue $9.3bnMastercard 10-Q
- 3 Aug 2026BVNK acquisition closes: $1.4bn in cash for a stablecoin infrastructure companyMastercard 10-Q
- 29 Oct 2026Q3 2026 results: net revenue $9.8bn, up 14%; shares rise 4.2%Mastercard 8-K
- 30 Oct 2026Shares close at $638.01, a 52-week closing highYahoo Finance
- Jan 2027Q4 2026 results and 2027 outlookMastercard IR
What drove Mastercard's revenue growth in Q3 2026?
Mastercard reports two revenue lines. Payment network revenue comes from the fees it charges banks and merchants for using its network, less the rebates and incentives it pays to win and keep their business. Value-added services and solutions covers everything else: cyber and fraud tools, data and consulting, loyalty, open banking, and the processing and payment services it sells on top of the network.
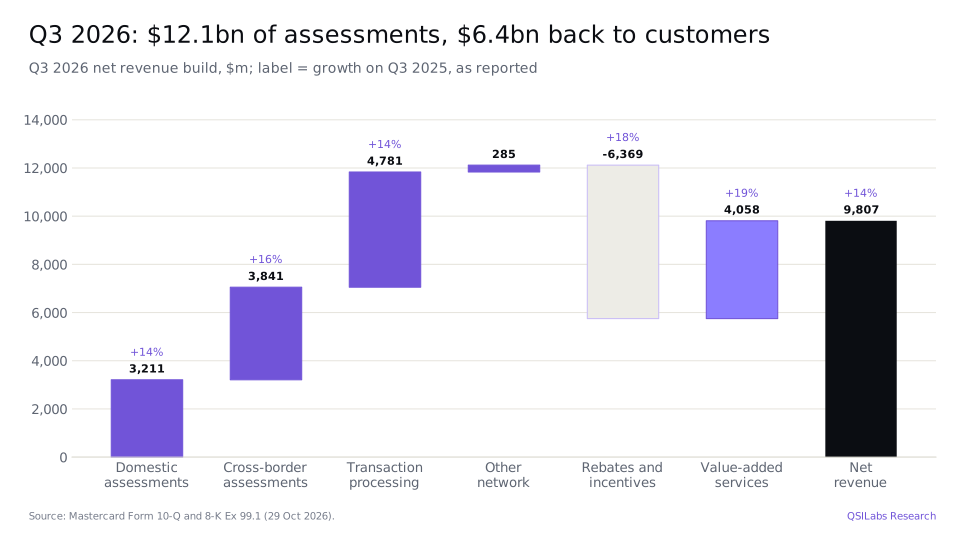
Within payment network revenue, Mastercard charges four kinds of assessments. Domestic assessments ($3.2bn, +14%) are charged on purchases where the card and the merchant are in the same country. Cross-border assessments ($3.8bn, +16%) apply where they are not, and earn the highest rates. Transaction processing assessments ($4.8bn, +14%) cover switching, authorisation and settlement, and other network assessments were $285m. Together they came to $12.1bn. From that Mastercard deducted rebates and incentives of $6.4bn, up 18%, to arrive at payment network revenue of $5.7bn.
Gross dollar volume, cross-border and switched transactions
The volume drivers stayed healthy. Worldwide gross dollar volume rose 7% in local currency to $2.95 trillion, and purchase volume rose 9%. In the US, gross dollar volume rose 6%: credit grew 10%, while debit grew only 1% because Capital One has been moving its debit cards onto its own network. Outside the US, gross dollar volume rose 8%. Cross-border volume rose 11%, with both travel and non-travel spending growing, and switched transactions rose 9%. Contactless payments made up 81% of in-person switched purchases.
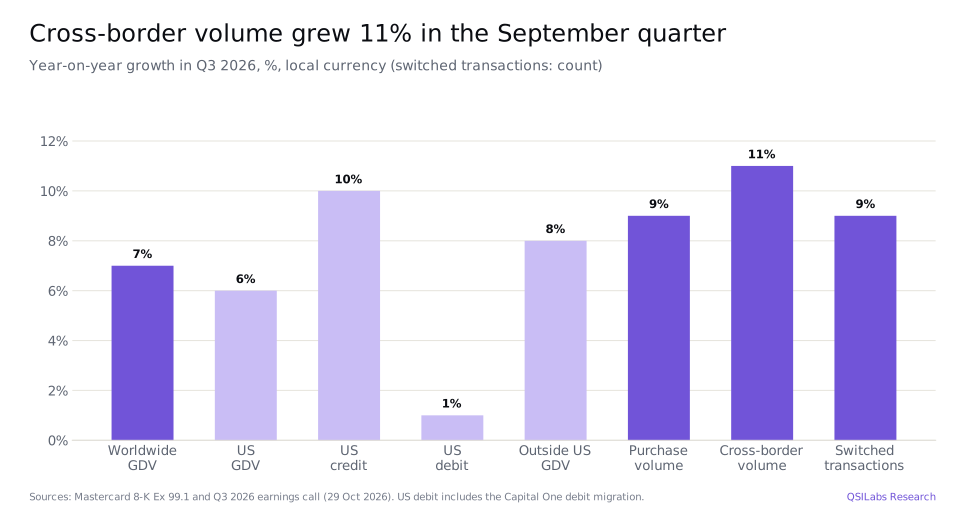
Chief financial officer Ling Hai, on a first earnings call in the role, flagged two soft spots. Cross-border volume within Europe, which earns less than other cross-border flows, fell from the previous quarter because of a new EU customs fee, the timing of promotions and lower crypto purchases. And conflict in the Middle East is still holding back travel volumes in that region. Neither changed the quarter's overall picture: cross-border assessments still grew faster than any other line.
Rebates and incentives: the price of winning deals
Rebates and incentives rose 18%, faster than gross assessments, and absorbed 52.6% of them, up from 51.0% a year earlier. Incentives are contractual and rise in steps when Mastercard wins or renews large bank and merchant deals, so a period of heavy deal-making shows up here first. The quarter had plenty: a consumer debit deal with Bank of China, a Hilton co-brand with Bank of Communications, renewals with Handelsbanken, Swedbank, DSGV and DZ Bank in Europe, a small-business deal with HDFC Bank in India, and a win in the US with Pinnacle Financial Partners, whose whole card portfolio moves to Mastercard from 2027.
Value-added services: now 41% of revenue
Value-added services and solutions grew 19% to $4.1bn in the quarter and 20% to $11.3bn over nine months. This is the faster-growing half of Mastercard and the main reason its revenue has grown faster than its card volumes. Because many of these services are sold alongside network transactions, they also make Mastercard harder for a bank to replace.
By region
Revenue in the Americas rose 15% to $4.2bn, and revenue in Asia Pacific, Europe, the Middle East and Africa rose 13% to $5.6bn, which is 57% of the total.
What is Mastercard doing with stablecoins and agentic commerce?
On 3 August 2026 Mastercard completed its acquisition of BVNK, a provider of stablecoin infrastructure, for $1.4bn in cash, with up to $300m more if performance targets are met. Almost all of the price, $1.3bn, was booked as goodwill. Mastercard has used BVNK to launch a Global Money Platform that lets banks and businesses hold and move both ordinary currency and stablecoins. At about 0.25% of Mastercard's market value, the deal does not move our valuation, but it shows how Mastercard intends to respond to the threat that stablecoins pose to card-based cross-border payments: by carrying them on its own rails.
The other theme of the call was agentic commerce, where AI agents shop and pay on a consumer's behalf. Mastercard's Agent Pay embeds card tokens in agent-initiated payments and verifies that the agent is authorised by the buyer. It has added Agentic Trust Intelligence, to help banks and merchants assess transactions started by AI agents, and announced a partnership with OpenAI covering payments, services and AI. None of this produces meaningful revenue yet. Its importance is defensive: if agents become a large share of online shopping, the networks that agents trust by default will keep their share of volume.
How much cash did Mastercard return to shareholders?
Mastercard generated $11.9bn of operating cash flow in the first nine months of 2026 and spent $1.1bn on property, equipment and capitalised software, leaving free cash flow of $10.7bn. That is below the pace of 2025, when free cash flow was $16.4bn for the year, mainly because prepaid expenses, which at Mastercard are largely incentives paid to customers up front, absorbed $4.7bn of cash in the nine months, against $2.9bn a year earlier. Prepayments of this kind usually accompany large new or renewed deals and are earned back over the contract.
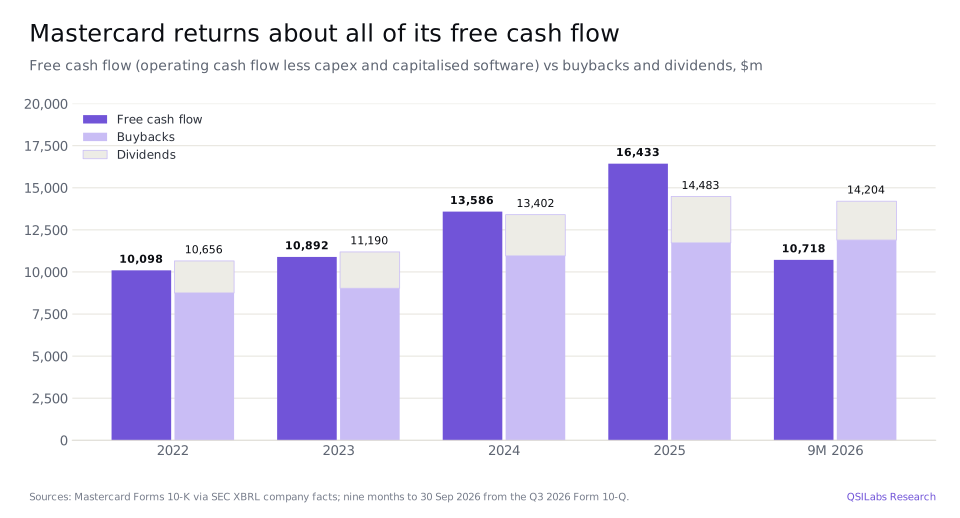
It returned $14.2bn over the nine months: $11.9bn of buybacks, covering 22.9 million shares at an average of $520.64, and $2.3bn of dividends. In the third quarter alone it bought back 5.3 million shares for $3.0bn and paid $763m of dividends, and between 1 and 26 October it bought another $0.6bn. That left $4.9bn of buyback authorisation.
Returning more cash than it generates is possible because Mastercard borrowed. Total debt rose to $23.9bn at 30 September 2026 from $19.0bn at the end of 2025, after $5.6bn of new debt in the nine months. Cash, cash equivalents and investments were $10.5bn. With net debt of about $13bn against operating income of $16.4bn in the first nine months alone, the balance sheet has plenty of room. Stockholders' equity is only $6.8bn because Mastercard holds $95.2bn of repurchased shares as treasury stock.
What does litigation cost Mastercard?
Litigation is Mastercard's largest recurring non-operating cost. Provisions were $156m in the first nine months of 2026, including $74m in the third quarter for settlements with US merchants who opted out of the interchange class actions. More claims are pending: a new putative class action was filed in September 2026 on behalf of US merchants outside the damages class, and Mastercard still faces merchant claims in the UK and Europe and consumer collective actions in Portugal and the Netherlands. These cases rarely threaten the business, but they recur, which is why we model them as a normal cost.
What is Mastercard's outlook for 2026 and 2027?
Mastercard expects 2026 net revenue to grow at the high end of the low double digits, currency-neutral and excluding acquisitions, the same outlook it gave after the second quarter, with about 1 point of help from currency. It expects the same growth rate for the fourth quarter, with currency now a headwind of about 1 point because of the stronger dollar. Operating expenses should grow at the high end of the low double digits in the fourth quarter, with about 1 point from acquisitions, and the non-GAAP tax rate should be 20% to 21%. Mastercard has not yet given a 2027 outlook; it usually does so with fourth-quarter results in late January.
The market liked the results. The shares rose 4.2% on 29 October to $635.70 and closed at $638.01 on 30 October, their highest close in a year. The consensus compiled by S&P Global Market Intelligence and published by StockAnalysis expects 2026 revenue of $37.35bn (+13.9%) and 2027 revenue of $42.05bn (+12.6%), with EPS of $20.04 and $23.13. The 40 analysts in the survey rate the stock a strong buy on average, with an average price target of $706.04 and a range from $550 to $800.
What is Mastercard stock worth? MA valuation after Q3 2026
Method
We value Mastercard with a ten-year discounted cash flow model. We forecast net revenue, a GAAP operating margin, tax at 20%, depreciation, capex and working capital, and discount the resulting unlevered free cash flow at a weighted average cost of capital of 8.09%. That rate is Aswath Damodaran's January 2026 figure for US information services companies, with a beta of 0.92, a cost of equity of 9.23% and debt at about 25% of capital. A terminal value assumes 2.5% growth after 2035. We add cash and investments of $10.5bn and $0.8bn of net cash earned in October 2026 before the valuation date, subtract debt and accrued litigation of $24.2bn, and divide by 872.2 million diluted Class A and Class B shares.
Our forecast
Our base case starts from the consensus. Net revenue of $37.35bn in 2026 assumes fourth-quarter revenue of about $9.9bn, up 12%, in line with Mastercard's guidance. Revenue then grows 12.6% in 2027 to $42.1bn, matching the consensus, and growth slows by about a point a year to 4% by 2035, as card penetration matures and payments growth moves toward nominal GDP. That takes net revenue to $74.9bn in 2035.
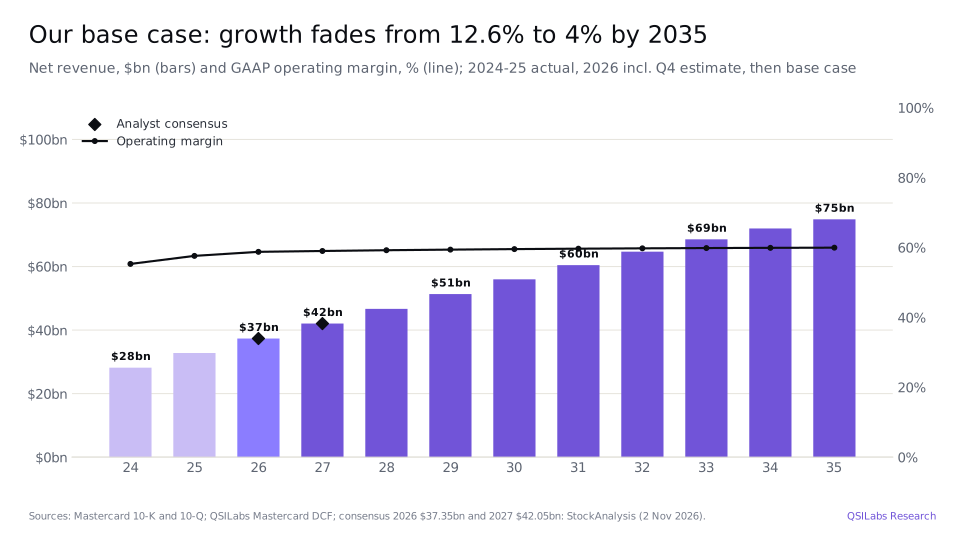
We let the GAAP operating margin rise slowly from 58.8% in 2026 to 60% by 2035. That is a little below Mastercard's adjusted margin of 60.8% for the first nine months, because we treat litigation provisions and restructuring charges as a recurring cost: Mastercard has reported litigation provisions in most recent years. Working capital stays a small source of cash each year, as it has been historically.
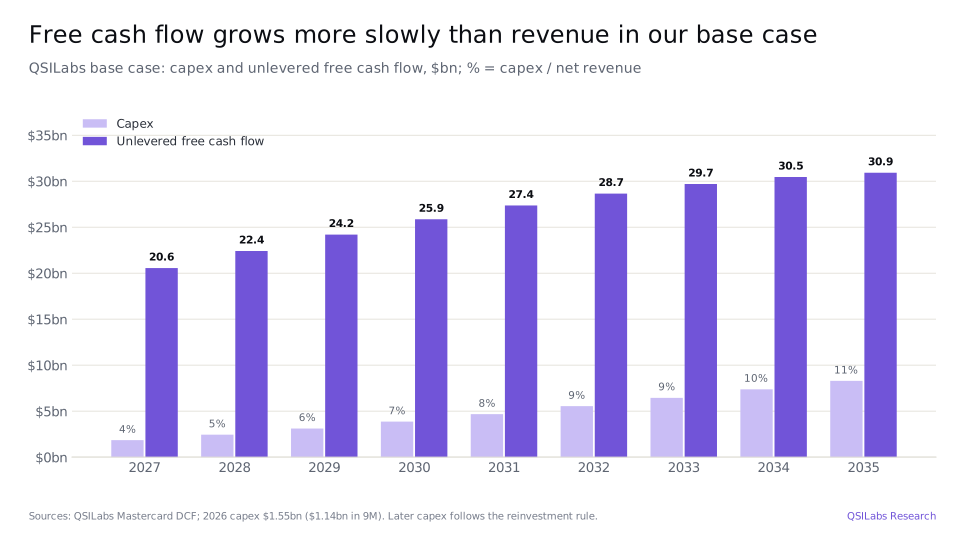
The model ties reinvestment to growth at a 15% return on new capital, so capex rises from 4.4% of net revenue in 2027 to 11.1% by 2035. That is deliberately conservative for a network that has spent about 4% of revenue on capex and capitalised software, and it is the single biggest reason our value sits below the price. It mostly affects the later years: our 2027 unlevered free cash flow of $20.6bn is still well above the $16.4bn of free cash flow Mastercard generated in 2025.
Football field
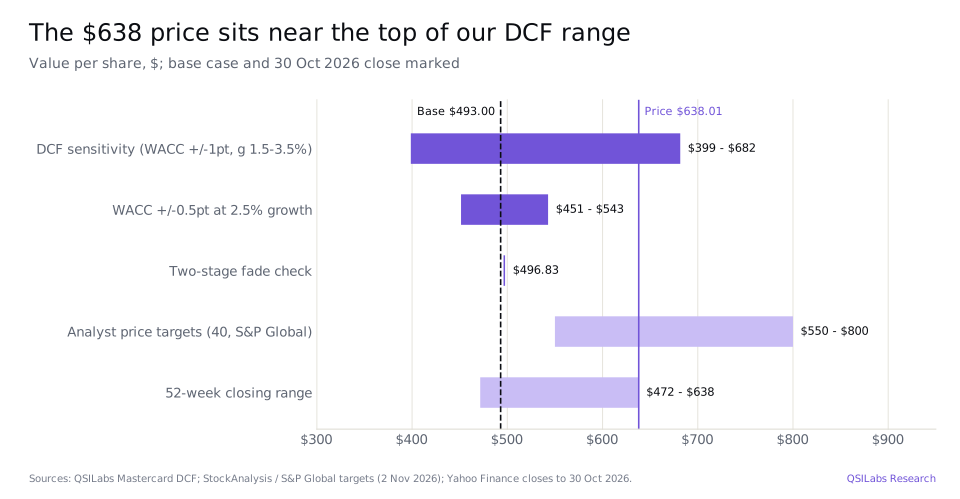
Our base case gives an enterprise value of $442.9bn and an equity value of $430.0bn, or $493.00 per share. The terminal value is 62% of enterprise value and implies 11.8 times terminal-year EBITDA. A two-stage fade check, which moves growth to the terminal rate more gradually, gives $496.83. The analysts' targets start at $550, above our base case, which tells you the market values Mastercard as a long-duration growth business rather than as the maturing compounder in our model.
Sensitivity
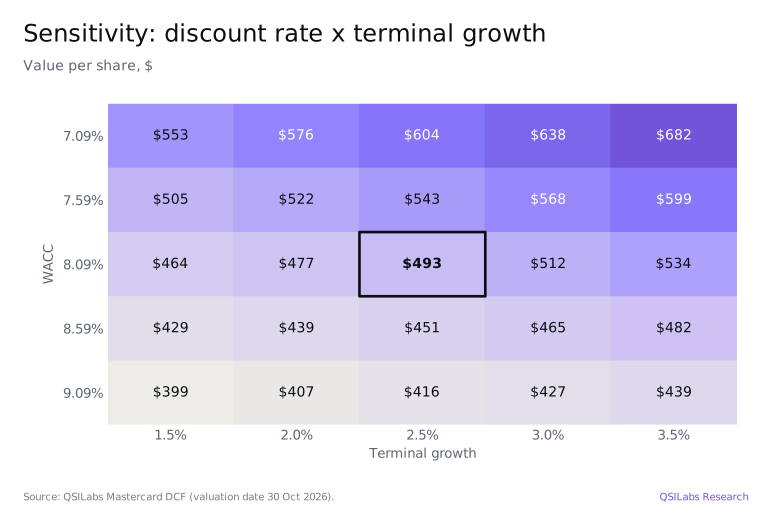
The discount rate matters more than terminal growth. A half-point lower discount rate lifts the value to $543; a half-point higher cuts it to $451. Only the corner of the grid with a 7.09% discount rate and terminal growth of 3% or more reaches the share price: $638 at 3% and $682 at 3.5%.
Is Mastercard stock overvalued after Q3 2026?
On our numbers the shares are expensive: they trade about 29% above our base-case value. The market's view is not unreasonable, though, and it helps to set out what it implies. At $638.01, Mastercard's market value is about $556bn on 872 million diluted shares. That is 31.8 times the 2026 consensus EPS of $20.04, 27.6 times the 2027 consensus of $23.13 and a free cash flow yield of about 3% on 2025 free cash flow.
For the price to be right on a cash flow basis, at least one of three things has to be true. Mastercard has to keep growing at more than 10% a year well into the 2030s, or keep reinvesting only about 4% of revenue while it does, or investors have to accept a return closer to 7% than 8%. All three are plausible for a global duopoly with a fast-growing services business. Our base case simply assumes none of them fully holds.
That makes Mastercard a stock where the case rests on how long services growth and the shift from cash to cards can last, not on the next quarter. The third quarter said the business is doing everything it can control well. The risk is that the market's assumptions about how long that lasts are too generous.
What are the biggest risks for Mastercard stock?
- Regulation and litigation: US merchant class actions, proposed rules on card routing and swipe fees, and interchange claims in the UK and Europe could cap the fees Mastercard and its bank customers earn.
- Real-time payments and stablecoins: account-to-account systems such as FedNow, Pix in Brazil and UPI in India offer a cheaper alternative to cards for some payments, and stablecoins could do the same for cross-border flows.
- Rebates and incentives: large issuers and merchants have strong bargaining power; incentives grew 18% in the latest quarter, faster than gross assessments, and issuers with their own networks can move volume away, as Capital One has done with debit.
- Cross-border travel: cross-border assessments are the highest-yielding revenue line and depend on travel, currency volatility and online spending across borders, all of which are cyclical and exposed to conflicts such as the one in the Middle East.
- Consumer spending: gross dollar volume follows nominal consumer spending, so a recession would slow Mastercard's growth even if it would not threaten its profitability.
- Valuation: at about 27.6 times 2027 consensus earnings, the shares already price in a long run of double-digit growth.
Mastercard stock FAQ
What is Mastercard stock worth after Q3 2026?
Our discounted cash flow value for Mastercard is $493.00 per share as of its Q3 2026 results, about 23% below the $638.01 close on 30 October 2026. It assumes net revenue growth of 12.6% in 2027 fading to 4% by 2035, a GAAP operating margin rising from 59% to 60% and an 8.09% discount rate. Analysts' price targets average $706.04.
Is Mastercard stock a buy after its Q3 2026 earnings?
This is not investment advice. On our model the shares look expensive: only our most generous sensitivity cases, with a 7.09% discount rate and terminal growth of 3% or more, reach the share price. Investors who expect Mastercard to keep growing at double digits for much longer, while spending little on capex, will see more value than we do.
What were Mastercard's Q3 2026 results?
For the quarter ended 30 September 2026, Mastercard reported net revenue of $9.8bn, up 14%, net income of $4.6bn or $5.28 per diluted share and adjusted net income of $4.7bn or $5.31 per share. Gross dollar volume rose 7% and cross-border volume 11%, both in local currency.
How fast are Mastercard's value-added services growing?
Value-added services and solutions revenue grew 19% to $4,058m in Q3 2026 and 20% to $11,334m in the first nine months, against 11% growth in payment network revenue. Services now make up about 41% of net revenue.
What is Mastercard's guidance for 2026?
Mastercard expects 2026 and fourth-quarter net revenue growth at the high end of the low double digits, currency-neutral and excluding acquisitions, with a non-GAAP tax rate of 20% to 21%. It expects to give its 2027 outlook with fourth-quarter results in January 2027. Analysts expect 2027 revenue of $42.05bn and EPS of $23.13.
Why did Mastercard buy BVNK?
Mastercard bought BVNK, a stablecoin infrastructure company, for $1.4bn in cash plus up to $300m of contingent payments, completing the deal on 3 August 2026. It uses BVNK to run its new Global Money Platform, which lets institutions manage both ordinary currency and stablecoin accounts.
How much does Mastercard return to shareholders?
In the first nine months of 2026 Mastercard bought back $11.9bn of stock and paid $2.3bn of dividends, a total of $14.2bn against free cash flow of $10.7bn. It had $4.9bn of buyback authorisation left on 26 October 2026.
What are rebates and incentives at Mastercard?
Rebates and incentives are payments and discounts Mastercard gives banks, merchants and partners to issue its cards and route payments over its network. They are deducted from gross assessments and were $6.4bn in Q3 2026, or 52.6% of gross assessments, up 18% from a year earlier.
Sources
- Mastercard Incorporated, third-quarter 2026 financial results (Form 8-K, Exhibit 99.1, 29 Oct 2026; accession 0001141391-26-000122) www.sec.gov
- Mastercard Incorporated, Form 8-K cover filing (29 Oct 2026; accession 0001141391-26-000122) www.sec.gov
- Mastercard Incorporated, Form 10-Q for the quarter ended 30 September 2026 (filed 29 Oct 2026; accession 0001141391-26-000124) www.sec.gov
- Mastercard Incorporated, Form 10-K for the year ended 31 December 2025 (filed 11 Feb 2026; accession 0001141391-26-000013) www.sec.gov
- SEC XBRL company facts, Mastercard Incorporated (CIK 0001141391) data.sec.gov
- SEC EDGAR, Mastercard Incorporated filings www.sec.gov
- The Motley Fool, Mastercard (MA) Q3 2026 earnings call transcript (29 Oct 2026) www.fool.com
- StockAnalysis, Mastercard (MA) analyst forecasts, S&P Global data (captured 2 Nov 2026) stockanalysis.com
- Yahoo Finance chart data: MA daily closes (to 30 Oct 2026) query1.finance.yahoo.com
- Aswath Damodaran, cost of capital by industry (NYU Stern, January 2026 update) pages.stern.nyu.edu
- QSILabs Mastercard discounted cash flow model (internal, valuation date 30 Oct 2026)
Disclaimer
This article is for information only and is not investment advice or a recommendation to buy or sell any security. The value per share is a QSILabs estimate based on public information and our own assumptions, which may be wrong. QSI Labs may hold positions in the securities discussed. Figures are as of the dates stated and will change.
More from QSI Labs
Read our white paper, QSI Labs: An AI-Native Trading Firm Built on a Training Loop (October 2026), available on request, or browse the research index.