Research / IPO analysis

Anthropic IPO: The good, the badand the end of the world
In short: The Anthropic IPO asks investors to back a company that made its first GAAP operating profit, $974m, in Q2 2026, on $16.29bn of first-half revenue, while signing up to about $853bn of compute obligations. Our fair value is $67.85 a share, or $980.7bn of equity.
Key takeaways
- Fair value. $67.85 a share, post-split and fully diluted, or $980.7bn of equity, from our DCF as of 21 October 2026. Bull case: $112.78.
- Listing. Anthropic filed its S-1 on 26 October 2026 to list on Nasdaq as "ANT". The price range is still blank.
- Revenue. $16.29bn in the first half of 2026, of which $11.56bn came in Q2 alone.
- Profit. Q2 2026 was the first GAAP operating profit, +$974m, an 8% margin.
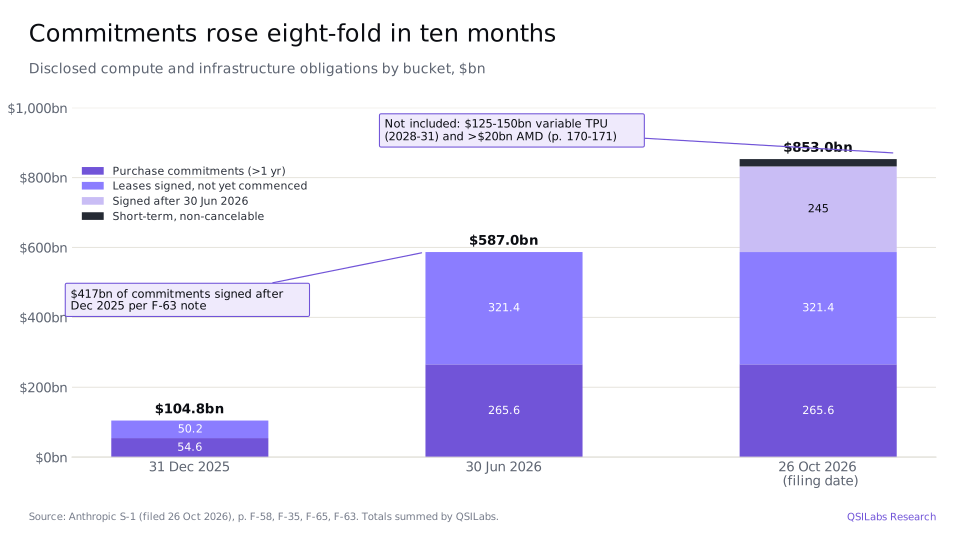
- Compute. Anthropic has signed up to about $853bn of compute obligations.
Figures as of 21 October 2026. Published 30 October 2026, updated 2 November 2026, by QSI Labs Research.
A few days ago, Anthropic filed for an IPO, with reports suggesting a potential valuation of $2 trillion. Buried in its prospectus were two rather extraordinary warnings for anyone hoping to profit from the company:
- The technology we're building could pose an existential threat to humanity.
- We might never actually make a profit.
In this article, we assess mostly the latter and leave the first point to the reader's judgement before investing.
Now, if you are too lazy to read, here's the Executive Summary:
Executive summary
- Hypergrowth, now with a profit line. Revenue went from $41m in 2023 to $4.59bn in 2025 and $16.29bn in the first half of 2026, up 1,300% year on year (S-1 p. 22, p. 62). Q2 2026 revenue alone was $11.56bn, up 1,368% on Q2 2025, while compute spend rose 300% (p. 10, p. 157).
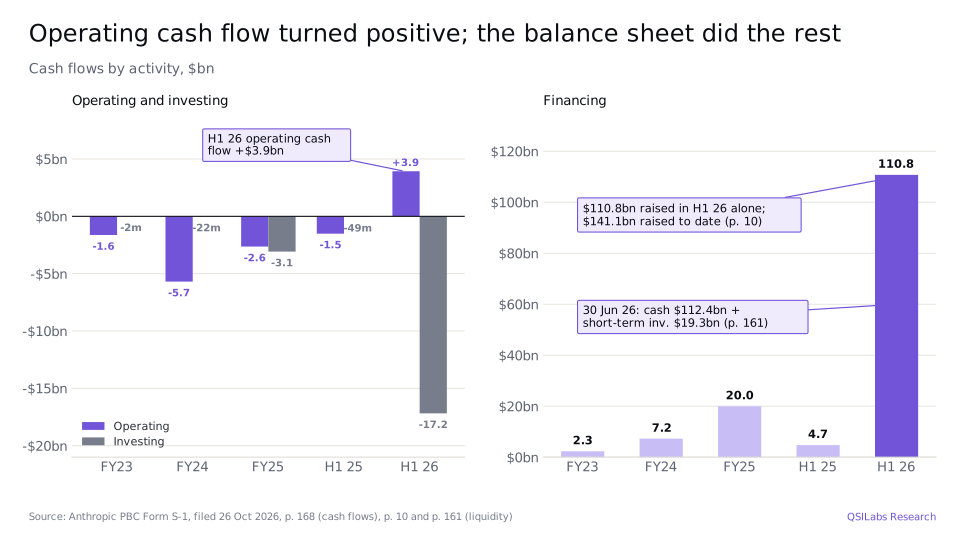
- The first operating profit. Q2 2026 brought the first GAAP operating profit, +$974m or an 8% margin, and a 19% adjusted operating margin (p. 157, p. 196). Over H1 2026, adjusted net income was +$2.67bn and operating cash flow +$3.93bn (p. 24, p. 168).
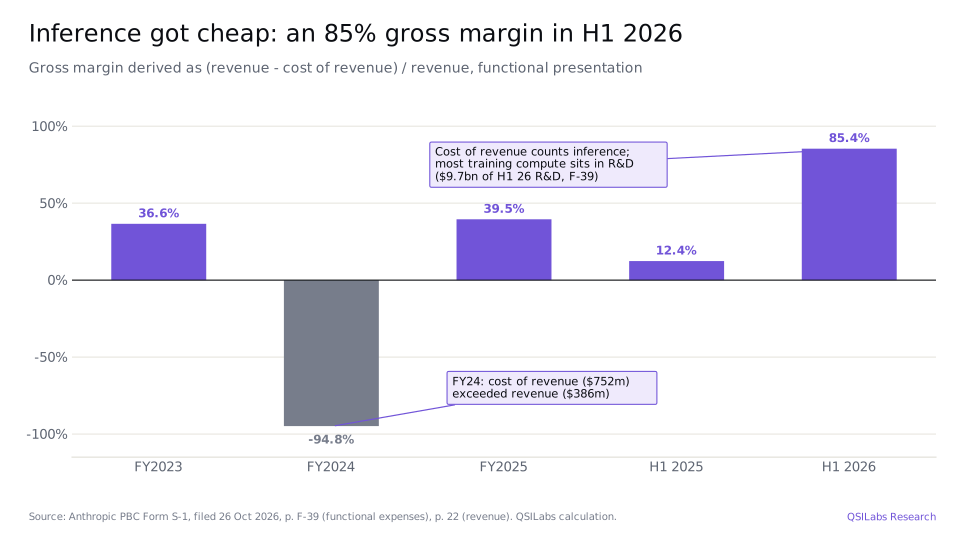
- Inference has become a high-margin business. On the functional cost-of-revenue line, the derived gross margin was ~85% in H1 2026, against 39.5% in FY2025 (F-39; our calculation). Most training compute is booked in R&D, not cost of revenue.
- An $853bn compute bet. By the filing date, disclosed compute and infrastructure obligations came to ~$853bn, up from $104.8bn at 31 December 2025 (F-35, F-58, F-65). That excludes a further $125–150bn of variable TPU capacity and more than $20bn of AMD systems (p. 170–171). Before IPO proceeds, liquidity plus contracted financing comes to ~$239bn.
- The headline loss is mostly a valuation mark. About 90% of the $80.7bn H1 2026 net loss, $72.4bn, is a non-cash fair-value remeasurement of convertible notes (p. 22, p. 157).
- Control stays with the founders and a trust. Anthropic is a Delaware public benefit corporation (PBC) and a "controlled company". A single Class F share holds 50.1% of the votes. The Long-Term Benefit Trust's Class T stock elects a majority of the board (p. 14–15).
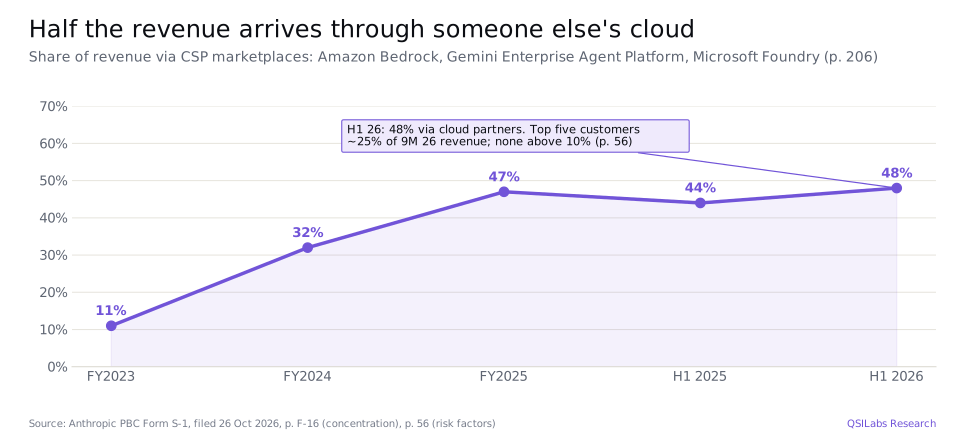
- Peers, partners and competitors at once. 48% of revenue comes through cloud marketplaces run by Amazon, Google and Microsoft (F-16). Those same companies are its main compute suppliers, and two of them are large shareholders.
- The least vertically integrated of the four. Google owns the stack from TPUs to Search. SpaceX's Super Intelligence (SI) segment owns its data centres and power and sells compute to Anthropic. OpenAI is building its stack through partners. Anthropic is an asset-light model lab with asset-heavy commitments.
- Our fair value is $67.85 a share. That implies $980.7bn of equity, 1.15x the Series H price of $58.90 per common share. We model revenue on Google's growth path from a comparable size. The S-1 leaves the price range, share count and Q3 revenue blank (p. 18–19, p. 63).
The filing at a glance
Anthropic PBC filed its Form S-1 with the SEC on 26 October 2026 (accession 0001628280-26-067168). The plan is to list Class A shares on the Nasdaq Global Select Market under the ticker "ANT". Goldman Sachs and Morgan Stanley are leading a 22-bank syndicate, which is a lot of people hoping to get paid (cover, p. 316). The document runs to 421 pages, audited financials included. Ernst & Young has been the auditor since 2025 (F-3).
The terms are not set yet. Price range, shares offered, proceeds, September-quarter revenue, even the total in the contractual-obligations table: all blank (p. 6, p. 18–19, p. 63, p. 124, p. 170). That is normal for a first filing. The numbers usually show up in an amendment, right before the roadshow, which is also right before they ask you for the money.
| Item | Detail | S-1 page |
|---|---|---|
| Issuer | Anthropic PBC, Delaware public benefit corporation, founded January 2021 | p. 5 |
| Exchange / ticker | Nasdaq Global Select Market, "ANT" | cover |
| Lead banks | Goldman Sachs, Morgan Stanley (22 underwriters) | cover, p. 316 |
| Price range, shares, proceeds | Not yet disclosed | p. 18–19, p. 124 |
| Stock split | 10-for-1, effective 17 September 2026 | p. 21, F-65 |
| Use of proceeds | General corporate purposes, compute and infrastructure, hiring, possible acquisitions, RSU tax withholding | p. 124 |
| Dividends | None planned | p. 125 |
| Lock-up | 180 days for most holders, with staged early releases; 365 days for co-founders and certain holders | p. 307–308 |
- Jan 2021Founded as a Delaware PBCp. 5
- Q1 2023First revenue as Claude launchesp. 5
- Sep 2025$1.5bn Bartz copyright settlementp. 92
- Nov 2025Microsoft compute deal, $44.9bn+p. 170
- Feb 2026Series G at $380bn; supply-chain-risk designation (27 Feb)CNBC; p. 71
- Mar-Apr 2026Google ($114.5bn) and Amazon ($110bn) commitments; Mythos Previewp. 170-171, 199
- 28 May 2026Series H: $65bn at $965bn post-moneyAnthropic, GIC
- Q2 2026First GAAP operating profit, +$974mp. 157
- Sep 202610-for-1 split; 5.1 models; $15bn revolverp. 21, 199, F-64
- 26 Oct 2026S-1 filed; Nasdaq: ANTcover
What does Anthropic sell?
Anthropic trains the Claude family and sells it three ways: a metered API, subscription apps, and enterprise deals. The menu is Mythos (including Fable), Opus, Sonnet and Haiku. It reads a bit like a wine list. The bill does not.
- Mythos Preview launched in April 2026 through Project Glasswing.
- Fable 5 and Mythos 5 followed in June 2026, and the 5.1 versions in September 2026 (p. 199).
- Opus 5.5 cut cost per task by about 40% (p. 10).
The product surface has grown fast:
- Claude Code and Cowork. Agentic coding and knowledge work. Claude.ai is merging into Cowork from September 2026.
- Claude for Security, Design, Science and Enterprise, plus Tag.
- The developer platform. The Model Context Protocol (MCP), Agent Skills, Managed Agents, and a Model Hardware Standard that lets agents operate lab and manufacturing equipment (p. 200–202).
They shipped about 250 launches in the first nine months of 2026 (p. 142). They also say Claude now writes more than 90% of Anthropic's own code (p. 136), which is either very good engineering or a restaurant that mostly eats its own cooking. Headcount went from about 940 at the end of 2024 to about 5,300 by 30 September 2026 (p. 63). Revenue per employee still rose, to more than $6.6m over the last twelve months, from $1.4m a year earlier (p. 10).
Revenue: the fastest ramp in the public record
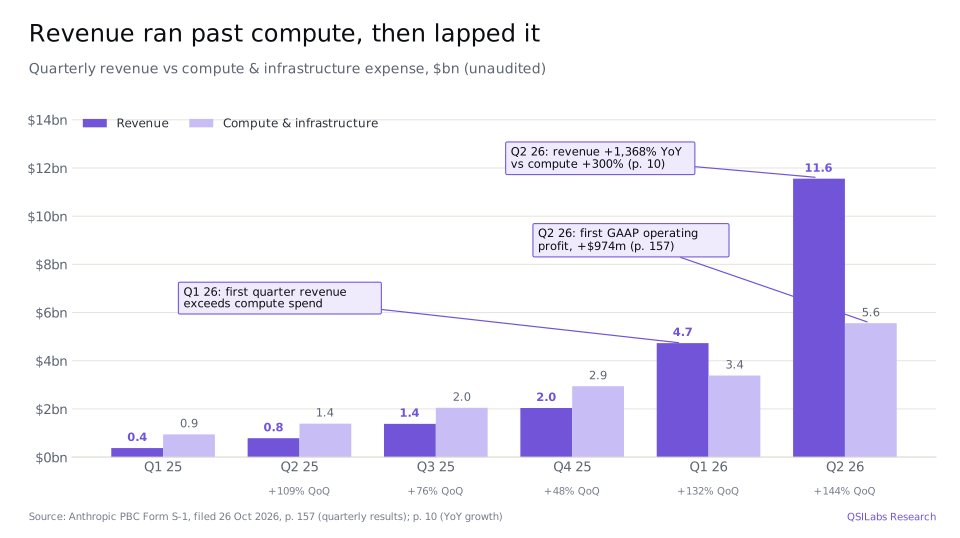
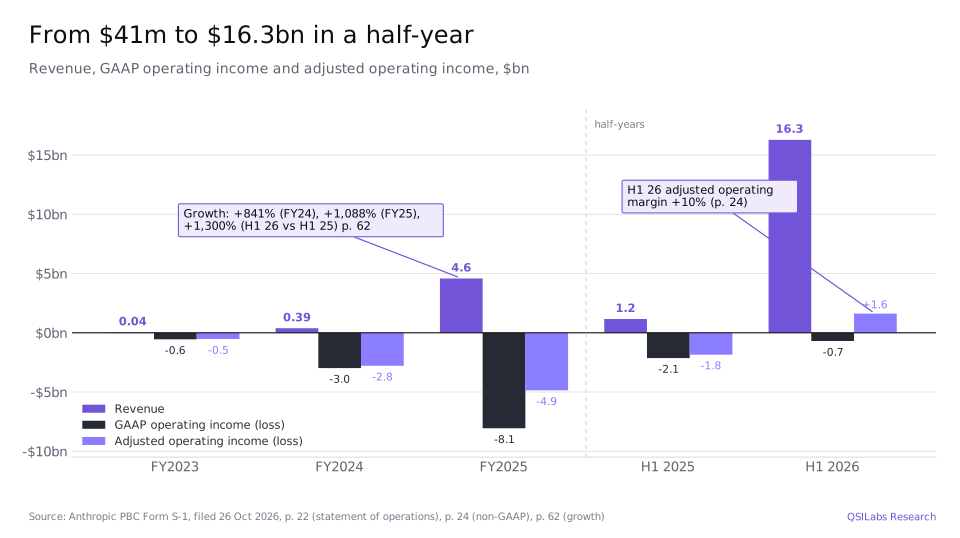
Three things explain a curve that looks like it was drawn by someone who had too much coffee:
- Consumption pricing. Usage-based revenue (API, platform, enterprise consumption) was $13.06bn of the $16.29bn in H1 2026, or 80%. Subscriptions made up the other $3.22bn (F-26, p. 138). Revenue therefore scales directly with tokens used, and agents use a lot of tokens.
- Land and expand. Net revenue retention was about 900% (p. 10). Customers paying $100k or more a year rose from about 20 at the end of 2023 to more than 11,900 by September 2026 (p. 142). More than 1,900 customers now pay $1m+ and about 250 pay $10m+ (p. 181).
- Enterprise breadth. Every Fortune 10 company, more than half of the Fortune 500 and more than 30% of the Global 2000 are customers (p. 193–194). The S-1 also counts about 40 million smaller customers paying under $100k (p. 142).
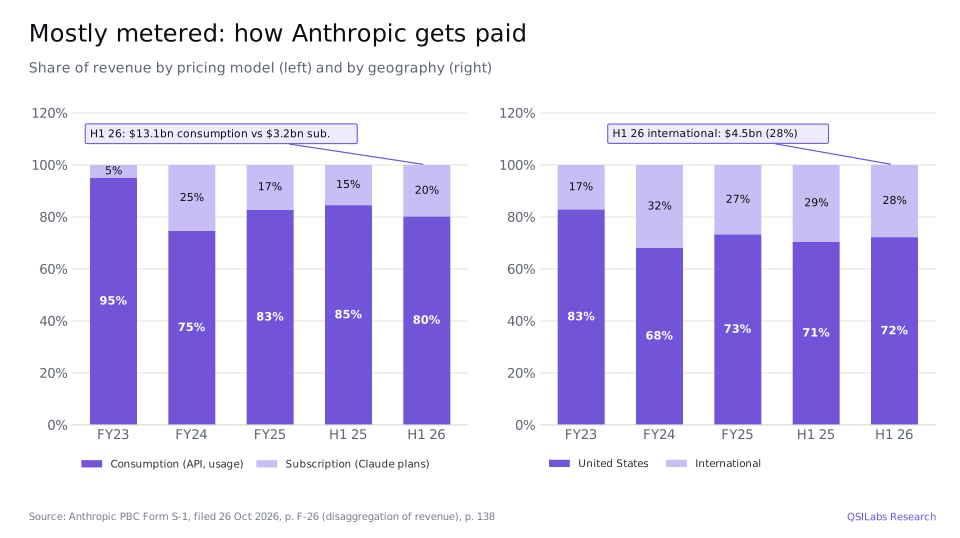
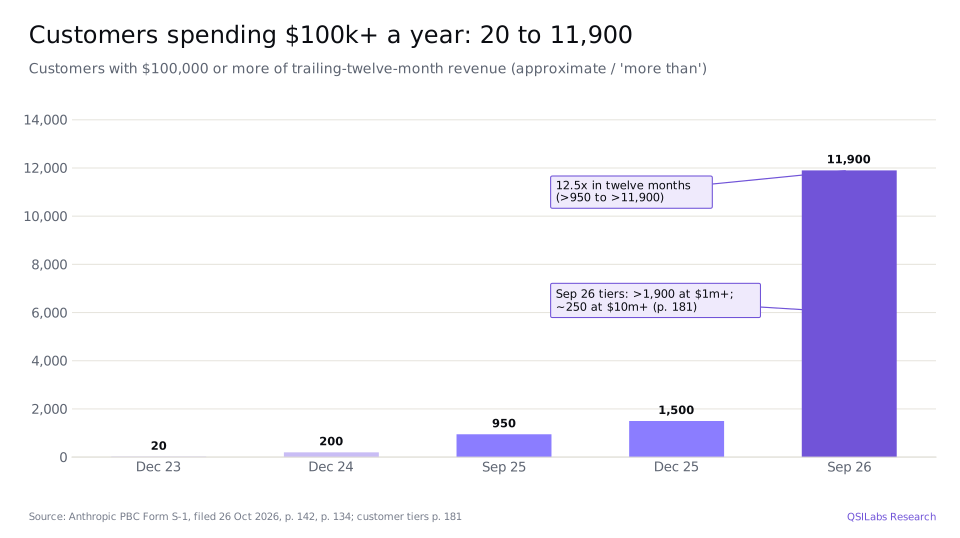
No single customer is the whole business. The pipes the revenue runs through are another story:
- Customers. The top five accounted for about 25% of nine-month 2026 revenue, and no single customer exceeded 10% (p. 56). In Q3, 79% of revenue came from outside the top five, against 64% in Q1 (p. 143).
- Channels. Cloud-marketplace resale rose from 11% of revenue in 2023 to 48% in H1 2026 (F-16).
- Usage-policy violators. The company also estimates that 5–7% of nine-month revenue came from customers later found to have violated its usage policies (p. 145). Our valuation includes this as a sensitivity.
What about Q3? The S-1 leaves revenue for the quarter ended 30 September 2026 blank (p. 63). CNBC, citing the FT and WSJ, reported about $16.8bn on 15 October 2026. Nice number. Our model uses it as an estimate until an amended S-1 says it out loud.
Deferred revenue was $1.65bn at 30 June 2026. Remaining performance obligations were $10.8bn, about 75% of it due within twelve months (F-26).
Unit economics: from cash furnace to operating leverage
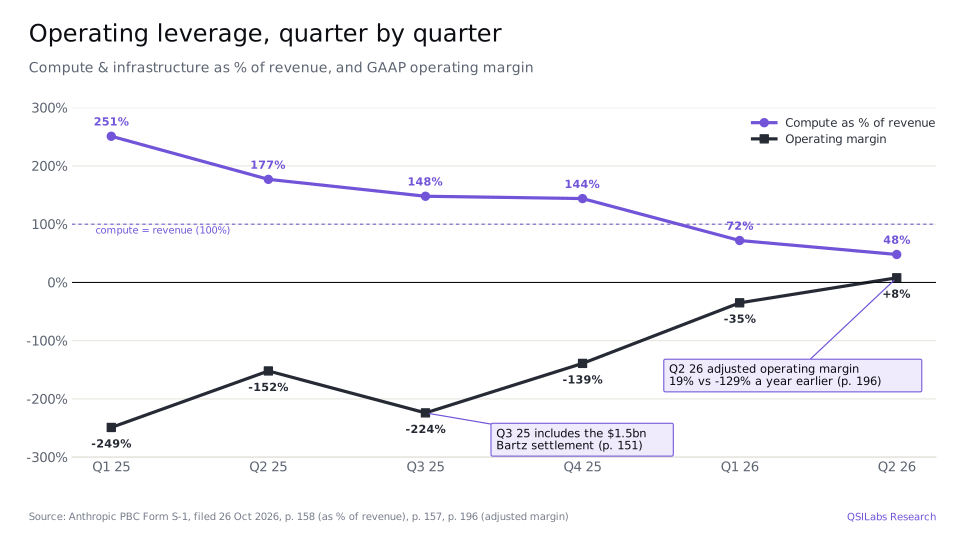
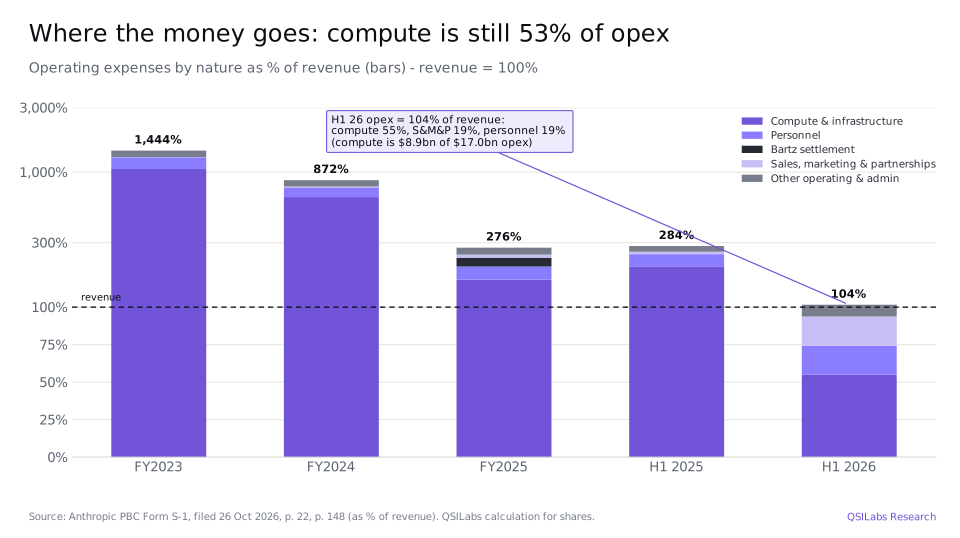
The S-1 shows expenses two ways, and they tell different stories. By nature: compute, people, sales and marketing, and other. By function, in the notes: cost of revenue, R&D, sales, and overhead (F-39). Pick the view that flatters you and you can tell almost any story. Here are both:
- By nature, compute is still the business. H1 2026 compute was $8.95bn, or 53% of the $16.98bn in operating expenses and 55% of revenue (p. 22, p. 148).
- By function, inference is cheap. Cost of revenue was only $2.38bn against $16.29bn of revenue, a derived gross margin of about 85%. R&D, which carries most training compute, was $9.74bn (F-39).
Stock-based pay is rising, and it is still small next to revenue: $2.19bn in H1 2026 (p. 24), $1.3bn of that in Q2 alone (p. 157). The hangover comes later. There is $26.6bn of RSU cost not yet on the books, and about $23.7bn of it lands after the IPO, over roughly 2.1 years (p. 64, p. 173). Employee donation matching cost $541m in 2025, about 4% of operating expenses (p. 144), and $2.0bn in Q3 2026 (F-65). Generous. Also expensive.
Cash flow, the balance sheet and the $80bn "loss"
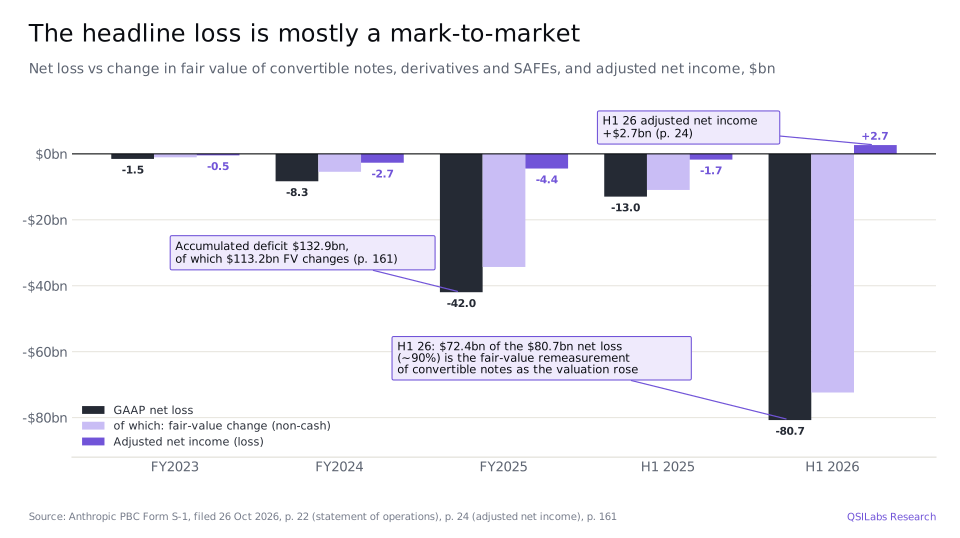
If you saw a headline that said Anthropic lost $80 billion, here is the trick. Most of the recent money came in as convertible notes, chiefly from Amazon and Google, and those notes are marked to fair value. Every time the company's valuation went up, the notes went up with it, and that increase hits the income statement as a loss: $34.3bn in 2025 and $72.4bn in the first half of 2026 (p. 22). Of the $132.9bn accumulated deficit at 30 June 2026, $113.2bn is just that mark-to-market (p. 161). Q2 also includes $8.45bn of other expense (p. 157). The notes convert at the IPO and the accounting loss goes away. The headline was real. The cash leaving the building was not.
| Balance sheet, 30 June 2026 | $bn | S-1 page |
|---|---|---|
| Cash and cash equivalents | 112.4 | p. 161, F-5 |
| Short-term investments | 19.3 | p. 161 |
| Total assets | 147.4 | p. 24 |
| Convertible notes payable (fair value) | 108.6 | F-5 |
| Total liabilities | 117.5 | p. 24 |
| Redeemable convertible preferred stock (liquidation preference $136.3bn) | 157.5 | p. 24, F-6 |
| Accumulated deficit | (132.9) | p. 24 |
| Total stockholders' deficit | (127.6) | p. 24 |
| Capital raised to date | 141.1 | p. 10 |
The compute bet: $853bn of obligations
This is the part of the prospectus that should make you sit up. To serve demand and train the next models, Anthropic has promised to buy compute from basically everyone with a plug:
- Clouds: Google, Amazon, Microsoft
- GPU neoclouds: SpaceXAI, Nscale, Lambda
- TPU leases: Broadcom
- Hardware: AMD
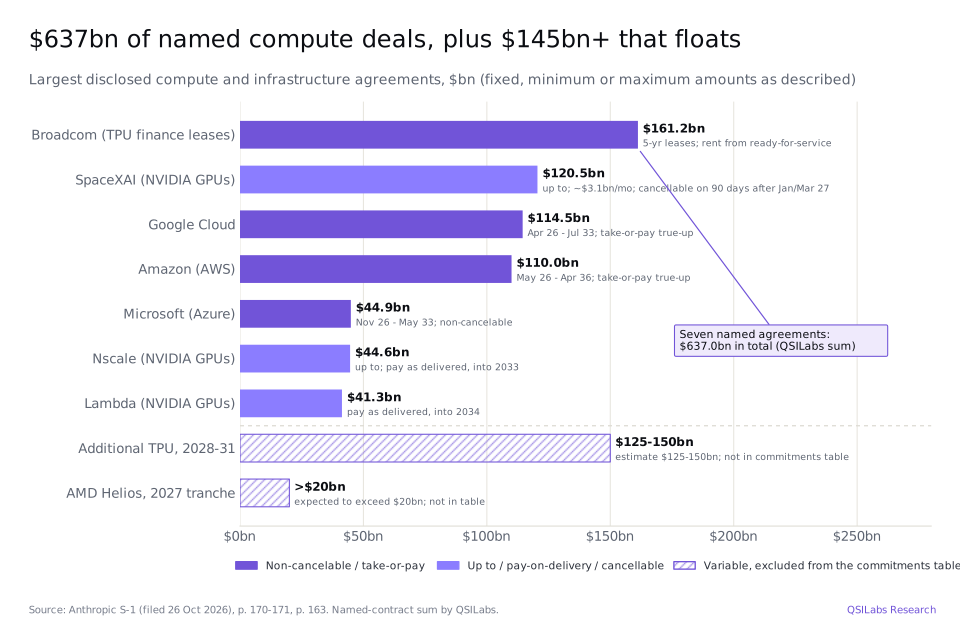
The totals are the scary part. The terms are how you find out whether they can walk away:
- Take-or-pay. The Google ($114.5bn, April 2026–July 2033) and Amazon ($110.0bn, May 2026–April 2036) commitments are take-or-pay with true-ups, and non-cancelable except for the counterparty's breach (p. 170–171).
- Microsoft. At least $44.9bn between November 2026 and May 2033 (p. 170).
- Broadcom. Five-year master equipment leases for TPU hardware with rent of about $161.2bn, accounted for as finance leases (p. 171).
- The flexible end. SpaceXAI: up to $120.5bn, about $3.1bn a month once fully delivered in December 2026, cancellable on 90 days' notice after the initial periods end in January and March 2027. Nscale: up to $44.6bn. Lambda: $41.3bn. Both of the latter pay only as capacity is delivered (p. 171).
- Off the table. Additional TPU compute for 2028–31 is estimated at $125–150bn. AMD's MI450 Helios tranche is expected to exceed $20bn. Neither is in the contractual-obligations table (p. 170–171).
Anthropic Direct. They have started splitting the bill for the buildings from the bill for the chips inside them. They call this "Anthropic Direct", and they expect it to be a growing share of what they spend on compute (p. 137, p. 141). They also say they intend to "expand our own data center footprint" (p. 11) and are out looking for their own data-centre infrastructure (p. 74). On power, they have promised to cover the electricity-price increases their data centres cause for everyone else, and to buy new generation to match what they use (p. 34, p. 36). They do not say they own any generation. Yet.
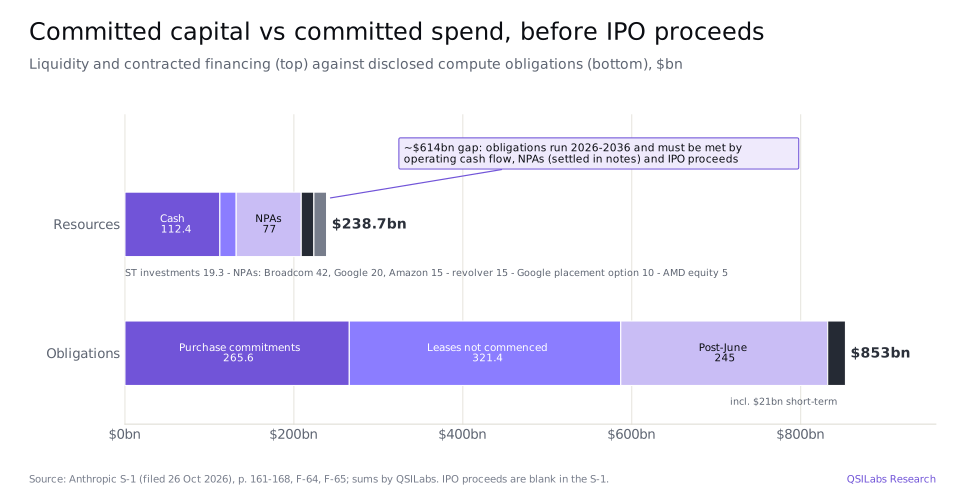
How it is financed. A large part of this bill is paid in paper, not cash. The suppliers take notes. The customer takes the compute:
- Undrawn note purchase agreements (NPAs). Google $20bn, Amazon $15bn and Broadcom $42bn, for a total of $77bn. The Broadcom notes carry 9% PIK interest and convert at 90% of VWAP (p. 165–167).
- Amazon notes. $6.2bn of existing Amazon notes convert into 1,840.4m Class N shares (p. 164).
- Ownership caps. Amazon is capped at 12% and Google at 14.99%. Google also holds a $10bn concurrent private-placement option (p. 164, p. 168).
- AMD. AMD may buy up to $5bn of Class N stock (p. 163).
- Revolver. The credit facility was amended and restated to $15bn in September 2026, with a $5bn minimum-liquidity covenant (p. 162–163, F-64).
The suppliers are financing their own customer. Convenient, until the customer is also the competition.
Who controls Anthropic after the IPO?
Anthropic is a Delaware public benefit corporation and a Nasdaq "controlled company". Sources: S-1 cover, p. 12, 14-15, 245-246.
You can buy the stock. You will not be in charge of the company. The structure is unlike any other large-cap listing:
- PBC status. As a public benefit corporation, directors must balance stockholders' financial interests with its stated public benefit (p. 14).
- Class F. A single share held by a Founder LLC carries 50.1% of the voting power, which makes Anthropic a "controlled company" under Nasdaq rules (p. 14–15, cover).
- Class T and the Long-Term Benefit Trust (LTBT). Class T stock lets the LTBT elect a majority of the board. The trust has five trustees, including Neil Buddy Shah (chair), Richard Fontaine and Christopher Stubbs (p. 245–246).
- Class N. Non-voting shares: the class used for the Amazon note conversion, AMD's purchase right and the Public Benefit Fund.
- Class E. Employee stock that votes only on limited matters.
- Class A. The listed shares, at one vote each.
The seven co-founders each hold roughly 232–245m Class A shares (p. 289). The executive team includes:
- Dario Amodei, CEO
- Daniela Amodei, President and Chair
- Krishna Rao, CFO
The board includes Reed Hastings, Chris Liddell, Vas Narasimhan and Yasmin Razavi (p. 254–255).
The Public Benefit Fund. 846,840,960 Class N shares, 5% of the fully diluted count, are set aside for a Public Benefit Fund. Another 2% gets added for each 50% rise in the share price, and the co-founders have pledged 80% of their equity (p. 12). We count those shares in the diluted total. Leave them out and fair value rises to $72.06. Nice for the share price. Less nice if you were hoping the founders' equity was entirely yours to think about.
Simplified. Early-release conditions are tied to day counts and earnings releases. Source: S-1 p. 307-308.
Risks the market will price
The market is not going to put a multiple on the end of the world. It will put one on these.
- Supplier-competitors. Google and Amazon are Anthropic's largest compute suppliers, its main distribution channels and major shareholders, and Google is also a direct model competitor (p. 56, p. 170–171).
- Take-or-pay exposure. If demand slows, the bulk of the obligations stays payable. Most of the large contracts are take-or-pay or non-cancelable except on the counterparty's breach (p. 170–171, F-58). Our base case assumes Anthropic pays all of them, except SpaceXAI after about June 2027, which either side can cancel on 90 days' notice (p. 171). That is deliberately conservative.
- Government. On 27 February 2026 the Department of War designated Anthropic a supply-chain risk. The Northern District of California ruled for Anthropic, and the D.C. Circuit ruled 2–1 against (p. 71–72, F-64). Government revenue is about 1% of total (p. 70).
- Copyright. The Bartz class action settled for $1.5bn, approved in July 2026 (p. 92, p. 151). The S-1 says other active cases could still follow its reasoning (p. 86).
- Power and grid access. Interconnection queues, turbine and transformer lead times, and rising electricity prices could limit compute scaling (p. 33–36).
- Dilution. Note conversions, NPAs settled in stock, the Public Benefit Fund, RSUs and a 2026 equity plan of 2,950m shares plus a 160m-share ESPP (F-65) all add to the share count.
- Revenue quality. 5–7% of nine-month revenue came from usage-policy violators (p. 145), and most revenue is consumption-based and could fall if usage drops.
OpenAI vs Google vs Anthropic vs SpaceXSI
A note on the name, before anyone writes to us. SpaceXSI means SpaceX's Super Intelligence (SI) segment, formerly its AI segment. It was built from xAI, which merged into SpaceX on 2 February 2026. Our SpaceX Q3 2026 earnings and valuation analysis covers the segment in detail. The segment covers Colossus compute (sold on to other people, including Anthropic), Grok, Cursor and X (SpaceX 10-Q). The S-1 calls the counterparty "SpaceX.AI LLC (formerly known as X.AI LLC)", or "SpaceXAI" (p. 171). Same shop. Longer letterhead.
AnthropicModel lab, enterprise-first. Listing as ANT.
- Revenue
- $11.56bn in Q2 2026; $16.29bn in H1 2026 S-1 p. 157, 22
- Growth
- +1,368% YoY (Q2 2026) S-1 p. 10
- Operating margin
- +8% GAAP, 19% adjusted (Q2 2026) S-1 p. 157, 196
- Customers
- 11,900+ at $100k+; about 40m smaller customers S-1 p. 142
- Models
- Mythos, Opus, Sonnet, Haiku (5.x) S-1 p. 199
- Compute
- ~$853bn of obligations; owns little F-35, F-58, F-65
- Capital
- $141.1bn raised; Series H $965bn post S-1 p. 10; Anthropic
 OpenAI
Private. Consumer-scale leader; IPO filed confidentially (Jun 2026).
- Revenue
- ~$50bn annualised (end-Sep 2026); target $70bn+ by year-end Bloomberg
- Users
- ChatGPT ~1.2bn weekly The Decoder
- Operating margin
- Not disclosed -
- Models
- GPT family; ChatGPT, API OpenAI
- Compute
- ~26GW of chip deals (NVIDIA 10, AMD 6, Broadcom 10); Stargate ~7GW OpenAI
- Spend plan
- ~$600bn of compute spend by 2030 CNBC
- Capital
- $122bn at $852bn post (Mar 2026); talks at $1.25tn pre Bloomberg, TechCrunch
 Google
Alphabet. Full-stack: TPU to Search. Shown here: Google Cloud.
- Revenue
- Google Cloud $30.7bn in Q3 2026 (+103%) Alphabet Q3 2026
- Operating margin
- Google Cloud 36.2% Alphabet Q3 2026
- Backlog
- $561bn cloud backlog Alphabet Q3 2026
- Users
- Gemini app ~1bn Q3 2026 call
- Models
- Gemini 4 Q3 2026 call
- Capex
- $51.4bn in Q3; FY2026 guide $195-205bn Alphabet Q3 2026
- Also
- Sells TPU systems; supplies Anthropic Q3 call; S-1 p. 170
 SpaceXSI
SpaceX Super Intelligence segment (xAI, Grok, Cursor, X). Listed as SPCX.
- Revenue
- $7.56bn in Q3 2026 (+830% YoY) SpaceX 10-Q
- Operating income
- $431m (~5.7%); adj. EBITDA $4.95bn SpaceX Q3 2026
- Compute
- 1.7GW nameplate; 2.5-3GW targeted by year-end Q3 2026 call
- Capex
- $16.4bn in Q3; $40.0bn in 9M SpaceX Q3 2026
- Products
- Grok, Cursor (+$608m in Q3), X SpaceX Q3 2026
- Customers
- Anthropic: up to $120.5bn of GPU capacity S-1 p. 171
- Capital
- SpaceX IPO Jun 2026, $85.7bn net at $135 SpaceX
OpenAI figures are press-reported (private company). Google figures are for the Google Cloud segment. SpaceXSI is SpaceX's Super Intelligence segment. Full links under Sources.
$122.8bn (Q3 x 4) Alphabet~$50bn run-rate Bloomberg$46.2bn (Q2 x 4) S-1 p. 157$30.2bn (Q3 x 4) SpaceXRun-rates are the latest quarter x 4 (our calculation) except OpenAI's, which is press-reported. Bloomberg reported Anthropic at ~$65bn annualised by end-July.
36.2% (Q3 2026) Alphabet8.4% GAAP; 19% adjusted (Q2 2026) S-15.7% (Q3 2026); EBITDA margin 65.5% SpaceXnot disclosed Google = Google Cloud segment. SpaceXSI adjusted EBITDA of $4.95bn on $7.56bn revenue (our calculation).
$110.8bn financing inflow, H1 2026 S-1 p. 168$122bn round (Mar 2026) Bloomberg$85.7bn IPO net proceeds (SpaceX group) SpaceX$51.4bn capex in one quarter (self-funded) AlphabetDifferent instruments, shown together for scale.
The comparison is unfair, and we are going to do it anyway. Anthropic's figures are audited or reviewed numbers from an S-1. Google Cloud and SpaceXSI are reported segments of public companies. OpenAI is private, so its figures are what the press says the run-rate and the funding mark are. Every number below has a source on it. We do not mix a hypothetical with a reported figure and hope you won't notice.
- Scale. Google Cloud is still the largest AI-exposed revenue line, at $30.7bn in Q3 2026, up 103%. Anthropic's Q2 2026 revenue of $11.56bn is about twice SpaceXSI's Q3 $7.56bn. OpenAI's ~$50bn annualised run-rate at end-September is comparable to Anthropic's ~$46bn Q2 run-rate (our Q2 × 4).
- Profitability. Google Cloud earns a 36.2% operating margin. Anthropic reached 8% GAAP and 19% adjusted in Q2 2026. SpaceXSI made $431m of operating income on $7.56bn, about 5.7%, but $4.95bn of adjusted EBITDA, because its business is depreciation-heavy. OpenAI does not publish margins.
- Capital intensity. Alphabet guides to $195–205bn of 2026 capex. SpaceXSI spent $16.4bn in Q3 alone. OpenAI has announced about 26GW of chip partnerships and ~7GW of Stargate sites. Anthropic owns very little, but has signed for ~$853bn.
- Users and distribution. ChatGPT has about 1.2bn weekly users and the Gemini app about 1bn. Anthropic is enterprise-first, with more than 11,900 $100k+ customers, and sells half its volume through other companies' clouds.
| | | | |
|---|---|---|---|---|
| Owned data-centre power / compute | Limited; Anthropic Direct ramping (p. 137) | Stargate sites ~7GW planned with partners | Global fleet; Q3 capex $51.4bn | 1.7GW nameplate; 2.5-3GW by YE 2026 |
| Contracted compute | ~$853bn of obligations + $145bn+ variable | ~26GW of chip deals; ~$600bn spend by 2030 | Supplier: $114.5bn to Anthropic + TPU sales | Supplier: up to $120.5bn to Anthropic |
| Silicon | TPU, Trainium, NVIDIA, AMD (buyer) | Broadcom custom accelerator (10GW) | TPU (in-house, now sold) | NVIDIA GPUs (buyer) |
| Frontier models | Claude Mythos / Opus / Sonnet / Haiku | GPT family | Gemini 4 | Grok |
| Reach | 11,900+ $100k+ customers; 48% via CSPs | ChatGPT ~1.2bn weekly users | Gemini app ~1bn users; Search, Android | X; Grok; Cursor |
Sources: S-1 p. 137, 170-171, 199; OpenAI partnership releases; Alphabet Q3 2026; SpaceX Q3 2026 10-Q and call.
Vertical integration of AI: who owns which layer
AI is a stack. The money sits at every layer, from the electricity in the data centre to the app on your phone. How much of that stack you own decides what your compute costs, whether you can charge for it, and how stuck you are with the people who sell it to you. Anthropic lives near the top and has signed a very large cheque to the people who live at the bottom.
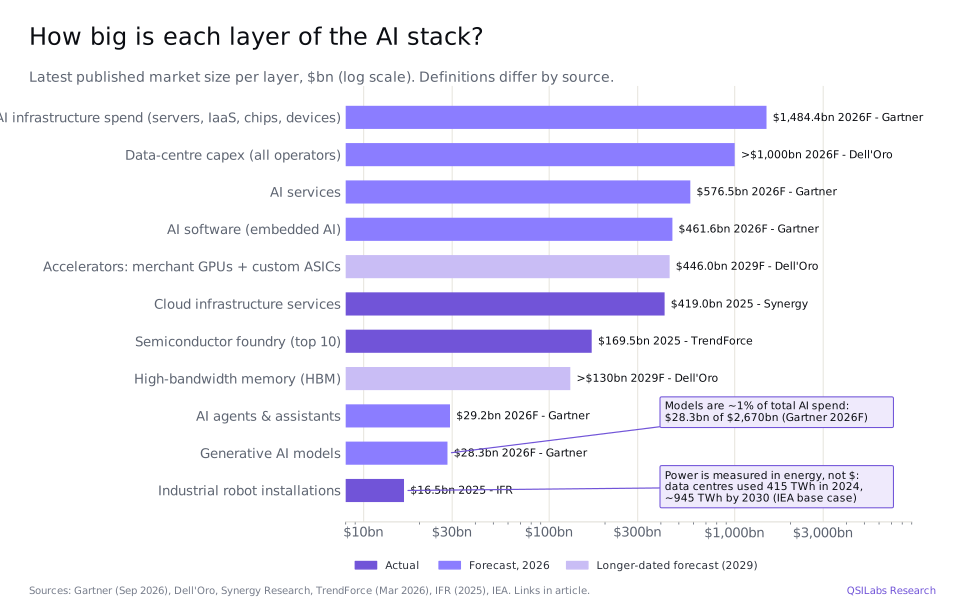
| Layer | Market size | | | | |
|---|---|---|---|---|---|
| Power & energy | 415 TWh DC electricity (2024) to ~945 TWh (2030)IEA | In progressCommits to procure new generation and cover rate impacts; no owned generation (p. 34, 36) | In progressStargate sites developed with power partners | AchievedOwns Intersect (closed Mar 2026); Kairos 500MW nuclear deal | AchievedColossus on-site turbines and Megapacks; 1.2GW Southaven gas plant permitted |
| Data centres | >$1tn DC capex (2026F)Dell'Oro | In progressAnthropic Direct; expanding own DC footprint (p. 11, 74, 137) | In progressStargate: ~7GW and >$400bn across sites | AchievedGlobal owned fleet; capex $195-205bn (FY2026 guide) | AchievedColossus: 1.7GW nameplate (Q3 2026) |
| Accelerator design | $446bn GPUs + ASICs (2029F)Dell'Oro | No disclosed plansBuys TPU, Trainium, NVIDIA and AMD capacity | In progressBroadcom custom accelerators, 10GW | AchievedTPU, now also sold as systems | No disclosed plansNVIDIA GPUs |
| Foundry & memory | $169.5bn foundry (2025); HBM >$130bn (2029F)TrendForce; Dell'Oro | No disclosed plans | No disclosed plans | No disclosed plansUses external foundries | No disclosed plans |
| Cloud / compute for others | $419bn cloud infrastructure (2025)Synergy | No disclosed plansNet buyer; ~$853bn of obligations | No disclosed plansNone disclosed in sources reviewed | AchievedGoogle Cloud: $30.7bn in Q3, $561bn backlog | AchievedNeocloud: up to $120.5bn of capacity contracted to Anthropic |
| Frontier models | $28.3bn GenAI models (2026F)Gartner | AchievedClaude 5.x | AchievedGPT | AchievedGemini 4 | AchievedGrok |
| Platform & agents | $29.2bn agents & assistants (2026F)Gartner | AchievedAPI, MCP, Agent Skills, Managed Agents | AchievedAPI and agents | AchievedGemini API, Gemini Enterprise Agent Platform | AchievedGrok API, Cursor |
| Applications | $462bn AI software (2026F)Gartner | AchievedClaude Code, Cowork, Claude apps | AchievedChatGPT | AchievedGemini app, Workspace | AchievedGrok, Cursor |
| Owned distribution | n/a (a moat, not a market)- | No disclosed plansPartner-led: 48% of revenue via CSP marketplaces | AchievedChatGPT, ~1.2bn weekly users | AchievedSearch, Android, Chrome; Gemini app ~1bn | AchievedX platform |
| Consumer devices | n/a in sources reviewed- | No disclosed plans | In progressFirst device not before late Feb 2027 | AchievedPixel, Android devices | No disclosed plansNone in the SI segment |
| Robotics & physical AI | $16.5bn industrial robot installs (2025)IFR | In progressModel Hardware Standard for lab and factory equipment | No disclosed plansNone disclosed in sources reviewed | AchievedWaymo autonomous driving | No disclosed plansNone in the SI segment |
| Integration score | 2 = achieved, 1 = in progress | 9 / 22 | 12 / 22 | 20 / 22 | 14 / 22 |
Sources: S-1 (Anthropic); OpenAI partnership and Stargate releases, Wired/The Verge (devices); Alphabet Q3 2026 release and call, Alphabet/Intersect, Google/Kairos; SpaceX Q3 2026 10-Q and call, TechCrunch (Colossus turbines); market sizes as cited. "No disclosed plans" means none found in the sources reviewed.
Integration score. We score 2 for each layer achieved and 1 for each in progress, out of 22. Google scores 20, SpaceXSI 14, OpenAI 12 and Anthropic 9.
How to read the matrix. "Achieved" means they run that layer today, at commercial scale. "In progress" means they have signed or announced something that is not there yet. "No disclosed plans" means we could not find one in the filings we read. It does not mean they have sworn off the idea.
- Google is the most integrated:
- power through Intersect, acquired in March 2026, plus Kairos nuclear
- its own data centres and TPUs, now also sold as systems
- Google Cloud, Gemini, and distribution through Search, Android and the Gemini app
- devices, and Waymo in physical AI
- SpaceXSI owns power and data centres (the Colossus sites and the Southaven gas plant) and has 1.7GW of nameplate compute. It sells that compute to others, including up to $120.5bn to Anthropic, and adds models (Grok), apps (Grok, Cursor) and distribution (X). It relies on NVIDIA for chips.
- OpenAI is building the stack through partners: Stargate sites, Broadcom custom accelerators, and a first device expected no earlier than late February 2027. Its edge is the largest consumer surface in AI.
- Anthropic makes the model and the app, and rents almost everything underneath. Distribution sits mostly inside other companies' clouds. Anthropic Direct is a first step down the stack. It is a step, not a staircase.
Anthropic IPO valuation: what are the shares worth?
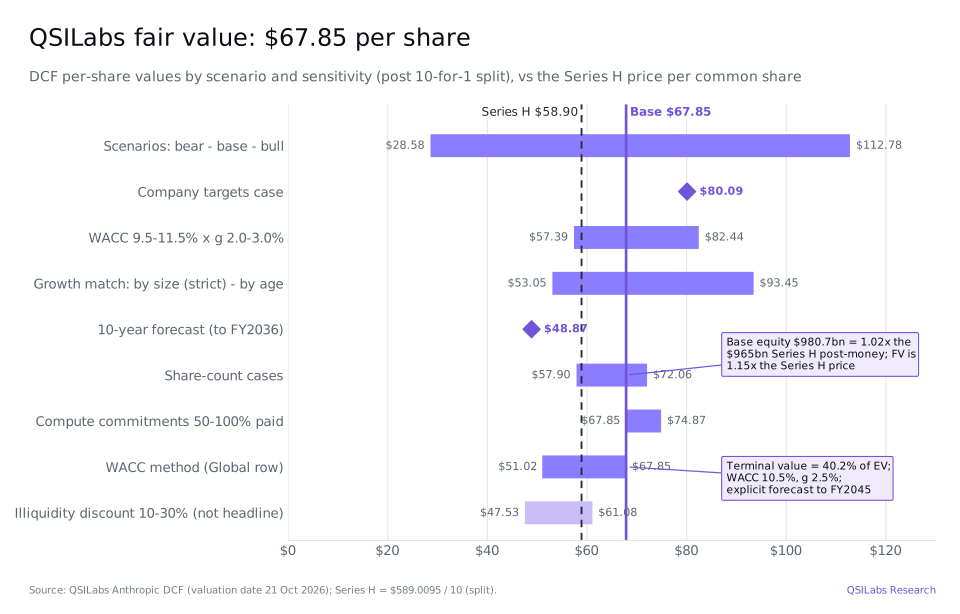
Our number is $67.85 a share, or $980.7bn of equity. The rumour mill says $2 trillion. Even our bull case, $1.63tn, does not get there.
Method. We value Anthropic with a discounted-cash-flow model:
- Revenue on Google's trajectory. We start Anthropic where Google was at a similar size, about $114bn in FY2027 (Google in 2017), and apply Google's actual growth from there. Revenue reaches $210bn in FY2030, $415bn in FY2035 and $959bn in FY2045, when growth settles at 2.5%.
- Margins converge to mature levels. The operating margin rises from 8% in Q2 2026 to 31.3%, the median of mature software peers, by FY2036. Google's own margin at the same size was 26.5%.
- Compute commitments are a cost. Where contracted compute exceeds what the business needs, we deduct the excess. It weighs on FY2027–31 and takes the FY2027 operating margin to −43.8%.
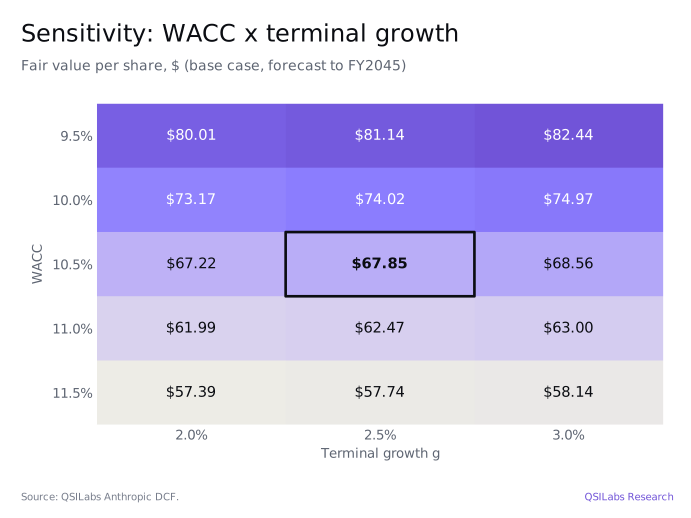
- Discounting. WACC of 10.5% and terminal growth of 2.5%. Terminal value is 40% of enterprise value.
The result is $67.85 a share.
| Bridge | $bn |
|---|---|
| Enterprise value | 880.4 |
| + Cash and short-term investments (30 Jun 2026), less $5bn minimum liquidity | 126.7 |
| − Leases, Bartz accrual and unrecognised RSU cost | (26.4) |
| = Equity value | 980.7 |
| ÷ Fully diluted shares (treasury method), m | 14,454 |
| = Fair value per share | $67.85 |
The fully diluted count includes:
- the preferred as-converted (8,559m shares)
- the Amazon notes (1,840m)
- the Public Benefit Fund (847m)
- vested options under the treasury method (875m)
How the number moves if you argue with us:
- Scenarios. Bear $28.58, on slower Microsoft-like growth from the low-end FY2027 forecast. Bull $112.78, on faster Meta-like growth from the high-end forecast. $80.09 if the company hits its own targets.
- Growth alignment. Matching today's run-rate strictly to Google (Google in 2015) gives $53.05. Matching by age instead (Anthropic 2021 = Google 1998, capped at 30% of the AI software market) gives $93.45.
- Forecast length. A ten-year forecast on the same growth path gives $48.87.
- Margins. Using Google's 26.5% median operating margin at the same scale as the end-state gives $57.05.
- Commitments. If only 50% of the commitments have to be paid, fair value rises to $74.87; at 80% it is $71.59. Counting SpaceXAI in full to 2029 lowers it to $63.43.
- Discount rate. Using Damodaran's global industry row (WACC 12.3%) lowers it to $51.02.
- Revenue quality. Removing usage-policy-violator revenue lowers it to $62.87.
Caveats, before anyone quotes the $67.85 on its own.
- We valued the company five days before the S-1 landed. Q3 2026 actuals are not in the filing.
- Private marks bracket our number, and they are allowed to be wrong too:
- Series H at $965bn post-money (28 May 2026), just below our $980.7bn
- IPO talk of $1.5–2tn, reported by Reuters on 19 October 2026
Key takeaways for investors
- The growth is real, and so is the cash. Q2 2026 is the first quarter the business made an operating profit and threw off operating cash. That is the number in the filing that matters most.
- Underwrite the compute contracts, not the income statement. For the next decade, the question is whether revenue grows into about $853bn of promises. The bits they can cancel or pay only when capacity shows up (SpaceXAI, Nscale, Lambda) are the emergency exit.
- Do not fall in love with the 85% gross margin. It leaves training compute out. Compute was still 55% of revenue in the first half of 2026.
- You are buying a vote you do not get to use. Class A holders will not control the board, and a public benefit corporation can put the mission ahead of your return. Some people will pay up for that. Some people should not.
- The hyperscalers are everywhere in this story. They supply the compute, resell the product, own the notes, and compete on models. That is a lot of hats for one set of counterparties.
- At the Series H price of $58.90 a share, you are paying about 13% less than our $67.85 base case. But about $19 a share of that rests on growth continuing beyond FY2036. At IPO talk of $1.5–2tn, you are paying for something close to our $1.63tn bull case, or more.
FAQ
When is the Anthropic IPO and what is the ticker?
Anthropic filed its S-1 on 26 October 2026 to list Class A shares on Nasdaq under the ticker "ANT". The price and the date were still blank. Come back when the amendment arrives.
How much revenue does Anthropic make in 2026?
$4.59bn in 2025, and $16.29bn in the first half of 2026, including $11.56bn in Q2 alone (S-1 p. 22, p. 157). Q3 is a blank in the filing. The newspapers have a number. The prospectus does not.
Is Anthropic profitable?
On operations, yes, just. Q2 2026 was a $974m GAAP operating profit, and a 19% adjusted operating margin. The GAAP net loss is still enormous, $80.7bn in the first half, and about 90% of that is a non-cash mark on convertible notes. So: profitable at the thing they do, loss-making at the accounting of how expensive they have become.
How much has Anthropic committed to compute?
About $853bn of disclosed obligations by the filing date, across Google, Amazon, Microsoft, Broadcom, SpaceXAI, Nscale, Lambda and others. A further $125–150bn of variable TPU capacity and more than $20bn of AMD systems are not even in that total. Read that again before you buy the growth story on its own.
Who controls Anthropic after the IPO?
A single Class F share, held by a Founder LLC, carries 50.1% of the votes. The Long-Term Benefit Trust's Class T stock elects a majority of the board. You can own shares. You do not get the steering wheel.
What is Anthropic's fair value?
$67.85 a share, post-split and fully diluted, from our DCF, with revenue on a Google-like growth path to FY2045. That is $980.7bn of equity, or 1.15 times the Series H price per common share. Our bull case is $112.78, or $1.63tn of equity. Still not $2 trillion.
Why does QSI Labs model Anthropic on Google's growth path?
Because few companies have stayed this big and this fast for this long. Google grew revenue 15.1% in 2025, more than 25 years after it was founded. We start Anthropic where Google was at the same size, about $114bn of revenue in FY2027 (Google in 2017), apply Google's actual growth for the years that followed, then fade to 2.5% by FY2045. That puts base-case revenue at $414.7bn in FY2035 and $958.9bn in FY2045, about 28% of the AI software market. On a standard ten-year forecast, the same path is worth $48.87 a share.
What is SpaceXSI?
SpaceX's Super Intelligence segment, built out of xAI after the February 2026 merger. Colossus compute, Grok, Cursor and X. It also sells compute to Anthropic, up to $120.5bn of it. Partner, supplier, and a name you will see a lot in this filing.
Sources
- Anthropic PBC, Form S-1 (filed 26 Oct 2026) www.sec.gov
- Anthropic, Series H announcement (28 May 2026) www.anthropic.com
- Anthropic: Google and Broadcom compute partnership www.anthropic.com
- Bloomberg via Yahoo Finance: OpenAI expects $70bn annualised revenue (8 Oct 2026) finance.yahoo.com
- TechCrunch: OpenAI working on new $30bn raise at $1.25tn (22 Oct 2026) techcrunch.com
- The Decoder: OpenAI revenue and ChatGPT weekly users the-decoder.com
- OpenAI and NVIDIA systems partnership openai.com
- OpenAI and AMD strategic partnership openai.com
- OpenAI and Broadcom collaboration openai.com
- OpenAI: five new Stargate sites openai.com
- CNBC: OpenAI data-centre pivot (22 Mar 2026) www.cnbc.com
- The Verge: OpenAI's first hardware slips to 2027 www.theverge.com
- Alphabet Q3 2026 earnings release (Exhibit 99.1) www.sec.gov
- Alphabet Q3 2026 earnings call transcript (Motley Fool) www.fool.com
- CNBC: Alphabet Q3 2026 earnings (28 Oct 2026) www.cnbc.com
- Alphabet: agreement to acquire Intersect abc.xyz
- Google and Kairos Power nuclear agreement blog.google
- SpaceX Q3 2026 10-Q, segment note (SI segment) www.sec.gov
- SpaceX Q3 2026 earnings release www.sec.gov
- SpaceX Q3 2026 earnings call transcript (Motley Fool) www.fool.com
- TechCrunch: SpaceX and xAI's Colossus turbines (31 Jul 2026) techcrunch.com
- Gartner: worldwide AI spending forecast (16 Sep 2026) www.gartner.com
- Dell'Oro: data-centre capex up 57% in 2025 www.delloro.com
- Dell'Oro: merchant GPUs and custom accelerators to reach $446bn by 2029 www.delloro.com
- TrendForce: foundry revenue ranking (12 Mar 2026) www.trendforce.com
- Synergy Research: cloud revenues Q4 2025 www.srgresearch.com
- IEA: Energy and AI, energy demand from AI www.iea.org
- IFR: Top 5 global robotics trends ifr.org
- CNBC (citing FT, WSJ): Anthropic Q3 revenue report (15 Oct 2026) www.cnbc.com
- FutureSearch: Anthropic financial forecast (26 Oct 2026) futuresearch.ai
- Luminix (citing Sacra, SemiAnalysis): Anthropic revenue and burn rate (Oct 2026) www.useluminix.com
- heise online (citing Gartner): AI spending rises to $2.7 trillion (Sep 2026) www.heise.de
- Google Inc Form 10-K FY2004 (SEC) www.sec.gov
- Google Inc Form 10-K FY2008 (SEC) www.sec.gov
- SEC XBRL companyfacts: Google revenue and operating income data.sec.gov
- QSILabs Anthropic DCF model (internal, valuation date 21 Oct 2026)
Disclaimer
This article is published by QSI Labs for general information only. It does not constitute, and shall not be construed as, an offer to sell, or a solicitation of an offer to buy, any security, commodity, or investment product, nor does it constitute investment, legal, tax, accounting, or other professional advice. Nothing in this article is a recommendation or an invitation to purchase, sell, hold, or otherwise deal in any security, including any security of Anthropic PBC or of any other issuer mentioned.
Any valuation in this article, including any fair-value figure, is the output of a model prepared by QSI Labs on the assumptions stated herein. It is not a forecast or a guarantee of any future price, and it is not the price at which any security has been, or may be, offered or sold. Scenarios, targets, and other forward-looking statements are hypothetical. Actual results may differ materially from those discussed. Past performance is not indicative of future results. Modelled or hypothetical results do not represent actual trading and may omit the effect of material economic and market factors.
Information is taken from public filings and from other sources believed to be reliable as of the date of publication. QSI Labs does not represent that such information is accurate, complete, or current, and undertakes no duty to update this article. Figures described as calculated or derived are QSI Labs' own calculations and may differ from figures published by an issuer or by any other person. Opinions are those of QSI Labs as of the date of publication and may change without notice.
You should consult your own legal, tax, and financial advisers and make your own independent assessment before making any investment decision. Any decision you make is yours alone. To the fullest extent permitted by law, QSI Labs accepts no liability for any loss or damage arising out of the use of, or reliance on, this article.
Names and logos of third parties are the trademarks of their respective owners and are used solely for identification. Such use does not imply any affiliation with, sponsorship by, or endorsement of, QSI Labs.
More from QSI Labs
Read our white paper, QSI Labs: An AI-Native Trading Firm Built on a Training Loop (October 2026), available on request, read our SpaceX Q3 2026 earnings, Terafab and valuation, or browse the research index.