Research / Earnings and valuation
Visa stock Q3 2026:a $12.1bn quarter, 14% cross-border growth and a slower 2027
Visa stock goes into November 2026 after the best year the payments network has had in more than a decade, and a forecast that says the next one will be slower. Visa's fiscal fourth quarter of 2026, which ran from July to September and is the same as calendar Q3 2026, brought net revenue of $12.1bn, up 13%, cross-border volume growth of 14% and non-GAAP earnings of $3.48 per share. The question for Visa stock in Q3 2026 is what investors should pay for a business that compounds at low double digits. All figures are as of Visa's fiscal Q4 2026 results, reported on 27 October 2026; share prices are as of the 30 October 2026 close of $413.59.
Key takeaways
- Value: the QSILabs discounted cash flow value for Visa (V) is $264.07 per share as of its fiscal Q4 2026 results, against a $413.59 close on 30 October 2026, about 36% lower.
- Quarter: Visa net revenue was $12,139m in fiscal Q4 2026 (quarter ended 30 September 2026), up 13% from $10,724m a year earlier, with GAAP EPS of $3.19 (+22%) and non-GAAP EPS of $3.48 (+17%) (Visa 8-K, 27 October 2026).
- Full year: fiscal 2026 net revenue was $45,903m, up 15%, the fastest growth in more than 15 years outside the post-pandemic rebound and acquisitions, with GAAP net income of $23,504m and operating cash flow of $23,728m.
- Network: payments volume rose 9% in constant dollars in the quarter, cross-border volume excluding intra-Europe 14% and processed transactions 10% to 74.2 billion.
- Outlook: Visa expects fiscal 2027 net revenue growth in the low double digits and adjusted EPS growth of low double digits to low teens, below fiscal 2026's 15% and 16%; analysts expect revenue of $51.0bn.
- Cash returns: Visa spent $20.5bn on buybacks and $5.1bn on dividends in fiscal 2026, more than its $22.1bn of free cash flow, and raised the quarterly dividend 16% to $0.78.
Visa stock Q3 2026 in brief
Short answer: Visa remains one of the most profitable large companies in the world, and the market prices it as one. Our discounted cash flow value is $264.07 per share (a QSILabs estimate), about 36% below the $413.59 close. The gap is not about the quarter, which beat expectations. It is about the long run: we assume growth fades from 11% in fiscal 2027 to 3.5% by fiscal 2035, an operating margin held at 61% and an 8.09% discount rate. The share price implies that Visa keeps growing near its current pace for much longer than that.
| Key number, fiscal Q4 2026 | Value | Year on year | Source |
|---|---|---|---|
| Net revenue | $12,139m | +13% | 8-K Ex 99.1 |
| Service revenue | $5,255m | +14% | 8-K Ex 99.1 |
| Data processing revenue | $6,245m | +16% | 8-K Ex 99.1 |
| International transaction revenue | $4,115m | +8% | 8-K Ex 99.1 |
| Client incentives | $5,123m | +21% | 8-K Ex 99.1 |
| GAAP operating income / margin | $7,262m / 59.8% | from $6,148m / 57.3% | 8-K Ex 99.1 |
| GAAP / non-GAAP EPS | $3.19 / $3.48 | +22% / +17% | 8-K Ex 99.1 |
| Fiscal 2026 net revenue | $45,903m | +15% | 8-K Ex 99.1 |
| Fiscal 2026 free cash flow | $22,057m | from $21,577m | 8-K Ex 99.1 |
| QSILabs value per share | $264.07 | vs $413.59 price | QSILabs estimate |
How did Visa do in fiscal Q4 2026?
Visa's fiscal Q4 2026 was a clean beat. Net revenue rose 13%, on both a nominal and a constant-dollar basis, to $12.1bn, slightly above the $12.09bn analysts expected, and non-GAAP EPS of $3.48 beat the $3.44 consensus, according to Investing.com. GAAP net income rose 18% to $6.0bn, or $3.19 per share.
GAAP earnings were held down by special items: a $469m provision for the US interchange multidistrict litigation, a $282m non-cash donation of investments to the Visa Foundation and a $37m deferred tax charge. Excluding those, $155m of equity investment gains and $75m of acquisition amortisation, non-GAAP net income was $6.6bn, up 13%. Chief executive Ryan McInerney called fiscal 2026 "a milestone year" and said Visa had achieved "record net revenue of $46 billion, up 15%, the strongest growth in over 15 years excluding the post-pandemic recovery and acquisitions".
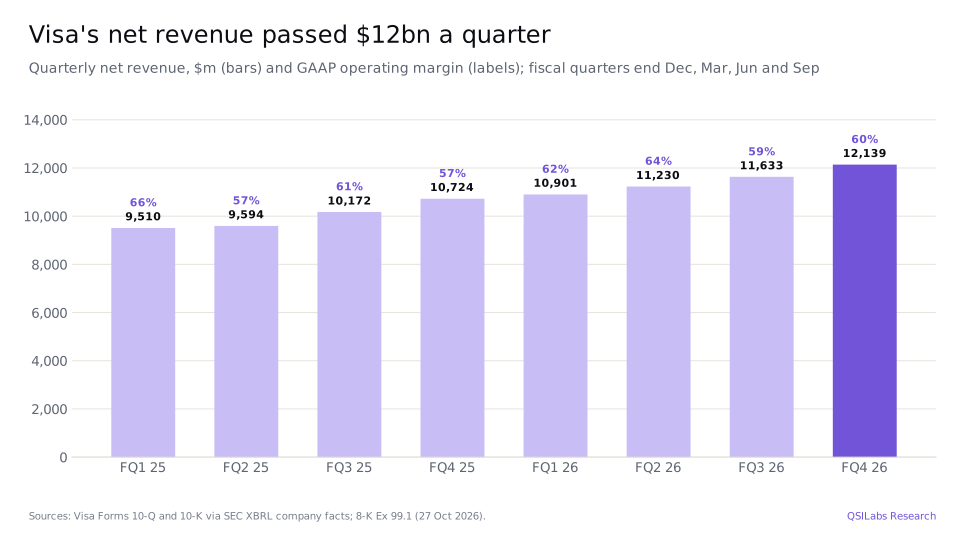
GAAP operating expenses were $4.9bn, up 7%, while non-GAAP operating expenses rose 12%, driven by marketing and personnel. The GAAP operating margin was 59.8%, up from 57.3% a year earlier, when the litigation provision was $903m rather than $474m. On Visa's non-GAAP basis, the quarter's operating margin was about 66.6% (net revenue of $12,139m less non-GAAP operating expenses of $4,051m).
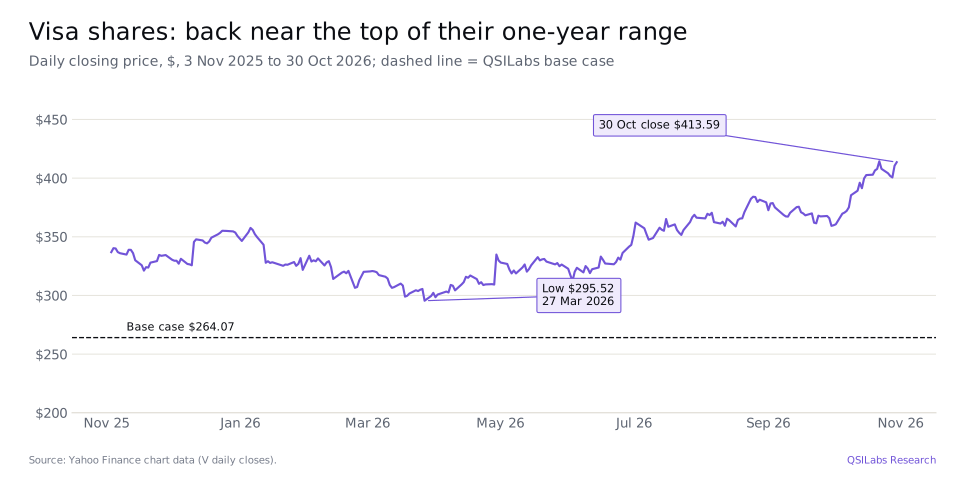
- 27 Mar 202652-week closing low of $295.52Yahoo Finance
- 28 Jul 2026Fiscal Q3 2026 results: net revenue $11.6bn, up 14%Visa 10-Q
- 3 Aug 2026Agreement to buy BioCatch for $2.4bn in cashVisa 8-K
- 18 Sep 2026$405m deposited into the US litigation escrow accountVisa 8-K
- 22 Oct 202652-week closing high of $414.34Yahoo Finance
- 27 Oct 2026Fiscal Q4 2026 results; dividend raised 16% to $0.78Visa 8-K
- 30 Oct 2026Shares close at $413.59Yahoo Finance
- 10 Nov 2026Dividend record date; payable 1 DecemberVisa 8-K
- Jan 2027Fiscal Q1 2027 resultsVisa IR
What drove Visa's revenue growth in 2026?
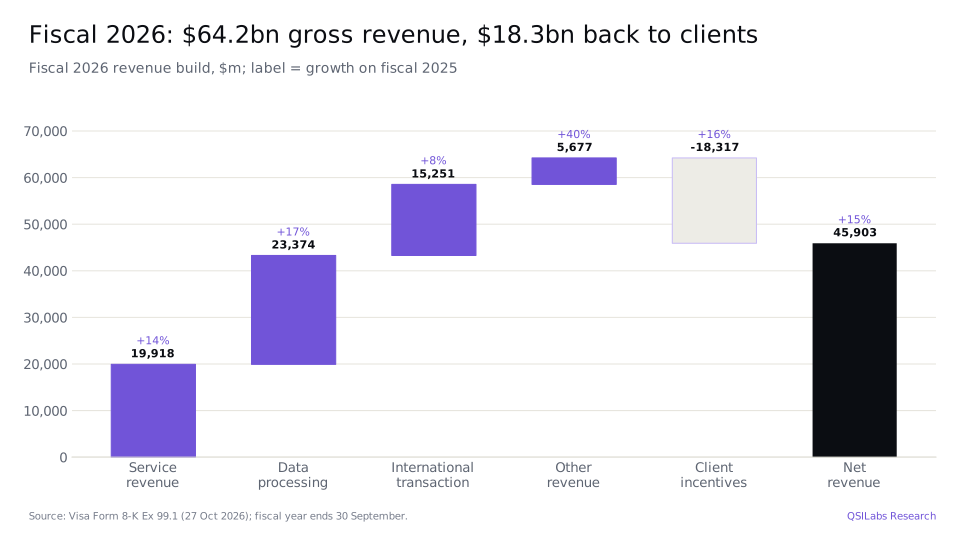
Visa earns money in four ways, and all four grew in fiscal 2026. Service revenue ($19.9bn, +14%) is charged on payments volume and is recognised a quarter in arrears. Data processing revenue ($23.4bn, +17%) comes from authorising, clearing and settling transactions. International transaction revenue ($15.3bn, +8%) is earned on cross-border payments and currency conversion. Other revenue ($5.7bn, +40%) is mostly value-added services such as fraud tools, consulting and data products. From the total of $64.2bn Visa deducts client incentives ($18.3bn, +16%), the payments it makes to banks and merchants to win and keep card programmes, to arrive at net revenue of $45.9bn.
Payments volume, cross-border and processed transactions
The three numbers that drive Visa's revenue all stayed strong in the September quarter. Payments volume rose 9% in constant dollars, the same as for the full year. Cross-border volume excluding transactions within Europe, which drives international transaction revenue, rose 14%, up from 12% for the full year. Processed transactions rose 10% to 74.2 billion, and to 281.3 billion for the year.
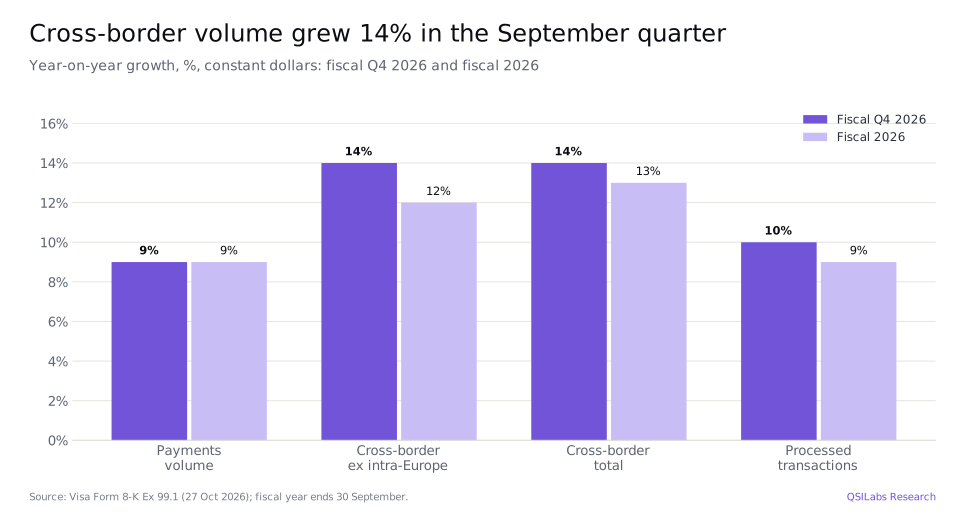
Cross-border volume grew 14% while international transaction revenue grew only 8%. International transaction revenue also depends on currency volatility, which drives currency-conversion fees, so it can grow more slowly than volume when exchange rates are calm. Visa's release does not break out the difference, but it is one reason faster cross-border growth did not translate into faster revenue growth.
Client incentives: the cost of winning deals
Client incentives rose 21% in the quarter, faster than gross revenue. Incentives are contractual and tend to rise when Visa renews or wins large issuer deals, so they can grow in steps. For the full year they rose 16%, close to gross revenue growth, and absorbed 28.5% of gross revenue. That share is the main lever between gross and net revenue growth, and a reason net revenue growth can lag volume growth in a renewal-heavy year.
Value-added services and the BioCatch deal
Other revenue grew 40% to $5.7bn, now 12% of net revenue. Visa is pushing its value-added services, from risk and identity tools to issuing and acceptance products, as its next growth engine. On 3 August 2026 it agreed to buy BioCatch, a provider of behaviour-based fraud intelligence, for $2.4bn in cash. The deal is subject to regulatory approval and is expected to close by the end of fiscal Q2 2027. At about 0.3% of Visa's market value, it does not change our valuation.
How much cash did Visa return to shareholders?
Visa generated $23.7bn of operating cash flow in fiscal 2026 and spent $1.7bn on property, equipment and technology, leaving free cash flow of $22.1bn. It returned $25.6bn: $20.5bn of buybacks, covering about 61 million shares at an average of $335.49, and $5.1bn of dividends. In the September quarter alone it bought back about 11 million shares for $4.0bn, at an average of $369.12.
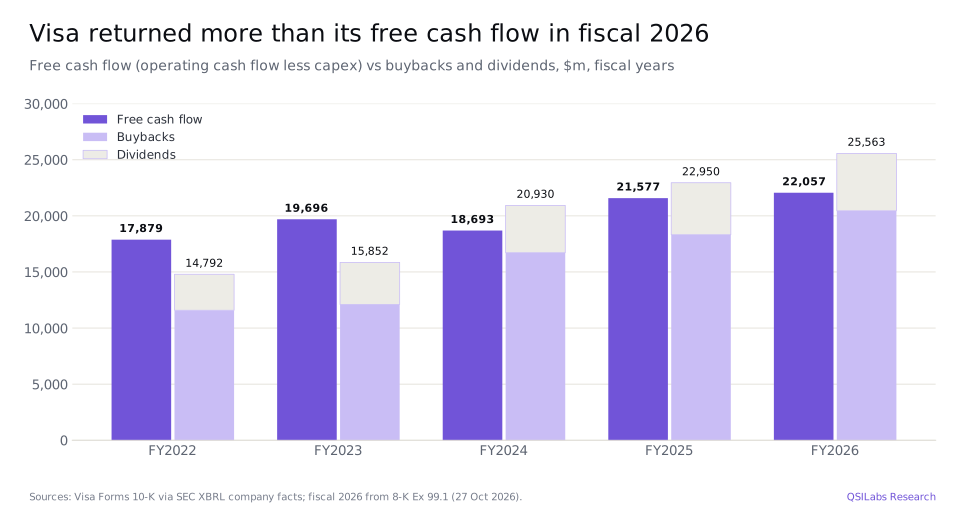
Returning more than free cash flow is possible because Visa ran its cash down. Cash, cash equivalents and investment securities fell to $14.2bn at 30 September 2026, and the US litigation escrow account fell from $2.99bn to $0.63bn as settlements were paid. Total debt was $22.1bn, of which $2.7bn is due within a year. Visa had $24.4bn left on its buyback authorisation and raised its quarterly dividend 16% to $0.78 per share, payable on 1 December 2026 to holders of record on 10 November.
What does litigation cost Visa?
Litigation is Visa's largest recurring non-operating risk. The fiscal 2026 litigation provision was $1.76bn, down from $2.56bn in fiscal 2025, and accrued litigation fell to $990m from $3.03bn as payments were made. Under Visa's US retrospective responsibility plan, the cost of covered US interchange cases is funded from the escrow account and borne by holders of class B shares through a lower conversion rate, so it works like a buyback for class A holders. On 18 September 2026 Visa deposited $405m into the escrow account, which reduced the as-converted class B share counts at an effective price of $366.81.
What is Visa's outlook for fiscal 2027?
Visa expects net revenue to grow at a low-double-digit percentage rate in fiscal 2027, and adjusted EPS to grow at a low-double-digit to low-teens rate, according to the 27 October earnings call as reported by Investing.com. Both are below fiscal 2026, when net revenue grew 15% and non-GAAP EPS 16%. The shares fell 2.3% after hours on the news and closed at $401.86 on 27 October, before recovering to $413.59 by 30 October.
Analysts have taken the guidance at face value. The consensus compiled by S&P Global Market Intelligence and published by StockAnalysis expects fiscal 2027 revenue of $51.0bn (+11.2%) and fiscal 2028 revenue of $56.5bn (+10.7%), with EPS of $15.03 and $17.13. The 40 analysts in the survey have an average price target of $443.44, with a range from $330 to $500.
What is Visa stock worth? V valuation after Q3 2026
Method
We value Visa with a ten-year discounted cash flow model. We forecast net revenue, a GAAP operating margin, tax at 18.5%, depreciation, capex and working capital, and discount the resulting unlevered free cash flow at a weighted average cost of capital of 8.09%. That rate is Aswath Damodaran's January 2026 figure for US information services companies, with a beta of 0.92, a cost of equity of 9.23% and debt at about 25% of capital. A terminal value assumes 2.5% growth after fiscal 2035. We add cash and current investments of $14.1bn, other investments of $1.2bn and $2.0bn of free cash flow earned in October 2026 before the valuation date, subtract debt of $22.1bn and divide by 1,882 million class A-equivalent shares, the as-converted diluted count Visa uses for EPS.
Our forecast
Our base case starts from Visa's own guidance. Net revenue grows 11% in fiscal 2027, in line with the low-double-digit outlook and close to the $51.0bn consensus, and 10.7% in fiscal 2028, matching the consensus of $56.5bn. Growth then slows by about a point a year to 3.5% by fiscal 2035, as payments volume growth moves toward nominal GDP and the shift from cash to cards matures in large markets. That takes net revenue to $81.6bn in fiscal 2035.
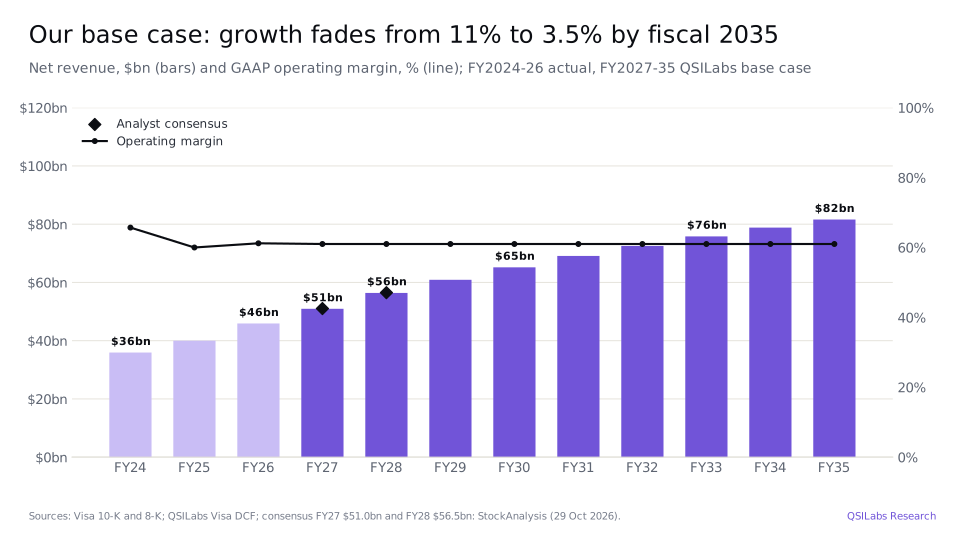
We hold the GAAP operating margin at 61%, close to the 61.2% of fiscal 2026. That is below Visa's non-GAAP margin of about 67.5% for the year, because we treat litigation provisions and restructuring charges as a recurring cost of doing business: Visa has reported a litigation provision of more than $1.7bn in each of the last two years.
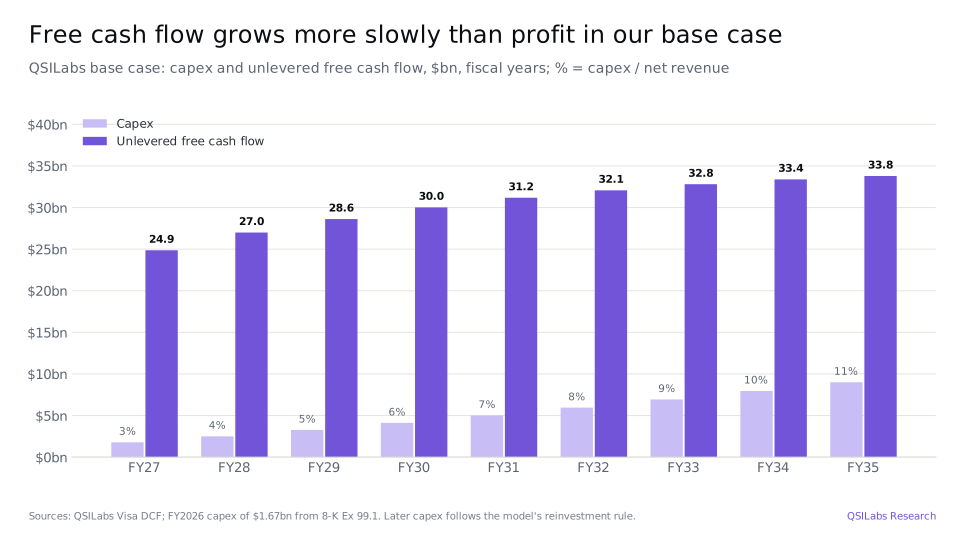
The model ties reinvestment to growth at a 15% return on new capital, so capex rises from 3.5% of net revenue in fiscal 2027 to 11% by fiscal 2035. This is deliberately conservative for a network that has historically spent about 3% to 4% of revenue on capex, and it is the single biggest reason our value sits below the price. Even so, it mostly affects the later years: our fiscal 2027 unlevered free cash flow of $24.9bn is a modest step up from the $22.1bn Visa generated in fiscal 2026.
Football field
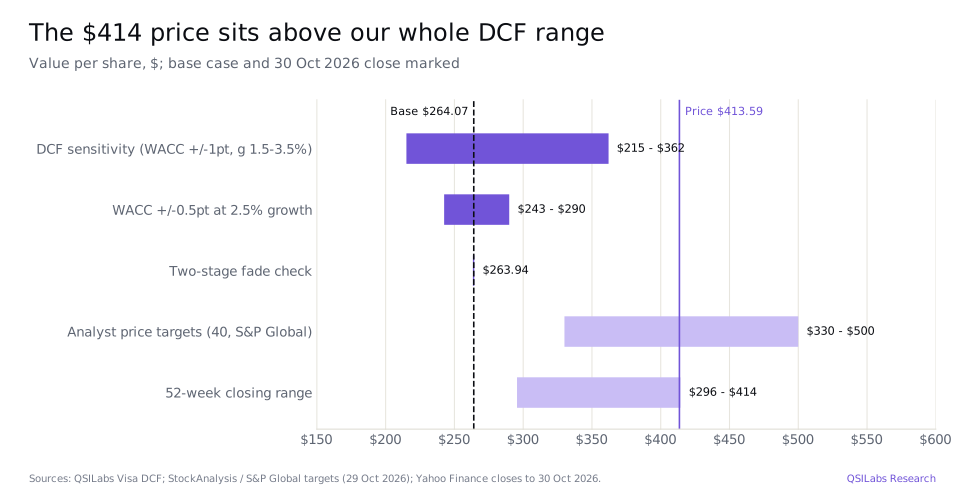
Our base case gives an enterprise value of $501.8bn and an equity value of $497.0bn, or $264.07 per share. The terminal value is 62% of enterprise value, and it implies 11.9 times terminal-year EBITDA. A two-stage fade check, which moves growth to the terminal rate more gradually, gives $263.94. The analysts' target range of $330 to $500 sits well above our range, which tells you that the market values Visa as a long-duration growth business rather than as the mature compounder in our model.
Sensitivity
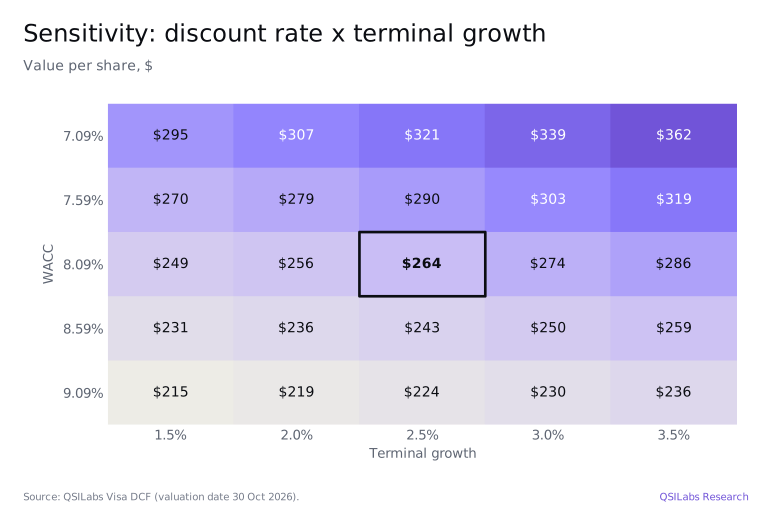
The discount rate matters more than terminal growth. A half-point lower discount rate lifts the value to $290; a half-point higher cuts it to $243. Even the most generous case in the grid, a 7.09% discount rate and 3.5% terminal growth, gives $362, about 12% below the share price.
Is Visa stock overvalued after Q3 2026?
On our numbers, yes: the shares trade about 57% above our base-case value. But the market's view is not unreasonable, and it is worth setting out what it implies. At $413.59, Visa's market value is about $778bn on 1,882 million as-converted shares. That is 31.2 times fiscal 2026 non-GAAP EPS of $13.27, 27.5 times the fiscal 2027 consensus of $15.03 and a free cash flow yield of about 2.8%.
For the price to be right on a cash flow basis, at least one of three things has to be true. Visa has to keep growing at about 10% a year for well over a decade, or keep reinvesting only 3% to 4% of revenue while it grows, or investors have to accept a return on Visa shares closer to 7% than 8%. All three are plausible for a network with a dominant market position and few close competitors. Our base case simply assumes none of them fully holds.
That makes Visa a stock where the investment case rests on the durability of its network rather than on the next few quarters. The fiscal 2027 outlook tells you growth is slowing from an unusually strong year, not collapsing. The risk is that the market's assumptions about how long the growth lasts turn out to be too generous.
What are the biggest risks for Visa stock?
- Regulation and litigation: the US interchange litigation, proposed rules on card routing and swipe fees, and competition cases in the US and Europe could all cap the fees Visa and its bank clients earn.
- Real-time payments: account-to-account systems such as FedNow, Pix in Brazil and UPI in India offer a cheaper alternative to cards for some payments, and stablecoins could do the same for cross-border flows.
- Client incentives: large issuers and merchants have strong bargaining power, and incentives grew 21% in the latest quarter, faster than revenue.
- Cross-border travel: international transaction revenue is about a third of net revenue and depends on travel, currency volatility and e-commerce across borders, all of which are cyclical.
- Consumer spending: payments volume follows nominal consumer spending, so a US recession would slow Visa's growth even if it would not threaten its profitability.
- Valuation: at about 27.5 times forward earnings, the shares already price in a long run of double-digit growth.
Visa stock FAQ
What is Visa stock worth after Q3 2026?
Our discounted cash flow value for Visa is $264.07 per share as of its fiscal Q4 2026 results, about 36% below the $413.59 close on 30 October 2026. It assumes net revenue growth of 11% in fiscal 2027 fading to 3.5% by fiscal 2035, a 61% GAAP operating margin and an 8.09% discount rate. Analysts' price targets average $443.44.
Is Visa stock a buy after its Q4 2026 earnings?
This is not investment advice. On our model the shares look expensive: even our most generous sensitivity case gives $362 per share. Investors who expect Visa to keep growing at about 10% a year for much longer, while spending little on capex, will see more value than we do.
What were Visa's fiscal Q4 2026 results?
For the quarter ended 30 September 2026, Visa reported net revenue of $12.1bn, up 13%, GAAP net income of $6.0bn or $3.19 per share and non-GAAP net income of $6.6bn or $3.48 per share. Payments volume rose 9% and cross-border volume 14%, both in constant dollars.
Why is Visa's fiscal Q4 the same as calendar Q3 2026?
Visa's fiscal year ends on 30 September, so its fiscal fourth quarter of 2026 ran from 1 July to 30 September 2026, the same three months as calendar Q3 2026.
What is Visa's guidance for fiscal 2027?
Visa expects fiscal 2027 net revenue growth in the low double digits and adjusted EPS growth in the low double digits to low teens. Analysts expect revenue of $51.0bn, up about 11%, and EPS of $15.03.
How much does Visa return to shareholders?
In fiscal 2026 Visa bought back $20.5bn of stock and paid $5.1bn of dividends, a total of $25.6bn against free cash flow of $22.1bn. It had $24.4bn of buyback authorisation left at 30 September 2026 and raised its quarterly dividend 16% to $0.78.
What is Visa buying BioCatch for?
Visa agreed on 3 August 2026 to buy BioCatch, a fraud-intelligence company that analyses user behaviour, for $2.4bn in cash. The deal adds to Visa's risk and identity services and is expected to close by the end of fiscal Q2 2027, subject to regulatory approval.
What are client incentives at Visa?
Client incentives are payments and discounts Visa gives banks, merchants and partners to issue its cards and route payments over its network. They are deducted from gross revenue and were $18.3bn in fiscal 2026, or about 28.5% of gross revenue.
Sources
- Visa Inc., fiscal fourth quarter and full-year 2026 results (Form 8-K, Exhibit 99.1, 27 Oct 2026; accession 0001403161-26-000126) www.sec.gov
- Visa Inc., Form 8-K cover filing (27 Oct 2026; accession 0001403161-26-000126) www.sec.gov
- Visa Inc., Form 10-Q for the quarter ended 30 June 2026 (filed 29 Jul 2026; accession 0001403161-26-000104) www.sec.gov
- Visa Inc., Form 10-K for the fiscal year ended 30 September 2025 (filed 6 Nov 2025; accession 0001403161-25-000089) www.sec.gov
- SEC XBRL company facts, Visa Inc. (CIK 0001403161) data.sec.gov
- SEC EDGAR, Visa Inc. filings www.sec.gov
- Investing.com via Yahoo Finance, Visa shares fall as weak 2027 outlook overshadows fourth-quarter earnings beat (27 Oct 2026) finance.yahoo.com
- StockAnalysis, Visa (V) analyst forecasts, S&P Global data (captured 29 Oct 2026) stockanalysis.com
- Yahoo Finance chart data: V daily closes (to 30 Oct 2026) query1.finance.yahoo.com
- Aswath Damodaran, cost of capital by industry (NYU Stern, January 2026 update) pages.stern.nyu.edu
- QSILabs Visa discounted cash flow model (internal, valuation date 30 Oct 2026)
Disclaimer
This article is for information only and is not investment advice or a recommendation to buy or sell any security. The value per share is a QSILabs estimate based on public information and our own assumptions, which may be wrong. QSI Labs may hold positions in the securities discussed. Figures are as of the dates stated and will change.
More from QSI Labs
Read our white paper, QSI Labs: An AI-Native Trading Firm Built on a Training Loop (October 2026), available on request, or browse the research index.