Research / Earnings and valuation

Amazon stock Q3 2026:AWS up 39%, a record margin and a $578bn backlog
Amazon stock ends October 2026 at the centre of two arguments at once: is the AI cloud boom real, and can a retailer spend like a utility? Amazon's Q3 2026 results (July to September 2026) answered the first question loudly. AWS revenue grew 39% to $46.0bn, the operating margin hit a record 13.9%, and the AWS-led backlog reached $578bn. The second question is still open: trailing free cash flow fell to an outflow of $42.4bn. All figures in this article are as of Amazon's Q3 2026 results, reported on 29 October 2026, and share prices are as of the 30 October 2026 close of $240.35.
Key takeaways
- Fair value: the QSILabs fair value for Amazon (AMZN) is $191.16 per share as of Q3 2026 results, against a $240.35 close on 30 October 2026, about 20% lower.
- AWS: Amazon Web Services revenue grew 39% to $45,984m in Q3 2026, its fastest growth in nearly five years and the fifth quarter of acceleration in a row, at a 38.7% operating margin (Amazon 8-K, 29 October 2026).
- Backlog: Amazon's commitments not yet recognised on contracts longer than one year, mainly AWS, reached about $578bn at 30 September 2026, up from about $200bn a year earlier (Form 10-Q).
- Cash: Amazon (AMZN) trailing 12-month free cash flow was an outflow of $42.4bn at Q3 2026, after $210.7bn of net capital spending; it expects about $220bn of cash capex in 2026.
- AI stakes: Amazon carried its Anthropic stake at about $238.7bn ($92.5bn of preferred stock plus $146.2bn of convertible notes) at 30 September 2026, and had invested $50.0bn in OpenAI preferred stock in 2026 (Form 10-Q).
Amazon stock Q3 2026 in brief
Short answer: Amazon had one of the best quarters in its history, but the share price already pays for a lot of it. Our discounted cash flow fair value is $191.16 per share (a QSILabs estimate), about 20% below the $240.35 close, because roughly $220bn of capex this year and $240bn next year keep free cash flow negative until 2028 in our base case. That value already includes about $17.58 per share for the Anthropic stake.
| Key number, Q3 2026 | Value | Year on year | Source |
|---|---|---|---|
| Net sales | $201,944m | +12% | 8-K Ex 99.1 |
| Operating income | $28,076m | +61% | 8-K Ex 99.1 |
| Operating margin | 13.9% | from 9.7% | 8-K Ex 99.1 |
| Net income / EPS | $20.7bn / $1.89 | -2% / -3% | 8-K Ex 99.1 |
| AWS net sales | $45,984m | +39% | 8-K Ex 99.1 |
| AWS operating income | $17,773m | +55% | 8-K Ex 99.1 |
| Advertising services | $19,637m | +11% | 8-K Ex 99.1 |
| Backlog (AWS-led) | $578bn | 2.9x | 10-Q |
| Free cash flow, TTM | -$42.4bn | from +$14.8bn | 8-K Ex 99.1 |
| QSILabs fair value per share | $191.16 | vs $240.35 price | QSILabs estimate |
How did Amazon do in Q3 2026 compared with a year ago?
Amazon's Q3 2026 was strong on every line that it controls: net sales rose 12% to $201.9bn, operating income rose 61% to $28.1bn and the operating margin was 13.9%, the highest Amazon has ever reported. Excluding a $0.9bn currency headwind, sales grew 13%.
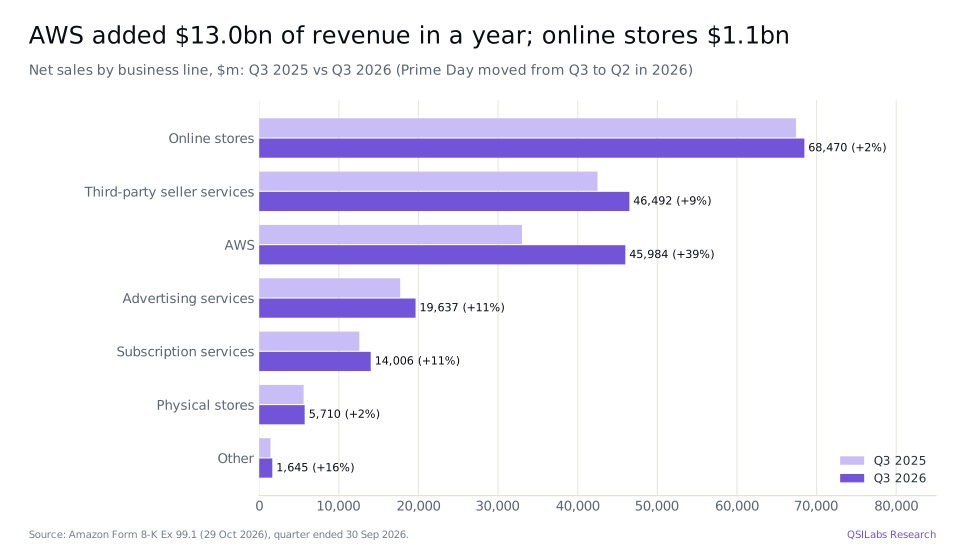
The headline growth rate understates the retail business. Prime Day, which fell entirely in the third quarter in 2025, moved into the second quarter for most large countries in 2026. That shifted sales, and some advertising, out of the July to September comparison. Online stores, the first-party retail line, grew only 2% to $68.5bn, while third-party seller services grew 9% to $46.5bn and subscriptions 11% to $14.0bn.
Net income fell 2% to $20.7bn, or $1.89 per diluted share, against $21.2bn and $1.95 a year earlier. That is not an operating problem. Q3 2025 included $9.5bn of pre-tax gains on Amazon's Anthropic investments, while other income in Q3 2026 was a loss of $703m. Operating income is the cleaner measure, and it rose by $10.7bn.
- Q1 2026OpenAI deal: $15.0bn Series C investment; AWS commitment expanded by $100bn over 8 years10-Q
- 13 Feb 202652-week closing low of $198.79Yahoo Finance
- Q2 2026Anthropic: $5.0bn Series G and AWS commitment expanded by more than $100bn over 10 years10-Q
- 3 Aug 202652-week closing high of $284.02Yahoo Finance
- 29 Oct 2026Q3 2026 results: AWS +39%, record 13.9% operating marginAmazon 8-K
- 30 Oct 2026Form 10-Q filed; shares close at $240.35SEC EDGAR; Yahoo Finance
- Q4 2026Guidance: net sales $240-247bn, operating income $28.5-33.5bnAmazon 8-K
Which Amazon segments grew fastest in Q3 2026?
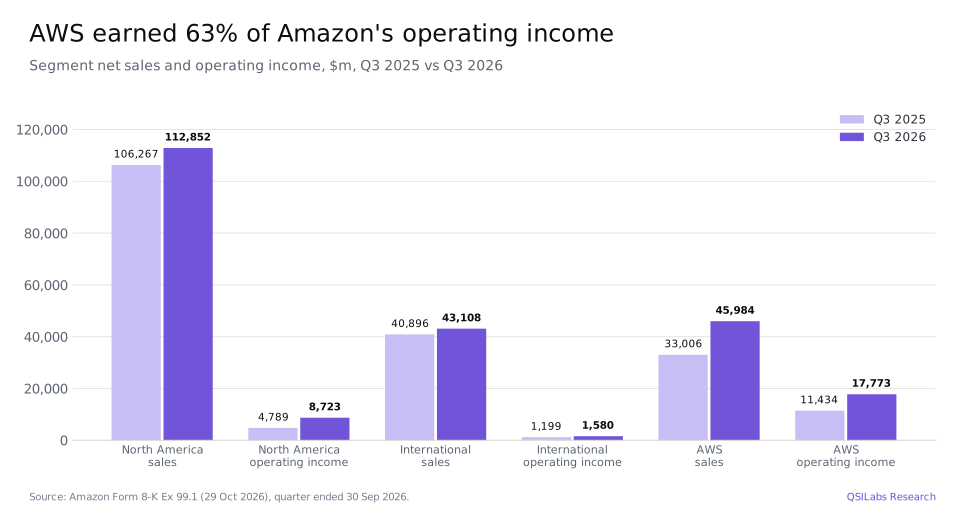
AWS was the fastest-growing and most profitable segment in Q3 2026: revenue rose 39% to $46.0bn and operating income rose 55% to $17.8bn, 63% of Amazon's total operating income from 23% of its sales. The two retail segments grew more slowly but became much more profitable.
AWS: the engine
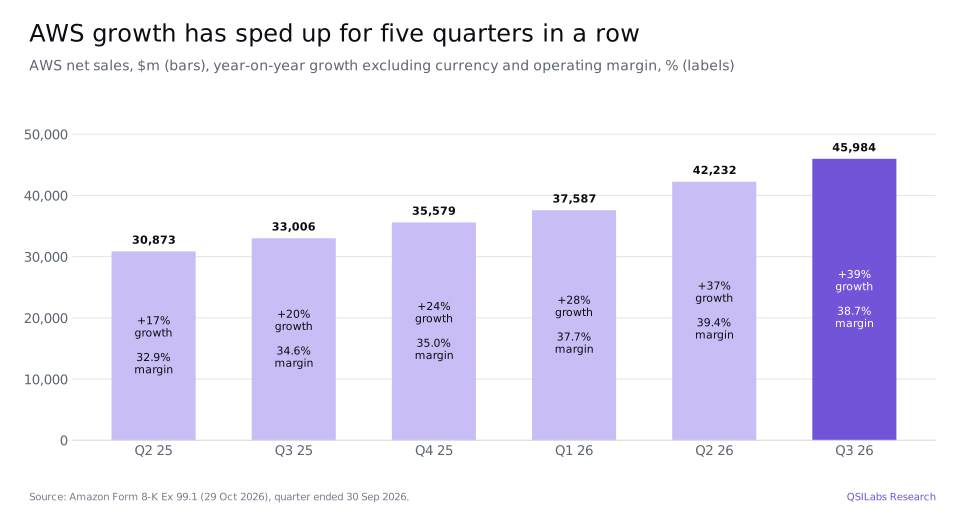
AWS revenue grew 39.3%, which Amazon called its fastest growth in nearly five years, and the business is now at a $184bn annualised revenue run rate. Growth excluding currency has risen in each of the last five quarters, from 17% in Q2 2025 to 20%, 24%, 28%, 37% and now 39%. The operating margin was 38.7%, down slightly from 39.4% in Q2 2026 but up from 34.6% a year earlier, even as depreciation on new AI capacity starts to climb.
North America and International: higher margins, slower sales
North America sales grew 6% to $112.9bn and operating income almost doubled, to $8.7bn from $4.8bn. The segment margin was 7.7%, against 4.5% a year earlier, and its trailing 12-month margin reached 8.2%. International sales grew 5% to $43.1bn (8% excluding currency), with operating income of $1.6bn against $1.2bn and a 3.7% margin.
Two things drive the retail margin. The first is advertising, which grew 11% to $19.6bn and is among Amazon's most profitable revenue, in our view; growth excluding currency slowed to 12% from 26% in Q2 because of the Prime Day timing, and Amazon expects high-teens growth in Q4 2026. The second is the mix shift towards third-party sellers and subscriptions, which earn fees rather than thin retail margins. Chief executive Andy Jassy said broader selection and faster delivery were helping Amazon "capture more retail market segment share with improving margins".
How much is Amazon spending on AI capex?
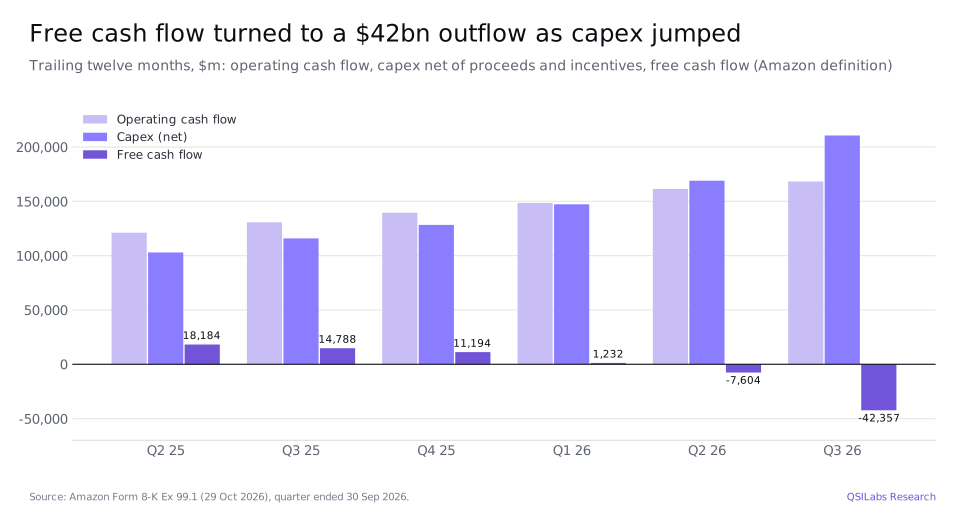
Amazon spent $77.3bn on property and equipment in Q3 2026 alone, up from $35.1bn a year earlier, and still expects about $220bn of cash capital expenditure for 2026. Over the last 12 months, purchases of property and equipment net of proceeds and incentives reached $210.7bn, up 82%, and Amazon said the increase mainly reflects investment in artificial intelligence.
Operating cash flow is growing fast too, up 29% to $168.3bn over 12 months, but not fast enough. Amazon's free cash flow, defined as operating cash flow less net capex, swung from an inflow of $14.8bn in the 12 months to September 2025 to an outflow of $42.4bn in the 12 months to September 2026. In the first nine months of 2026 Amazon bought $175.7bn of property and equipment. If the roughly $220bn guide is measured like the net capex line, it leaves about $48bn for Q4, well below Q3's $75.9bn net figure (QSILabs arithmetic, not company guidance), which would mean spending is levelling off rather than still climbing.
Balance sheet: more debt, but still modest
Amazon has been borrowing to help fund the build. Our model uses $194.4bn of total debt and $114.2bn of cash and marketable securities from Amazon's latest balance sheet, net debt of about $80bn, small against a market value of about $2.6tn (QSILabs calculation at $240.35 and 10,929m diluted shares). The 10-Q lists new notes in euros, Swiss francs, Canadian dollars and sterling issued in 2026, with a combined weighted-average remaining life of 13.9 years.
AWS, the $578bn backlog and AI: is Amazon's capex paying off?
The early evidence says yes: AWS growth has more than doubled in five quarters, its margin has risen, and contracted revenue not yet recognised has nearly tripled in a year. The open question is the return on all that capital over the life of the equipment, not whether demand exists today.
The backlog: $578bn and 6.1 years long
At 30 September 2026, Amazon's commitments not yet recognised on contracts longer than one year, primarily related to AWS, were about $578bn, with a weighted-average remaining life of 6.1 years. The same figure was about $200bn (3.8 years) at 30 September 2025, $244bn at the end of 2025, $364bn at 31 March 2026 and $496bn (6.4 years) at 30 June 2026. The quarterly addition of about $82bn is larger than AWS's revenue for the quarter.
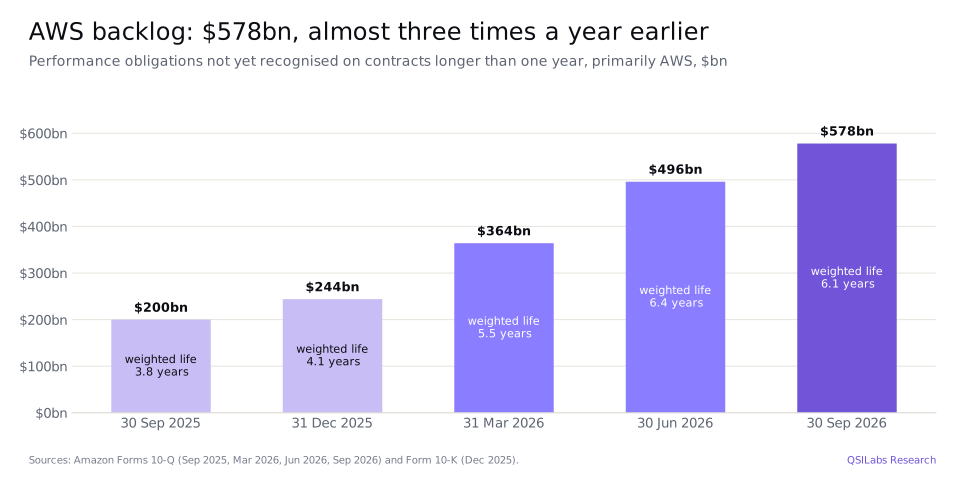
Two customers explain much of that growth, in our view. In Q1 2026 AWS expanded its existing $38.0bn commitment with OpenAI by $100.0bn over eight years, and in Q2 2026 it expanded its Anthropic commitment by more than $100.0bn over ten years; both include obligations tied to the performance of AWS chips. Amazon also lists new AWS agreements this quarter with Meta, NVIDIA, OpenAI, Salesforce, Oracle and others, and says Bedrock token volume grew nearly 17 times year on year.
Management's 2027 and 2028 AWS outlook
Andy Jassy said AWS had "projected revenue growth rates of over 40% both in 2027 and in 2028". That is unusually explicit for Amazon. Our base case takes the 2027 figure at face value, 40%, but we fade growth to 25% in 2028 and 20% in 2029. We do that because a projection two years out depends on capacity being built on time and on AI customers who are themselves raising money to pay their bills.
As a top-down check, AWS revenue of about $175bn in 2026 is roughly 21% of the roughly $850bn of public cloud spending Gartner forecasts for 2026. Our path takes AWS to about $368bn in 2029, about 25% of Gartner's $1.48tn forecast for that year. A share gain is plausible given the backlog, but it is not small. If AWS really does grow by more than 40% in 2028 as well, our fair value would be too low; that is the biggest single upside risk to our view.
Anthropic and OpenAI: what are Amazon's AI stakes worth?
Amazon's two biggest AI investments were carried at well over $250bn at 30 September 2026, and they now move Amazon's reported profit more than many of its businesses. They matter to the valuation, but they are hard to value precisely because both companies are private.
Anthropic
From Q3 2023 to Q4 2025 Amazon invested $8.0bn in Anthropic convertible notes, and in the first nine months of 2026 it invested a further $10.0bn in Anthropic nonvoting preferred stock, including $5.0bn of Series G in Q2. At 30 September 2026 the preferred stock was carried at about $92.5bn (164 million shares, each convertible into ten common shares), and the notes at a fair value of about $146.2bn, with an unrealised gain of $140.3bn in other comprehensive income. Amazon has also agreed a financing facility of up to $20.0bn for Anthropic, expiring 30 months after an Anthropic IPO or other liquidity event.
We include the stake in our valuation at about $192.2bn after tax, or $17.58 per share. That is the $238.7bn carrying value less tax on the unrealised gain. These are Level 3 marks based on Anthropic's funding rounds, not market prices, so they could move a lot in either direction. For our view of the company itself, see our Anthropic IPO analysis: the economics of an AI lab.
OpenAI
In 2026 Amazon invested $50.0bn in OpenAI Series C preferred stock: $15.0bn in Q1, $13.7bn in Q2 and $21.3bn in Q3. Alongside it, OpenAI expanded its AWS commitment and agreed to make certain services using OpenAI models available on AWS. We do not add the OpenAI stake to our equity bridge; at its $50.0bn cost it would add about $4.6 per share before any tax (QSILabs arithmetic). Microsoft is the other big cloud investor in OpenAI; we compare the two in our Microsoft stock Q3 2026 analysis.
What does Amazon's guidance say for Q4 2026?
Amazon guided Q4 2026 net sales of $240.0bn to $247.0bn, growth of 12% to 16%, and operating income of $28.5bn to $33.5bn against $25.0bn in Q4 2025. The guidance assumes a currency headwind of about 60 basis points.
The midpoint, $243.5bn of sales and $31.0bn of operating income, would be a 12.7% operating margin in the holiday quarter, which carries heavy fulfilment costs. Amazon also expects advertising growth to return to the high teens in Q4 and reiterated about $220bn of 2026 cash capex. It plans to hire more than 300,000 seasonal, part-time and full-time staff in the US for the holidays.
Beyond Q4, Amazon flagged three newer businesses. Amazon Leo, its low Earth orbit satellite service, remains on track to begin initial service later this year, with AT&T signed as the first major US telecom provider to offer Leo connectivity to business and public-sector customers. Zoox began paid robotaxi rides in Las Vegas and is now operating in 12 US cities. Jassy said "there has never been a trillion dollar revenue business, and we may have two of them in the next 5-10 years". We see a similar AI-and-capex tension in our Alphabet Q3 2026 analysis.
What is Amazon's fair value? AMZN valuation after Q3 2026
The QSILabs fair value for Amazon (AMZN) stock is $191.16 per share as of 30 October 2026, about 20% below the $240.35 close. That is not a 12-month price target. It is what we think Amazon's future cash flows, plus its Anthropic stake, are worth today, and at $240.35 the shares trade about 26% above it.
Method
QSILabs values Amazon with a discounted cash flow model built segment by segment (North America, International and AWS). We discount unlevered free cash flow (operating profit after tax, plus depreciation, less capex and working capital) for 2026 to 2035, then add a terminal value. The discount rate is 8.4%, the Damodaran cost of capital for US general retail (January 2026): a cost of equity of 8.71% from a 5.12% Treasury yield, an industry beta of 0.81 and a 4.46% equity risk premium, with 7.4% debt in the capital structure at an after-tax cost of 4.68%. A bottom-up cross-check with Amazon's own beta gives a higher 9.8%, which would put fair value below $160. Terminal growth is 2.5%, with reinvestment set by a 15% return on new capital, and the tax rate is 19%. We then add cash, deduct debt and add the Anthropic stake after tax.
Our forecast
Our base case starts from the reported first nine months of 2026 plus the midpoint of Q4 guidance, which gives 2026 net sales of $827.6bn, up 15.4%. For 2027 we use $950.0bn, in line with the compiled analyst consensus of $949.99bn on 29 October 2026 (Equibles), with AWS at +40% and retail growth of about 8% making up the rest. Growth then slows to 12% in 2028 and about 5% by 2035, when revenue reaches $1,737.6bn. AWS rises from 18% of revenue in 2025 to 37% in 2035.
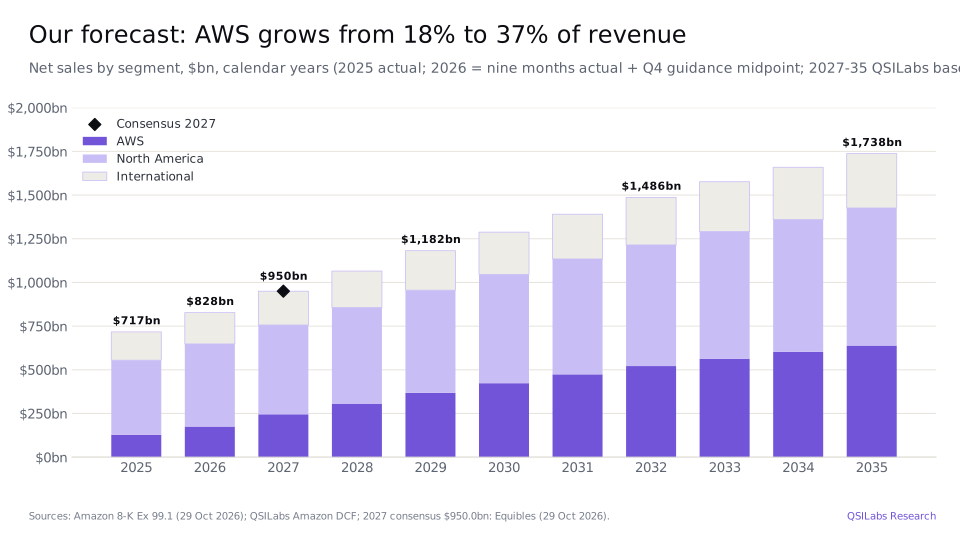
The operating margin rises from 13.3% in 2026 to 14.2% in 2027 and about 15.6% from 2031, a QSILabs estimate. That is lower than the 13.9% Q3 margin might suggest, for two reasons. We assume AWS margins drift down from 38.7% to about 32% as AI depreciation catches up with revenue, and we hold the North America margin close to 7.5-8%. Our 2027 operating profit is about 7% below the level implied by consensus earnings per share of $10.55.
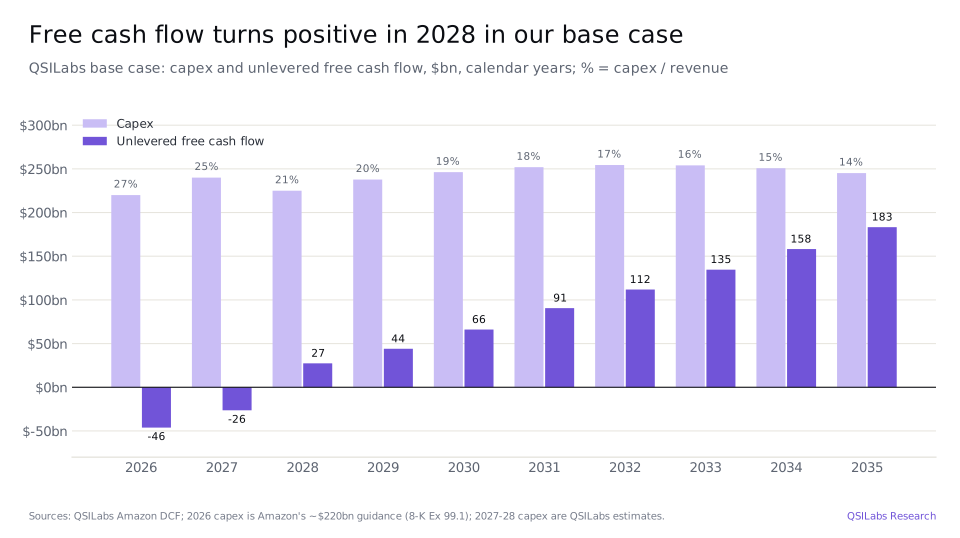
Capex is the swing factor. We use Amazon's ~$220bn for 2026, then $240bn in 2027 and $225bn in 2028 (QSILabs estimates), before capex falls to 14% of revenue by 2035. On that path unlevered free cash flow is minus $46bn in 2026 and minus $26bn in 2027, turns positive at $27bn in 2028 and reaches $183bn in 2035.
Football field
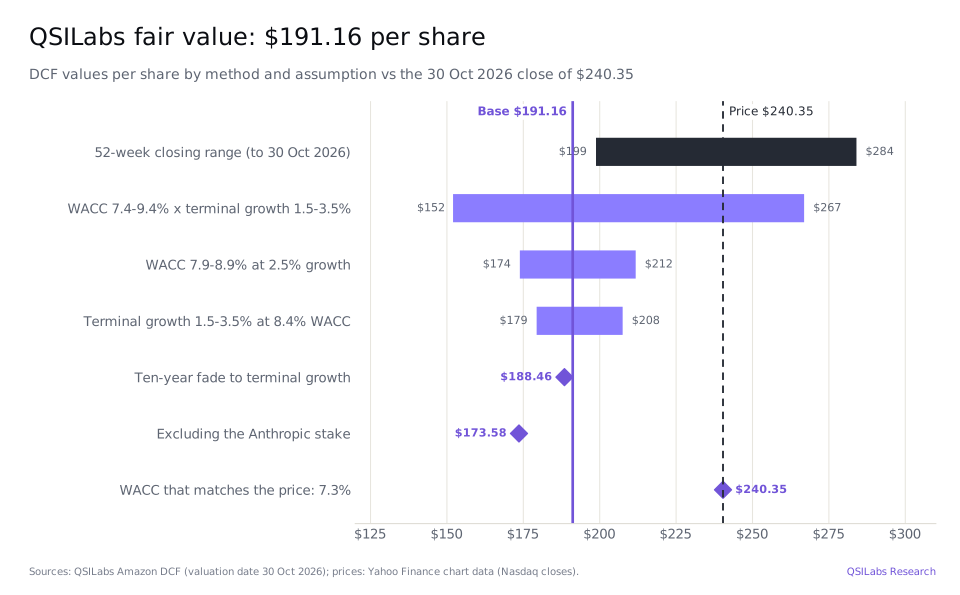
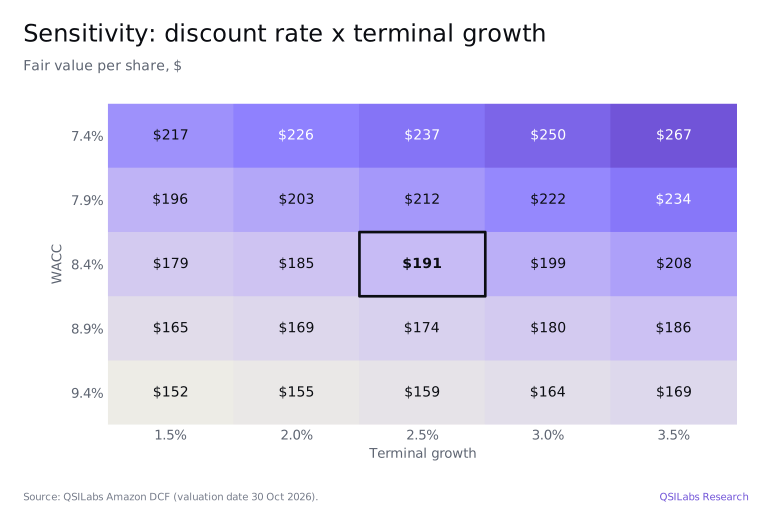
Most reasonable inputs put Amazon's fair value between about $152 and $267 per share, and the central cases sit around $174 to $212. The enterprise value is $1,977bn, of which the terminal value is 77%, so the long-run assumptions dominate. Excluding the Anthropic stake, the value is $173.58 per share; a ten-year fade to terminal growth, our two-stage check, gives $188.46. To justify $240.35 with our cash flows, investors have to accept a discount rate of about 7.35%, roughly one point below the retail industry's cost of capital.
Sensitivity
Fair value is most sensitive to the discount rate. A one-point lower WACC, 7.4%, raises the base to about $237 a share, close to the price; a one-point higher WACC, 9.4%, cuts it to about $159. Moving terminal growth from 1.5% to 3.5% at our 8.4% WACC moves the value from $179 to $208.
Is Amazon stock undervalued after Q3 2026?
Amazon (AMZN) stock does not look undervalued after Q3 2026: at $240.35 it trades about 26% above the QSILabs fair value of $191.16 per share. It is closer to fair value than some of its big-tech peers, though, and a modest change in assumptions closes the gap.
The case for paying up is strong. AWS is accelerating at a $184bn run rate, backed by a $578bn backlog, retail margins are at record levels, and the Anthropic stake alone is worth about $17.58 a share on its carrying value. If management's "over 40%" AWS growth in 2028 proves right, or capex falls faster than we assume, the value rises quickly. The case against is the bill. Amazon is spending more than its operating cash flow, its free cash flow will be negative for at least two years in our base case, and much of its backlog comes from AI labs that depend on outside funding. The shares are about 15% below their 52-week closing high of $284.02 (3 August 2026) and 21% above the low of $198.79 (13 February 2026).
What are the biggest risks for Amazon stock?
The biggest risks for Amazon (AMZN) stock are AI capex that fails to earn its cost of capital, concentration of the AWS backlog in a few AI customers, and valuation marks on private AI stakes that could reverse.
- Capex without returns. About $220bn of capex in 2026 and more planned in our base case would lower returns on capital for years if AI pricing falls faster than costs, and short-lived servers and chips need replacing sooner than buildings.
- Customer concentration. OpenAI and Anthropic each committed $100bn or more of new AWS spending in 2026. Both are loss-making and rely on new funding rounds, partly from Amazon itself.
- Level 3 marks. About $238.7bn of Anthropic value and $50.0bn of OpenAI stock are carried using funding-round prices, not market prices. A down round would cut both reported profit and our equity bridge.
- Retail and regulation. Online store growth was only 2% in Q3 and International margins remain thin, at 3.7%. Antitrust and labour rules can raise costs in the retail business.
- Supply and power. AWS growth depends on chips, data centre space and electricity arriving on time; delays would cap growth.
- Upside risk to our view. AWS growth of more than 40% in both 2027 and 2028, as Amazon projects, or a faster fall in capex, would lift our value. A one-point lower discount rate adds about $45 to our fair value.
Amazon stock FAQ
What is Amazon's fair value after Q3 2026?
The QSILabs fair value for Amazon (AMZN) is $191.16 per share as of Q3 2026 results, against a $240.35 close on 30 October 2026, about 20% lower. It comes from a discounted cash flow model with an 8.4% discount rate and 2.5% terminal growth, and includes $17.58 per share for the Anthropic stake; reasonable alternatives give about $152 to $267 a share.
Is Amazon stock a buy after Q3 2026 earnings?
On our numbers Amazon stock looks expensive rather than cheap: the $240.35 price is about 26% above our $191.16 fair value. It would look fairly priced at a discount rate of about 7.35%, or if AWS keeps growing at over 40% in 2028 as management projects. This is not investment advice.
How fast did AWS grow in Q3 2026?
AWS revenue grew 39% year on year to $45,984m in Q3 2026, its fastest growth in nearly five years, with an operating margin of 38.7% and a $184bn annualised run rate. Growth excluding currency has risen for five straight quarters, from 17% in Q2 2025.
How much is Amazon spending on AI data centres?
Amazon bought $77.3bn of property and equipment in Q3 2026, up from $35.1bn a year earlier, and expects about $220bn of cash capex in 2026, mainly for AI. Its trailing 12-month net capex was $210.7bn, which turned free cash flow into a $42.4bn outflow.
How big is the AWS backlog after Q3 2026?
Amazon's commitments not yet recognised on contracts longer than one year, primarily AWS, were about $578bn at 30 September 2026, with a weighted-average remaining life of 6.1 years. That compares with about $496bn at 30 June 2026 and about $200bn at 30 September 2025.
How much is Amazon's stake in Anthropic worth?
Amazon carried its Anthropic stake at about $238.7bn at 30 September 2026: about $92.5bn of nonvoting preferred stock and about $146.2bn of convertible notes at fair value. After tax on the unrealised gain, QSILabs values it at about $192.2bn, or $17.58 per Amazon share.
Why did Amazon's net income fall in Q3 2026 when operating income rose 61%?
Amazon's Q3 2026 net income fell 2% to $20.7bn because Q3 2025 included $9.5bn of pre-tax gains on its Anthropic investments, while other income in Q3 2026 was a $703m loss. Operating income, which excludes those gains, rose 61% to $28.1bn.
What is Amazon's Q4 2026 guidance?
Amazon expects Q4 2026 net sales of $240.0bn to $247.0bn, up 12% to 16%, and operating income of $28.5bn to $33.5bn, against $25.0bn in Q4 2025. It also expects high-teens advertising growth in Q4 and about $220bn of cash capex for 2026.
Sources
- Amazon.com, Inc., Q3 2026 earnings release (Form 8-K, Exhibit 99.1, 29 Oct 2026) www.sec.gov
- Amazon.com, Inc., Form 10-Q for the quarter ended 30 September 2026 (filed 30 Oct 2026) www.sec.gov
- Amazon.com, Inc., Form 10-Q for the quarter ended 30 June 2026 www.sec.gov
- Amazon.com, Inc., Form 10-K for the year ended 31 December 2025 www.sec.gov
- Amazon Investor Relations, quarterly results ir.aboutamazon.com
- SEC EDGAR, Amazon.com, Inc. filings (CIK 0001018724) www.sec.gov
- Gartner, Forecast: public cloud services, worldwide (3Q25 update) www.gartner.com
- Equibles, Amazon (AMZN) compiled analyst consensus estimates (captured 29 Oct 2026) equibles.com
- Yahoo Finance chart data: AMZN daily closes (to 30 Oct 2026) query1.finance.yahoo.com
- Aswath Damodaran, cost of capital by industry (NYU Stern, January 2026 update) pages.stern.nyu.edu
- QSILabs Amazon discounted cash flow model (internal, valuation date 30 Oct 2026)
Disclaimer
This article is for information only and is not investment advice or a recommendation to buy or sell any security. Fair values, forecasts and scenarios are QSILabs estimates based on public information and our own assumptions, and they may be wrong. Reported figures come from Amazon's Form 8-K and Form 10-Q; prices are as of the 30 October 2026 close. QSI Labs may hold positions in securities mentioned. For more of our work, see the QSI Labs research index.
More from QSI Labs
Read our white paper, QSI Labs: An AI-Native Trading Firm Built on a Training Loop (October 2026), available on request, or browse the research index.