Research / Earnings and valuation
ExxonMobil Stock Q3 2026:Refining Margins Double Earnings to $15.4bn
As of: Figures are as of ExxonMobil Holdings Corporation's Q3 2026 results (quarter ended 30 September 2026, reported 30 October 2026) and its Form 10-Q for the quarter, filed 2 November 2026. The share price is the NYSE close of XOM on 30 October 2026, $187.25. Published 2 November 2026.
The short answer. ExxonMobil stock Q3 2026 results were the strongest in years: earnings doubled to $15.4bn from $7.5bn a year earlier because refining margins nearly doubled in a quarter, even though oil prices eased. Adjusted EPS was $4.23, free cash flow was $19.1bn and ExxonMobil promised $20bn of buybacks for 2027. Our discounted cash flow model puts ExxonMobil at $168.66 per share, about 10% below the $187.25 close on 30 October 2026: the market is pricing today's margins as if they last, and our model does not.
ExxonMobil's third quarter of 2026 was a refining quarter. Energy Products, the fuels business, earned $7.17bn against $1.84bn a year earlier, as the company's indicative refining margin rose to $50.3 a barrel from $29.0 in the second quarter (ExxonMobil Q3 2026 earnings release). Total earnings were $15.41bn, or $3.72 a share, and $17.51bn, or $4.23 a share, after excluding identified items and timing effects. The shares rose 2.2% on results day, from $183.29 to $187.25 (Yahoo Finance).
In this article we go through ExxonMobil's Q3 2026 numbers against a year earlier and the previous quarter, segment by segment, why refining margins spiked, production and the Middle East disruption, cash flow, buybacks and the dividend, and our valuation of XOM, with the assumptions laid out so you can argue with them.
Key takeaways
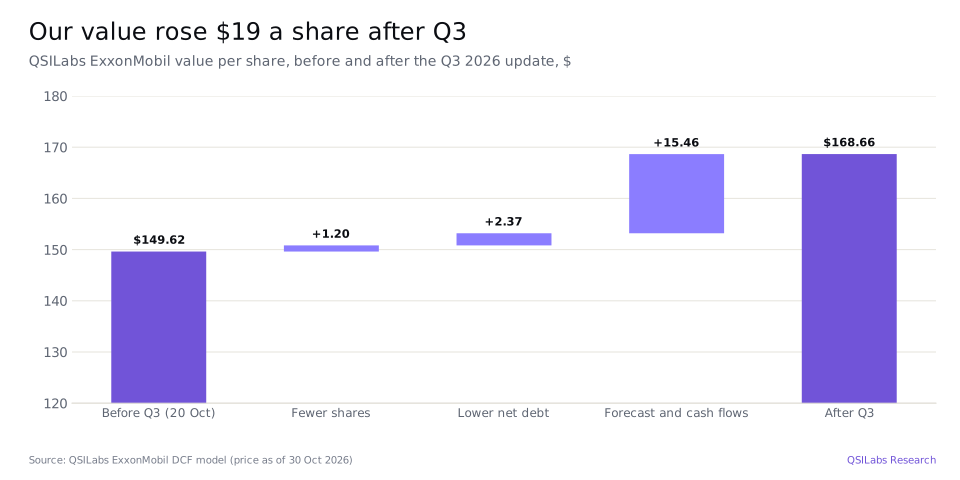
- Valuation: QSILabs values ExxonMobil Holdings Corporation (NYSE: XOM) at $168.66 per share as of Q3 2026, against a $187.25 close on 30 October 2026, about 10% below the market price. Our value was $149.62 before the quarter.
- Q3 2026 results: earnings were $15.41bn ($3.72 a share) in the quarter ended 30 September 2026, against $7.55bn ($1.76) a year earlier; adjusted earnings were $17.51bn ($4.23 a share).
- Refining: Energy Products earned $7.17bn, up from $1.84bn, on an indicative refining margin of $50.3 a barrel; higher margins added $7.66bn to the segment's earnings.
- Production: output was 4.50 million oil-equivalent barrels a day, down from 4.77 million a year earlier, as Middle East and Kazakhstan disruptions took volumes away and cost Upstream $860m of earnings in the quarter.
- Cash and returns: operating cash flow was $25.7bn and free cash flow $19.1bn in Q3; ExxonMobil paid $4.3bn of dividends and bought back $5.1bn of stock, and plans $20bn of buybacks in 2027.
- Balance sheet: net debt fell to $22.1bn at 30 September, nearly $11bn lower than at the start of the year.
Key numbers from ExxonMobil's Q3 2026 earnings
| Q3 2026 vs Q3 2025, $m | Q3 2025 | Q3 2026 | Change |
|---|---|---|---|
| Sales and other operating revenue | 83,331 | 110,503 | +33% |
| Total revenues and other income | 85,294 | 113,164 | +33% |
| Crude oil and product purchases | 47,928 | 65,724 | +37% |
| Depreciation and depletion | 6,475 | 6,803 | +5% |
| Income before tax | 10,932 | 21,236 | +94% |
| Earnings (U.S. GAAP) | 7,548 | 15,413 | +104% |
| Earnings per share ($) | 1.76 | 3.72 | +111% |
| Weighted-average diluted shares (m) | 4,285 | 4,140 | -3% |
| Oil-equivalent production (koebd) | 4,769 | 4,496 | -6% |
Source: ExxonMobil 3Q26 investor relations data summary and Form 10-Q (accessions 0002115436-26-000018 and 0002115436-26-000020). Cash capital expenditures were $7.0bn in Q3 2026, $1.6bn lower than a year earlier.
ExxonMobil Q3 2026 earnings: what happened
ExxonMobil doubled its earnings in a quarter when oil got cheaper. Brent averaged $97.01 a barrel in Q3, down from $104.52 in Q2, but the margin for turning crude into diesel, gasoline and jet fuel jumped. Chairman and CEO Darren Woods said: "Quarter after quarter, the evidence of a stronger business builds. We're improving both the quality of our portfolio and the ability to optimize around it. Advantaged investments, technology, and $16.9 billion in structural cost savings since 2019 are expanding our earnings power. These are lasting improvements, not simply the result of favorable prices and margins."
Against the second quarter, reported earnings rose $888m to $15.41bn and adjusted earnings rose $2.83bn to $17.51bn. The gap between the two measures is large this quarter. Derivative mark-to-market losses, which ExxonMobil reports as timing effects, cut earnings by an estimated $2.54bn in Q3 and $3.94bn in the first nine months; those losses reverse as the physical cargoes they hedge are delivered. Identified items, mainly asset-sale gains in Upstream, added a net $448m to Upstream's reported earnings.
For the first nine months of 2026, earnings were $34.12bn ($8.18 a share) against $22.34bn ($5.16) a year earlier, and adjusted earnings were $40.96bn ($9.82 a share) against $22.46bn. The effective tax rate was 26% in Q3.
The quarter was also ExxonMobil's first under a new parent company. On 1 July 2026 the group completed a redomicile into ExxonMobil Holdings Corporation, incorporated in Texas, which kept the XOM ticker and files with the SEC under a new filer number. The transaction cancelled treasury shares and had no effect on total equity.
- 1 Jul 2026Redomicile completed: ExxonMobil Holdings Corporation, incorporated in Texas, becomes the listed company under the XOM tickerForm 10-Q
- Q3 2026Guyana and Kearl each pass 1 billion barrels of cumulative production; PNG LNG passes 100 million tons8-K Ex 99.1
- Q3 2026Assumes operatorship of Papua LNG and agrees to raise its stake to 34%; agrees to raise its Rovuma LNG stake in Mozambique to 50%8-K Ex 99.1
- Q3 2026Carbon capture starts up at Nucor; the Rose carbon storage project is approved8-K Ex 99.1
- 30 Oct 2026Q3 2026 results; $20bn of buybacks announced for 2027; XOM closes at $187.25, up 2.2%8-K Ex 99.1; Yahoo Finance
- 2 Nov 2026Form 10-Q for the quarter filedSEC EDGAR
- 10 Dec 2026Q4 dividend of $1.07 a share payable to holders of record on 16 November8-K Ex 99.1
How did each ExxonMobil segment do in Q3 2026?
Upstream: oil and gas production
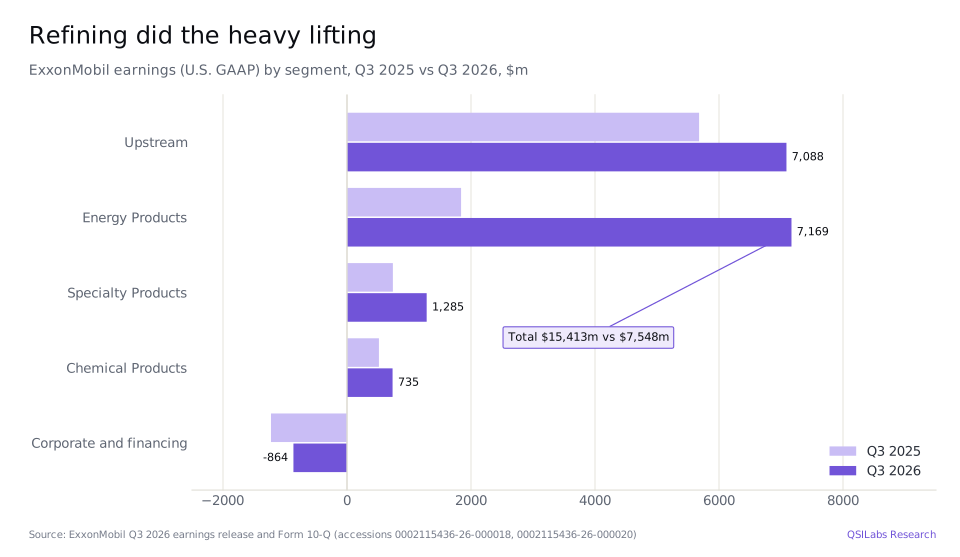
Upstream earned $7.09bn, up from $5.68bn a year earlier and down from $7.93bn in Q2. Against a year earlier, higher crude and gas prices added $3.68bn, while Middle East disruption took away $860m of volume, base volumes another $200m, higher depreciation $590m, the absence of one-time tax items $470m and derivative timing effects $720m (Form 10-Q). Against Q2, earnings fell on lower prices and a faster reduction in ExxonMobil's entitlement to Guyana barrels, which shrinks as cost recovery completes. Adjusted Upstream earnings were $7.31bn.
Energy Products: fuels refining
Energy Products earned $7.17bn, against $1.84bn a year earlier and $5.47bn in Q2; adjusted, it earned $9.05bn, more than double Q2's $4.10bn. The US business alone earned $4.79bn. ExxonMobil ran its US Gulf Coast refineries at 100% crude unit utilisation and had its second-highest Gulf Coast diesel production on record, and it says its Beaumont expansion has helped lift distillate output by about 40% since 2019.
Chemical Products and Specialty Products
Chemical Products earned $735m, up from $515m a year earlier on a larger North American ethane feed advantage, but down from $1.13bn in Q2 as North American polyethylene prices fell to $998 a tonne from $1,454. Specialty Products, which makes lubricants and basestocks, earned $1.29bn, up from $740m a year earlier and $956m in Q2, on higher basestock margins. Corporate and financing costs were $864m.
Why were ExxonMobil's refining margins so high?
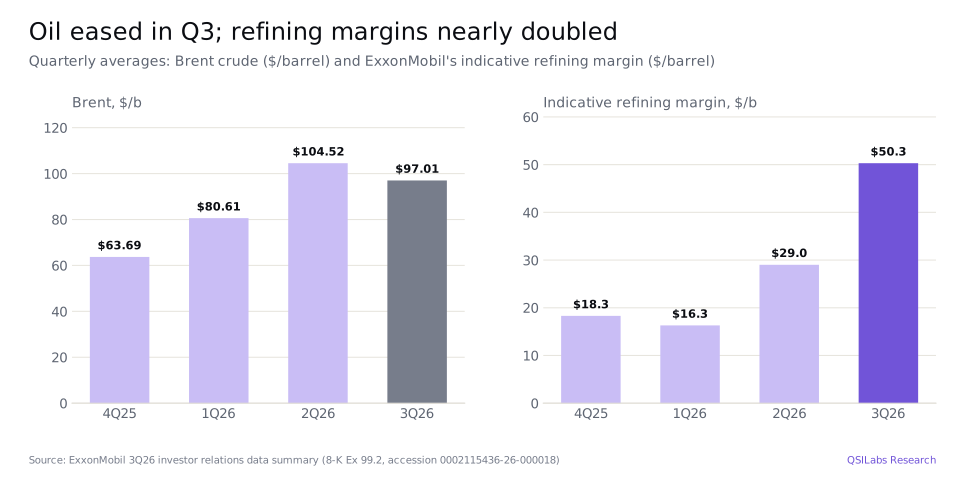
Refining margins rose because fuel supply was tight while crude was falling. ExxonMobil's indicative refining margin, based on Platts data, averaged $50.3 a barrel in Q3, against $29.0 in Q2, $16.3 in Q1 and $18.3 in Q4 2025 (3Q26 data summary). Disruption in the Middle East tightened global fuel supply and affected ExxonMobil's own operations there. Refiners with running capacity elsewhere, especially on the US Gulf Coast, captured the spread: ExxonMobil's US refineries processed 1.94 million barrels a day in Q3, up from 1.91 million in Q2.
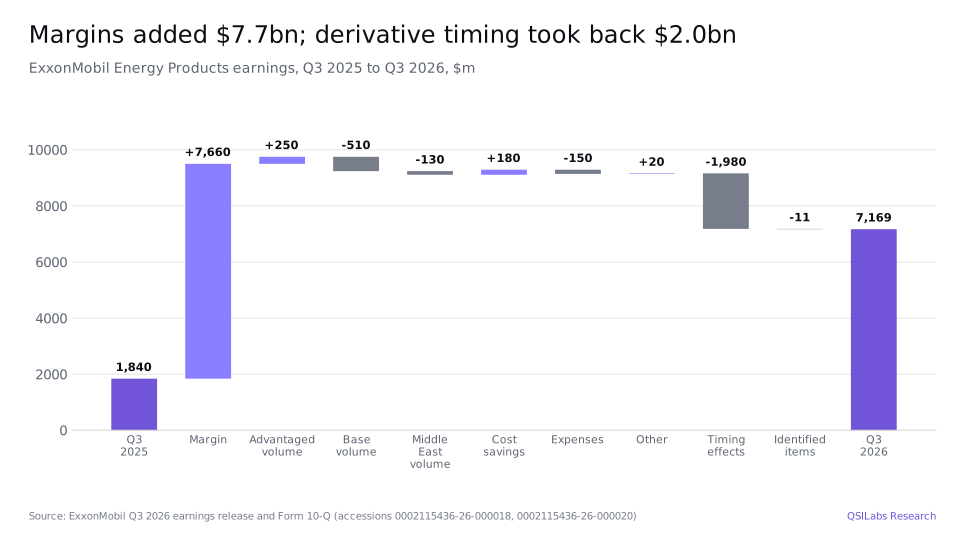
The waterfall shows how much of the quarter came from the market. Of the $5.33bn increase in Energy Products earnings against a year earlier, margins contributed $7.66bn; ExxonMobil's own levers, advantaged volume growth of $250m and structural cost savings of $180m, were real but much smaller. Base volume took away $510m and Middle East volume $130m. ExxonMobil sold 5.75 million barrels a day of energy products, about the same as a year earlier, and processed 3.74 million barrels a day of crude, down from 4.11 million.
That matters for investors. A refining margin of $50 a barrel is far above the $16-29 range of the previous three quarters. If margins fall back, Energy Products earnings fall back with them, and our model assumes they do.
What happened to ExxonMobil's oil and gas production?
ExxonMobil produced 4.50 million oil-equivalent barrels a day in Q3 2026, 273,000 fewer than a year earlier and 18,000 fewer than in Q2. Liquids production was 3.28 million barrels a day and gas 7.30 billion cubic feet a day. The decline against a year earlier came from the Middle East and Kazakhstan disruptions and lower Guyana entitlement volumes, partly offset by growth in the Permian Basin and Guyana. Asian gas production, where ExxonMobil's Middle East LNG volumes sit, fell to 1.69 billion cubic feet a day from 3.16 billion.
The long-run assets kept growing. US liquids production rose to 1.63 million barrels a day from 1.51 million, and US gas to 3.87 billion cubic feet a day from 3.44 billion. Guyana and Kearl in Canada each passed 1 billion barrels of cumulative production in the quarter, and PNG LNG passed 100 million tons. ExxonMobil also took over as operator of Papua LNG, agreed to raise its stake there to 34% and agreed to raise its stake in Rovuma LNG in Mozambique, which it already operates, to 50%.
Realised prices were lower than in Q2: ExxonMobil's US crude realisation was $84.82 a barrel against $97.58, and its non-US gas realisation $13.92 per thousand cubic feet against $13.96.
How much cash does ExxonMobil make? Cash flow, buybacks and the dividend
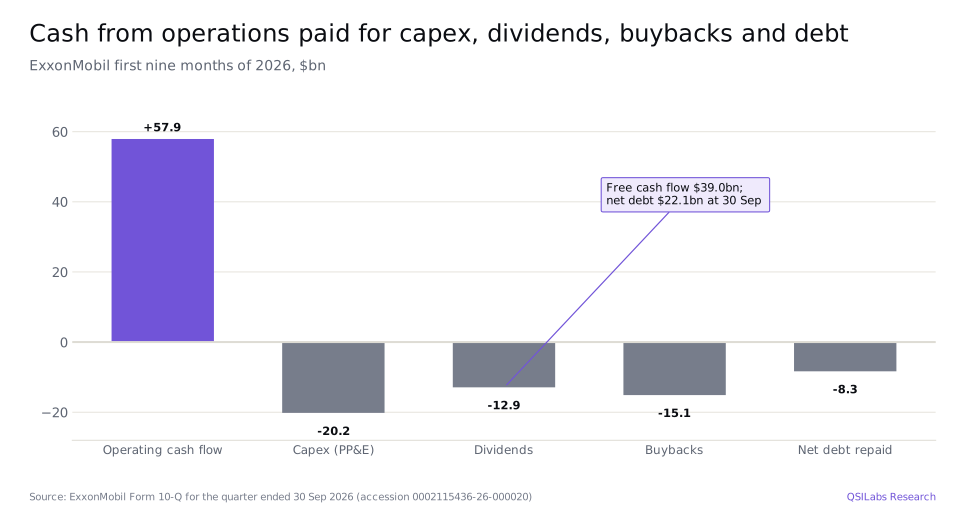
ExxonMobil generated $25.7bn of operating cash flow and $19.1bn of free cash flow in Q3. In the first nine months of 2026 operating cash flow was $57.91bn against $39.29bn a year earlier, additions to property, plant and equipment were $20.18bn and free cash flow, on ExxonMobil's definition, was $39.04bn against $20.57bn (Form 10-Q). Cash capital expenditures were $7.00bn in Q3 and $19.98bn in nine months, $1.2bn less than in the same period of 2025.
ExxonMobil paid $12.90bn of dividends and bought back $15.11bn of stock in nine months, and the share count fell to 4,079 million at 30 September from 4,179 million at the end of 2025. It also repaid debt: total debt fell to $34.25bn from $43.54bn, and with $12.15bn of cash, net debt was $22.1bn. Total equity was $272.5bn.
ExxonMobil's dividend and buybacks
ExxonMobil declared a Q4 dividend of $1.07 a share, payable on 10 December 2026 to holders of record on 16 November, up from the $1.03 paid in Q3. The company says 2026 was its 44th consecutive year of higher annual dividends per share. It announced $20bn of share repurchases for 2027, assuming reasonable market conditions. At $187.25 a share, the annualised dividend of $4.28 yields 2.3%, and $20bn of buybacks is about 2.6% of a market value of about $764bn.
ExxonMobil stock Q3 2026: is XOM overvalued?
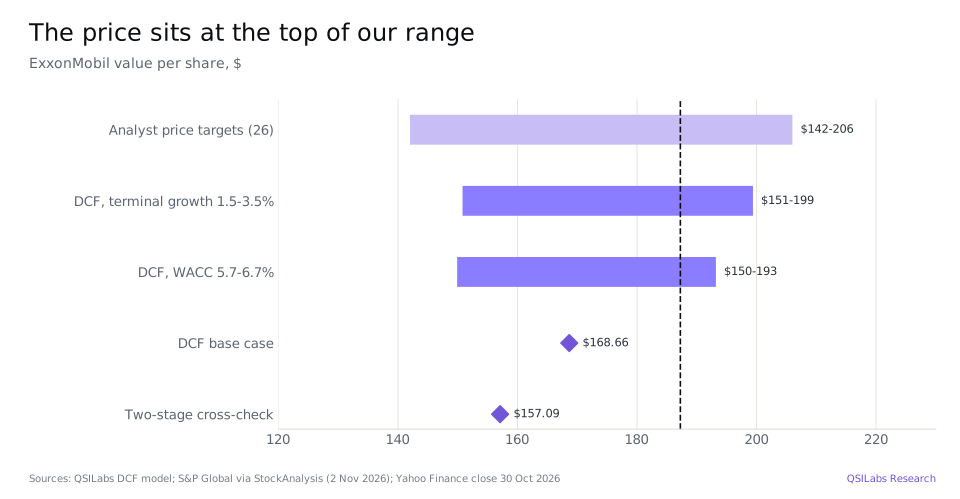
Modestly, on our numbers. We value ExxonMobil at $168.66 a share, about 10% below the $187.25 close on 30 October 2026; put the other way, the stock trades about 11% above our value. A simpler two-stage cross-check gives $157.09. Analysts are closer to the price: 26 analysts have an average price target of $182.05 and a median of $185, with a range of $142 to $206 and a consensus rating of Buy, although 17 of the 26 rate it Hold (S&P Global via StockAnalysis, 2 November 2026). Consensus expects adjusted EPS of $13.69 in 2026, falling to $12.01 in 2027, which puts XOM on 13.7 times 2026 earnings and 15.6 times 2027 earnings.
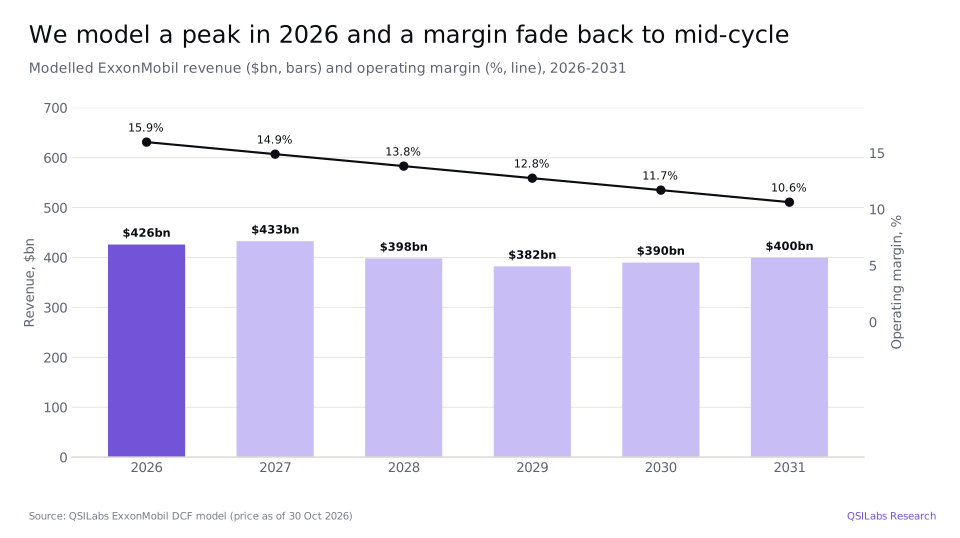
The gap is about how long the margins last. The market price implies that something like the 2026 earnings level holds; our model fades ExxonMobil's operating margin from 15.9% in 2026 to 10.6% by 2031, back towards mid-cycle levels.
Method
We value ExxonMobil with a discounted cash flow model. Revenue, operating margin, tax, capital spending, depreciation and working capital are forecast year by year to 2035, and free cash flow is discounted at a WACC of 6.21%, Damodaran's cost of capital for US integrated oil and gas companies. Terminal growth is 2.5%, and the terminal value is 63.1% of enterprise value. From enterprise value we subtract net debt of $22.1bn and minority interests of $21.3bn: Imperial Oil's outside shareholders are valued at market, $19.9bn at Imperial's 30 October share price, plus $1.4bn of other noncontrolling interests (Imperial Oil 10-Q). We divide by the 4,079 million shares outstanding at 30 September.
Our main assumptions:
- 2026: revenue of $425.95bn, in line with consensus: $314.32bn booked in nine months and about $111.6bn in Q4. Operating profit of $67.9bn, with Q4 below Q3 as refining margins normalise.
- 2027: revenue up 1.6% to $432.8bn, matching consensus, at an operating margin of 14.9%, below the roughly 15% implied by consensus 2027 EPS.
- 2028-2029: revenue down 8% and then 4% as commodity prices and refining margins revert, to $382.2bn in 2029, with margin falling to 12.7%.
- 2030 onwards: revenue grows 2-2.5% a year and operating margin settles at 10.6%.
- Capital spending: $27bn in 2026 ($20.2bn in nine months plus about $7bn in Q4), with a tax rate of 25.7% and working capital at 2.3% of revenue.
Unlevered free cash flow is $54.3bn in 2027, falling to $40.7bn in 2029 and $32.2bn in 2031.
| Value bridge | $bn | Per share ($) |
|---|---|---|
| Present value of free cash flow, 2026-2035 | 269.8 | 66.14 |
| Present value of terminal value | 461.5 | 113.15 |
| Enterprise value | 731.4 | 179.29 |
| Less net debt (debt $34.3bn less cash $12.2bn) | -22.1 | -5.42 |
| Less minority interests (Imperial Oil at market and other) | -21.3 | -5.21 |
| Equity value | 688.0 | 168.66 |
Source: QSILabs DCF model; balance sheet from the Q3 2026 Form 10-Q; 4,079 million shares.
How the number moves if you argue with us
The discount rate and terminal growth matter more here than for a fast grower, because most of the value sits in the terminal year. A WACC half a point lower, 5.71%, gives $193.20 a share, above the price; half a point higher, 6.71%, gives $149.90. At our 6.21% WACC, terminal growth of 1.5% gives $150.80 and 3.5% gives $199.40.
| WACC \ terminal growth | 1.5% | 2.0% | 2.5% | 3.0% | 3.5% |
|---|---|---|---|---|---|
| 5.21% | 189.8 | 205.4 | 226.8 | 257.7 | 306.7 |
| 5.71% | 168.0 | 178.9 | 193.2 | 212.7 | 241.0 |
| 6.21% | 150.8 | 158.7 | 168.7 | 181.7 | 199.4 |
| 6.71% | 136.9 | 142.7 | 149.9 | 159.0 | 170.8 |
| 7.21% | 125.5 | 129.8 | 135.1 | 141.6 | 149.8 |
Value per share, $. Source: QSILabs DCF model.
To justify $187.25 with our 6.21% discount rate, an investor needs terminal growth of a little over 3%, or an operating margin that settles well above our 10.6%. Both are possible for a company that keeps cutting costs and growing in Guyana, the Permian and LNG, but they assume today's refining strength is more structural than the history of the business suggests.
Risks to the ExxonMobil investment case
- Refining margins: a $50 a barrel indicative margin is about three times the level of the first quarter. If the Middle East disruption eases and fuel supply recovers, Energy Products earnings could fall sharply.
- Oil and gas prices: Brent fell from $104.52 in Q2 to $97.01 in Q3. A return to the low-$60s seen in Q4 2025 would cut Upstream earnings, which rose by $3.68bn on price alone against a year earlier.
- Middle East operations: disruption cost Upstream $860m and Energy Products $130m in Q3, and nine-month identified items include a $1.90bn Energy Products loss from impairments and shipments that could not be made against hedges.
- Timing effects: derivative mark-to-market losses cut nine-month earnings by $3.94bn. They should reverse, but they make quarterly earnings hard to read.
- Guyana entitlements: ExxonMobil's share of Guyana production falls as cost recovery completes, which reduced Q3 volumes and earnings.
- Capital and projects: larger stakes in Papua LNG and Rovuma LNG add long-dated capital commitments, and carbon capture and lower-emission businesses depend on policy support.
- Upside risk: if structural cost savings keep compounding and Guyana, the Permian and LNG keep growing, ExxonMobil could hold margins above our mid-cycle assumption, and the value would be higher.
FAQ
What is ExxonMobil stock worth after Q3 2026 earnings?
QSILabs values ExxonMobil at $168.66 per share, based on a discounted cash flow model updated for Q3 2026 results. That is about 10% below the $187.25 close on 30 October 2026. A two-stage cross-check gives $157.09; analysts' average price target is $182.05.
Is ExxonMobil stock a buy after Q3 2026?
Our model says XOM trades about 11% above our value because the price assumes today's refining and oil prices last longer than we do. The business is strong: earnings doubled, net debt fell by nearly $11bn this year and buybacks continue at $20bn a year. This is not investment advice.
How much did ExxonMobil earn in Q3 2026?
ExxonMobil earned $15.41bn in Q3 2026, or $3.72 a share, against $7.55bn, or $1.76 a share, a year earlier. Adjusted earnings, excluding identified items and timing effects, were $17.51bn, or $4.23 a share.
Why did ExxonMobil's earnings rise in Q3 2026?
Mostly refining. The indicative refining margin rose to $50.3 a barrel from $29.0 in Q2, and Energy Products earnings rose to $7.17bn from $1.84bn a year earlier. Higher oil and gas prices added $3.68bn to Upstream earnings against a year earlier.
How much free cash flow did ExxonMobil generate in Q3 2026?
ExxonMobil generated $19.1bn of free cash flow in Q3 2026 from $25.7bn of operating cash flow. Free cash flow in the first nine months of 2026 was $39.0bn, almost double the $20.6bn of a year earlier.
How much will ExxonMobil spend on buybacks in 2027?
ExxonMobil plans $20bn of share repurchases in 2027, assuming reasonable market conditions. It bought back $15.1bn of stock in the first nine months of 2026, $5.1bn of it in Q3.
What is ExxonMobil's dividend?
ExxonMobil declared a Q4 2026 dividend of $1.07 a share, payable on 10 December 2026 to holders of record on 16 November. That is up from $1.03 in Q3 and annualises to $4.28, a 2.3% yield at $187.25. 2026 is its 44th consecutive year of higher annual dividends.
Why does ExxonMobil have a new SEC filer number?
On 1 July 2026 ExxonMobil completed a redomicile into a new parent, ExxonMobil Holdings Corporation, incorporated in Texas, which trades under the same XOM ticker. Its filings appear on SEC EDGAR under the new company, starting with the Q3 2026 results.
Sources
- ExxonMobil Holdings Corporation, Q3 2026 earnings release (Form 8-K, Exhibit 99.1, 30 Oct 2026; accession 0002115436-26-000018) www.sec.gov
- ExxonMobil Holdings Corporation, 3Q26 investor relations data summary (Form 8-K, Exhibit 99.2; accession 0002115436-26-000018) www.sec.gov
- ExxonMobil Holdings Corporation, Form 10-Q for the quarter ended 30 Sep 2026 (accession 0002115436-26-000020) www.sec.gov
- Imperial Oil Limited, Form 10-Q for the quarter ended 30 Sep 2026 (accession 0000049938-26-000051) www.sec.gov
- StockAnalysis: ExxonMobil forecast and analyst ratings, S&P Global data (accessed 2 Nov 2026) stockanalysis.com
- Yahoo Finance chart data: XOM closing prices (October 2026) query1.finance.yahoo.com
- Yahoo Finance chart data: IMO.TO and USD/CAD (30 Oct 2026) query1.finance.yahoo.com
- Damodaran Online: cost of capital by industry (US) pages.stern.nyu.edu
- QSILabs ExxonMobil discounted cash flow model (internal; price as of 30 Oct 2026)
Disclaimer
This article is for information only and is not investment advice, a recommendation or an offer to buy or sell any security. QSI Labs and its authors may hold positions in the securities discussed. Forecasts and valuations are estimates that depend on assumptions that may prove wrong. Figures are taken from company filings and third-party sources believed to be reliable, but we do not guarantee their accuracy. Do your own research or consult a licensed adviser before investing.
More from QSI Labs
Related analysis: Eli Lilly stock Q3 2026: Mounjaro and Zepbound, Meta stock Q3 2026: Muse AI and the capex bill, Amazon stock Q3 2026 and NVIDIA stock Q3 2026.
Read our white paper, QSI Labs: An AI-Native Trading Firm Built on a Training Loop (October 2026), available on request, or browse the research index.