Research / Earnings and valuation
Capital One Stock Q3 2026:EPS Up 16% as Charge-Offs Fall
As of: Figures are as of Capital One's third-quarter 2026 results (the quarter ended 30 September 2026, reported 20 October 2026 in a Form 8-K with its earnings release and financial supplement) and its Q3 2026 earnings call the same evening. Capital One had not yet filed its Q3 2026 Form 10-Q when we wrote this. The share price used in our valuation is the NYSE close of COF on 2 November 2026, $210.77. Analyst data were accessed on 2 November 2026. Published 2 November 2026.
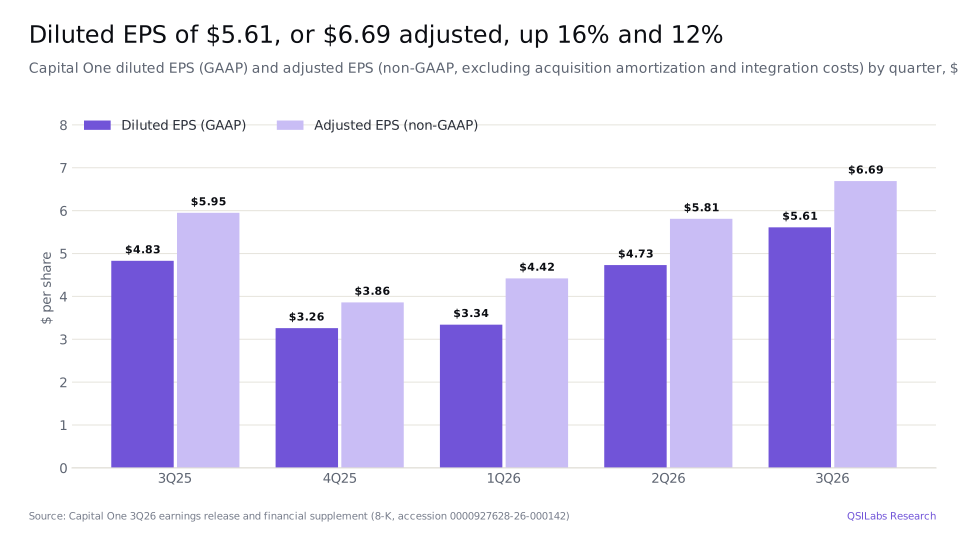
The short answer. Capital One stock Q3 2026 is a story of the Discover deal starting to pay off. In the three months to 30 September 2026, Capital One earned $3,539m, up 11%, and $5.61 per diluted share, up 16% from $4.83. Excluding acquisition amortization and integration costs, adjusted EPS was $6.69, up 12%. Revenue rose 6% to $16,344m, the domestic card charge-off rate fell to 3.98% from 4.63%, and the return on tangible common equity (ROTCE) was 21.1%. Management said the deal is delivering about $1.8bn of annualized synergies, ahead of schedule. Our excess-return model values Capital One at $215.00 a share, 2.0% above the $210.77 close on 2 November 2026: the share price assumes Capital One goes back to earning about its own long-run return on equity, a little above its cost of equity.
Key takeaways
- EPS up 16%, profit up 11%. Q3 2026 net income was $3,539m against $3,192m a year earlier, and diluted EPS rose to $5.61 from $4.83, helped by a 5% fall in the diluted share count. Adjusted EPS was $6.69, against $5.95 (8-K Ex 99.1; 8-K Ex 99.2).
- Credit improved. The domestic card net charge-off rate fell to 3.98% from 4.63% a year earlier, and the total net charge-off rate to 2.73% from 3.16%. Capital One released $225m of its loan-loss allowance (8-K Ex 99.2; Q3 2026 earnings call).
- Discover synergies ahead of schedule. Chair and chief executive Richard Fairbank said results "reflect about $1.8 billion of annualized combined synergies", mainly from moving Capital One debit cards to the Discover Network and from expense savings (Q3 2026 earnings call).
- More marketing ahead. Marketing was $1,594m, up 14%, and management expects "to lean harder into marketing in 2027", including restarting Discover marketing (8-K Ex 99.2; Q3 2026 earnings call).
- Capital returned. Capital One bought back $2.6bn of shares in the quarter and held its CET1 ratio at 13.8%. Shares outstanding fell 5.4% in a year, to 601.5m (8-K Ex 99.2; Q3 2026 earnings call).
- Our value: $215.00 a share, 2.0% above the $210.77 close and up from $180.24 in our previous estimate. The average analyst price target we track is $255.19 (StockAnalysis, S&P Global data).
- What to watch. Fourth-quarter results, expected in late January 2027, where consensus adjusted EPS is $4.86, and the conversion of the existing Discover card accounts, due to finish in the first quarter of 2027 (Equibles; Q3 2026 earnings call).
Key numbers from Capital One's Q3 2026 earnings
| Metric | Q3 2026 | Q3 2025 | Change |
|---|---|---|---|
| Total net revenue | $16,344m | $15,359m | +6.4% |
| Net interest income | $12,886m | $12,404m | +3.9% |
| Non-interest income | $3,458m | $2,955m | +17.0% |
| Non-interest expense | $8,856m | $8,263m | +7.2% |
| Provision for credit losses | $2,916m | $2,714m | +7.4% |
| Net income | $3,539m | $3,192m | +10.9% |
| Diluted EPS (GAAP) | $5.61 | $4.83 | +16.1% |
| Adjusted EPS (non-GAAP) | $6.69 | $5.95 | +12.4% |
| Return on common equity (ROE) | 12.6% | 11.5% | +1.1 pts |
| Return on tangible common equity (ROTCE) | 21.1% | 18.8% | +2.3 pts |
| Net interest margin | 8.41% | 8.36% | +0.05 pts |
| Domestic card net charge-off rate | 3.98% | 4.63% | -0.65 pts |
| Period-end loans held for investment | $462.5bn | $443.2bn | +4.4% |
| Period-end deposits | $480.7bn | $468.8bn | +2.5% |
| CET1 ratio | 13.8% | 14.4% | -0.6 pts |
| Tangible book value per share | $102.72 | $105.18 | -2.3% |
Capital One Q3 2026 earnings: what happened
Capital One reported its third-quarter 2026 results on the evening of 20 October 2026. Total net revenue was $16,344m, up 6% from $15,359m a year earlier and up 3% from $15,850m in the second quarter. Fairbank said: "The Discover integration continues to go well and we're making good progress on delivering the expected synergies" (8-K Ex 99.1).
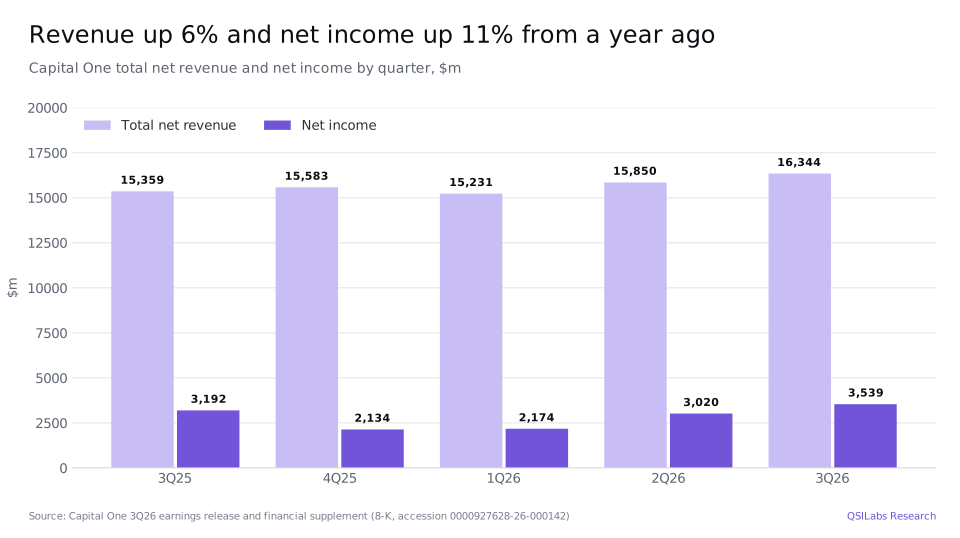
Net interest income, the difference between what Capital One earns on its loans and what it pays on deposits and debt, rose 4% to $12,886m. The net interest margin widened 40 basis points from the second quarter to 8.41%, which management put down to higher card yields, $13bn less cash on average and an extra day in the quarter. Non-interest income, mainly card fees and network revenue, rose 17% to $3,458m (8-K Ex 99.2; Q3 2026 earnings call).
Costs rose more slowly than revenue. Non-interest expense was $8,856m, up 7%, including $1,594m of marketing, up 14%, $483m of amortization of acquired intangibles, $338m of Discover integration costs and $47m of costs for integrating Brex, the business-card company Capital One bought in April. The efficiency ratio, expenses as a share of revenue, was 54.2%, against 53.8% a year earlier (8-K Ex 99.1; 8-K Ex 99.2).
The provision for credit losses was $2,916m, up 7% from a year earlier but down $73m from the second quarter. It was made up of $3.1bn of net charge-offs, loans written off after recoveries, less a $225m release from the allowance. Pre-provision earnings rose 10% from the second quarter to about $7.5bn (8-K Ex 99.1; Q3 2026 earnings call).
Net income was $3,539m and net income for common shareholders $3,422m. The effective tax rate was 22.6% in the quarter and 21.2% in the first nine months. Diluted EPS rose 16% to $5.61, faster than profit, because the average diluted share count fell 5% to 609.5m. The three adjusting items, amortization and the two integration programmes, cost $1.08 a share after tax, which takes adjusted EPS to $6.69 (8-K Ex 99.1; 8-K Ex 99.2).
- 18 May 2025Capital One closes its acquisition of Discover Financial Services2025 Form 10-K
- 4Q25Quarterly dividend raised to $0.80 a share from $0.608-K Ex 99.2
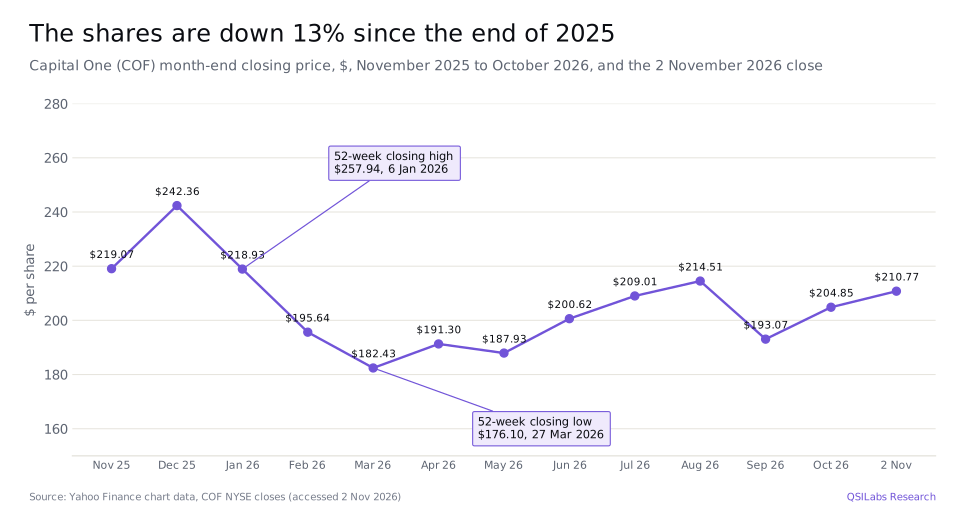
- 31 Dec 2025COF ends 2025 at $242.36Yahoo Finance
- 6 Jan 2026COF closes at $257.94, its 52-week closing highYahoo Finance
- 22 Jan 2026Q4 2025 resultsStockAnalysis transcripts
- Early 2026Capital One debit customers converted to the Discover NetworkQ3 2026 earnings call
- 27 Mar 2026COF closes at $176.10, its 52-week closing lowYahoo Finance
- 7 Apr 2026Acquisition of Brex completed, for stock and cash8-K Ex 99.2
- 20 Oct 2026Q3 2026 results: diluted EPS $5.61, adjusted EPS $6.69, ROTCE 21.1%. COF closes 2.5% higher the next day, at $206.668-K Ex 99.1; Yahoo Finance
- 2 Nov 2026COF closes at $210.77 on the NYSE, the price used in our valuationYahoo Finance
- Late Jan 2027Q4 and full-year 2026 results expectedQSILabs estimate from the January 2026 timing
- 1Q27Conversion of the existing Discover card accounts to Capital One's technology due to be completedQ3 2026 earnings call
How is the Discover integration going?
Capital One bought Discover Financial Services on 18 May 2025, adding the Discover card business and the Discover payments network. The deal is why 2025 profit was low: in 2025 Capital One booked an $8.8bn initial allowance for the Discover loans it acquired, and integration costs were about $1.1bn for the year (2025 Form 10-K; 8-K Ex 99.2).
The savings are now coming through. Fairbank said the year-to-date results "reflect about $1.8 billion of annualized combined synergies, primarily driven by the successful debit conversion early in 2026 and the pace of achieving expense synergies", and that "on a combined basis, we're achieving the expected synergies ahead of schedule" (Q3 2026 earnings call).
Management also gave a rough guide to what the combined company can earn. Fairbank said that from current results investors should "add in the remaining synergies" and deduct the lost interchange revenue that will likely come from the Visa and Mastercard settlement with merchants, which is going through court approval, and that "the remaining synergies and the Visa, MasterCard settlement are roughly offsetting in magnitude". Capital One does not generally guide on earnings power (Q3 2026 earnings call).
The technology work continues. Since the end of September all new Discover card accounts are opened on Capital One's systems, and the conversion of existing Discover accounts is due to finish in the first quarter of 2027. Discover integration costs were $1,051m in the first nine months of 2026 (Q3 2026 earnings call; 8-K Ex 99.2).
Credit quality: charge-offs fall, reserves released
Credit was the best part of the quarter. The domestic card net charge-off rate was 3.98%, down 73 basis points from the second quarter and 65 basis points from a year earlier. Management credited the steady improvement in delinquencies earlier in the year and strong recoveries. The 30-day delinquency rate rose to 3.74% from 3.39% in the second quarter but was lower than the 3.89% of a year earlier (8-K Ex 99.2; Q3 2026 earnings call).
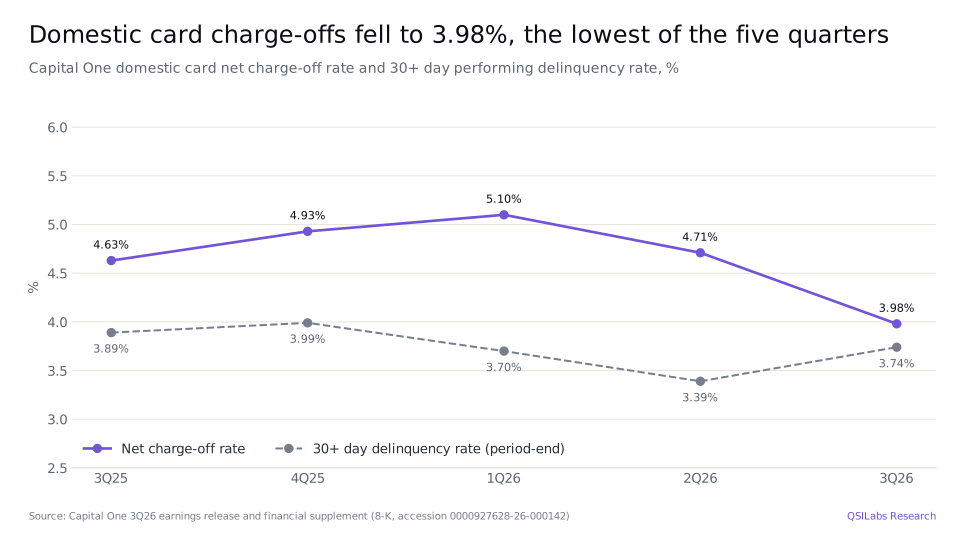
The September monthly data, filed separately, showed a domestic card charge-off rate of 3.66% for the month and the same 3.74% delinquency rate at month end (8-K Ex 99.1, September 2026 metrics).
Capital One released $225m of its loan-loss allowance, taking it to $22.7bn, or 4.92% of loans, down from 5.21% a year earlier. In domestic card it released $250m, citing good observed credit, partly offset by giving more weight to downside economic scenarios because of geopolitical risks; the card coverage ratio is 6.86%. In consumer banking it added $41m because the auto book is growing (Q3 2026 earnings call; 8-K Ex 99.2).
Auto credit is moving the other way, by design. The auto charge-off rate was 1.59%, up from 1.54% a year earlier, because Capital One is lending more to subprime borrowers, back towards its pre-pandemic mix (Q3 2026 earnings call).
Card spending, auto loans and the network
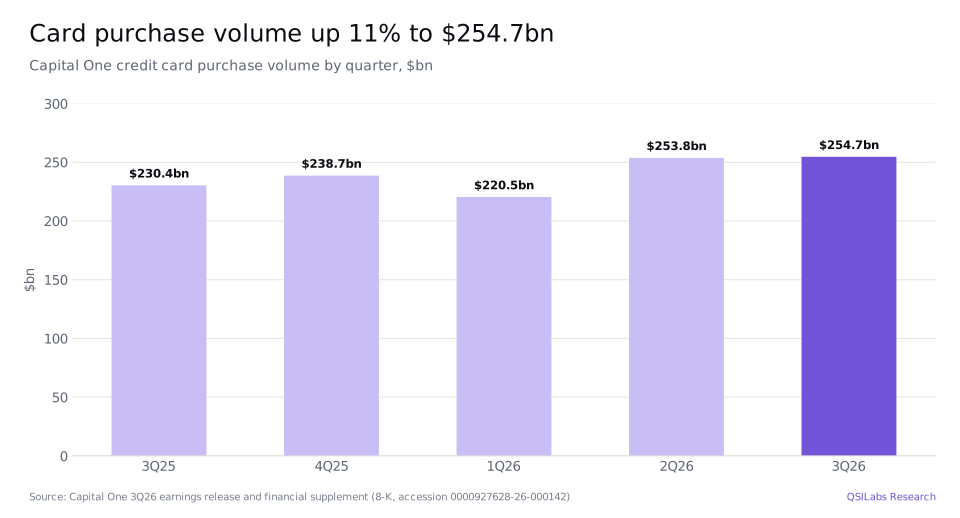
Card customers spent more. Purchase volume rose 11% to $254.7bn, helped a little by adding Brex and Capital One's own corporate cards to the domestic card business in the second quarter. Domestic card revenue rose 5% from a year earlier and the revenue margin was 17.8% (8-K Ex 99.2; Q3 2026 earnings call).
Consumer banking is growing faster. Auto originations rose 22% and auto loans 13% to $92.9bn, and consumer banking revenue rose about 17%, driven mainly by Discover synergies and auto loan growth (8-K Ex 99.2; Q3 2026 earnings call).
The network is the part of the deal Fairbank calls "the crown jewel of the acquisition". Transactions on Capital One's Global Payment Network were about $191bn in the quarter, up 25%, mainly because Capital One moved its debit card customers onto the Discover Network. Moving credit cards is slower; Fairbank said it is "not going to be a big bang thing like you saw on the debit side" (Q3 2026 earnings call).
Total loans held for investment were $462.5bn at the end of September, up 4% in a year. Deposits were $480.7bn, up 2.5%, but down about 1% from the second quarter, partly because of choices related to Discover deposits (8-K Ex 99.2; Q3 2026 earnings call).
Capital, buybacks and the dividend
Capital One's CET1 ratio, the core measure of bank capital, was 13.8% at 30 September, roughly flat on the second quarter, because profit was largely offset by $2.6bn of share buybacks, dividends and loan growth. The average liquidity coverage ratio was 163% (Q3 2026 earnings call).
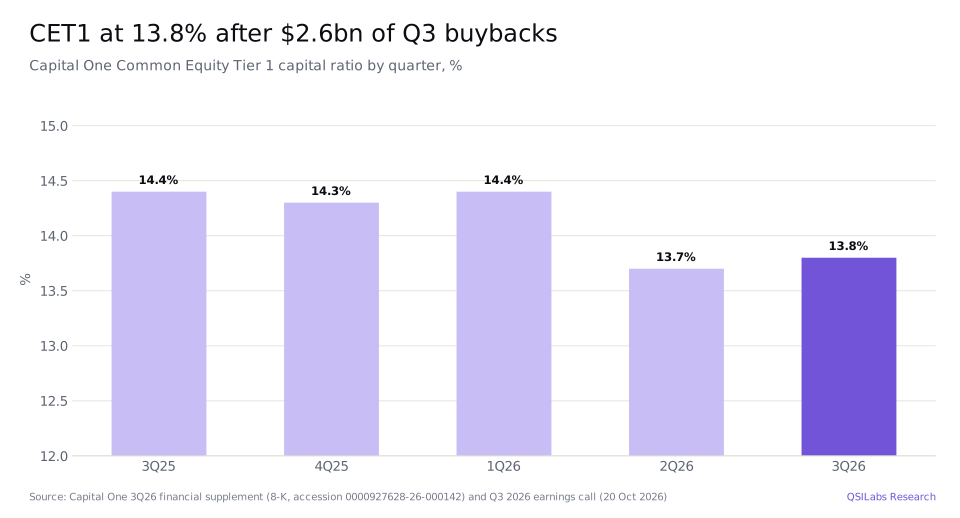
The buybacks are shrinking the share count quickly: 601.5m shares were outstanding at the end of September, down from 635.7m a year earlier. The quarterly dividend is $0.80 a share, raised from $0.60 in the fourth quarter of 2025, which is $3.20 a year, a yield of 1.5% at $210.77 (8-K Ex 99.2; Yahoo Finance).
Tangible book value per share was $102.72, down from $105.18 a year earlier, because buybacks at prices above tangible book use up tangible equity. Common equity of $105,237m is much larger than tangible common equity of $61,791m: the difference, about $43bn, is mainly goodwill and other intangibles from acquisitions, including Discover. That is why the ROTCE of 21.1% is so much higher than the 12.6% return on all common equity (8-K Ex 99.2).
Capital One stock Q3 2026: is COF undervalued?
Not on our numbers, but it is close to fairly priced. Our excess-return model values Capital One at $215.00 a share, 2.0% above the $210.77 close on 2 November 2026. The shares trade at 9.7 times 2026 consensus adjusted EPS of $21.62, 8.8 times 2027 consensus of $23.86, and 2.05 times tangible book value (StockAnalysis, S&P Global data; 8-K Ex 99.2).
Method
We value Capital One with an excess-return model. A bank's debt and deposits are its raw material, not its financing, so we value the equity directly: today's common book equity of $105,237m plus the present value of the profit Capital One earns above its cost of equity each year, plus a terminal value. We discount at an 8.81% cost of equity: a 5.12% risk-free rate, the US 10-year Treasury yield on 20 October 2026, plus a beta of 0.82 times a 4.48% equity risk premium. The beta is Damodaran's January 2026 global figure for financial services companies outside banking and insurance, the group his data put Capital One in. The premium blends his January 2026 US premium (4.46%) with his global premium (5.63%), weighted by Capital One's loans in the US and abroad: its Canadian and UK card businesses are about 2% of loans. Terminal growth is 2.5%.
Return on equity is the key assumption. For 2026 we use the first nine months' actual profit for common shareholders, $8,438m, plus consensus fourth-quarter adjusted EPS of $4.86 less the $1.08 a share of adjusting items Capital One reported in the third quarter. For 2027 we use consensus adjusted EPS of $23.86, less the after-tax cost of the $1,779m of intangible amortization the 10-K schedules for that year, taxed at the 21.2% nine-month effective rate. That gives a return on equity of 11.6% in 2027. The share count falls 4.8% a year, Capital One's average rate in 2021-2024, before the shares issued for Discover (8-K Ex 99.2; 2025 Form 10-K; Equibles; StockAnalysis).
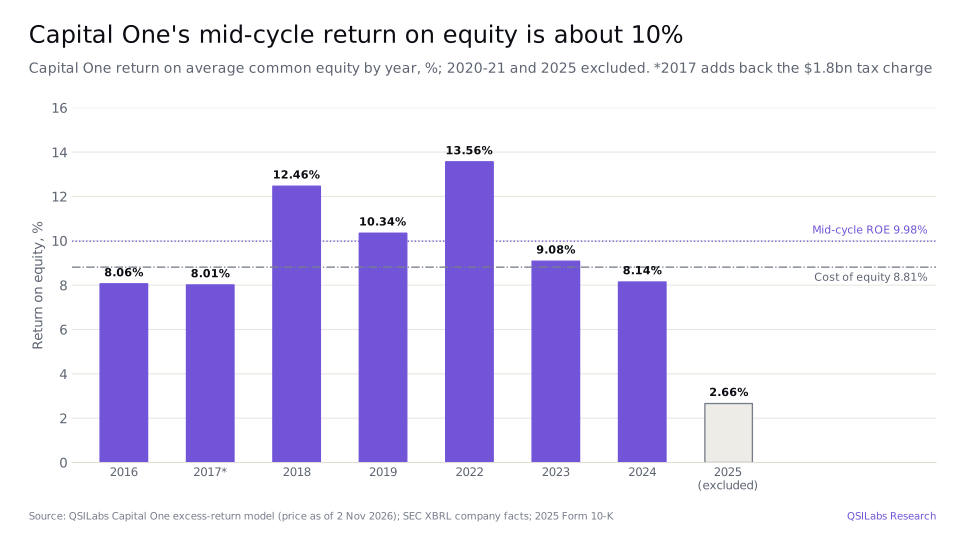
From 2028 the return fades in a straight line over five years to 9.98%, Capital One's own mid-cycle return on equity: total profit for common shareholders divided by total average common equity in 2016-2024, excluding the pandemic years 2020 and 2021. In 2017 we add back the $1.8bn charge from the US tax reform. We leave out 2025, when Capital One earned only 2.7% on equity because of the $8.8bn initial allowance for Discover loans and about $1.1bn of integration costs. Book equity grows at 2.5% a year and the rest of profit is paid out (SEC XBRL company facts; 2025 Form 10-K).
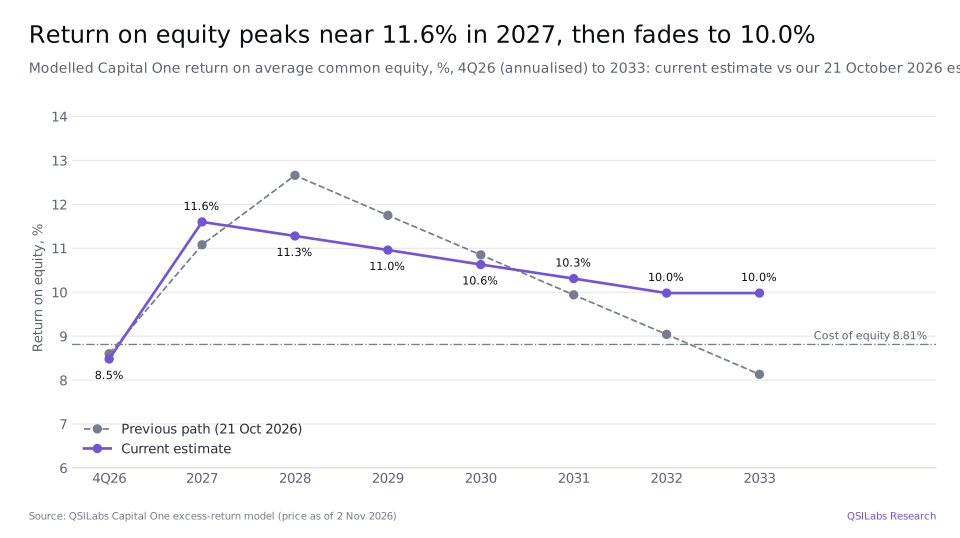
That path earns more than the cost of equity every year. The forecast years add $12,854m of value and the terminal value $11,363m, 8.8% of the total. Adding these to book equity gives $129,454m, or $215.00 a share on 602.1m diluted shares, 1.23 times book value.
The bridge from enterprise to equity value is simple for a bank. We do not deduct deposits or Capital One's borrowings: for a bank they are operating funding, and their interest cost is already in the profit we forecast. Preferred stock of $4,419m is not part of common book equity, so it is already excluded (8-K Ex 99.2).
Our value is up from $180.24 in our previous estimate, made on 21 October 2026 at a price of $206.66. The cost of equity is unchanged at 8.81%. Almost all of the change comes from the long-run return. Our previous mid-cycle figure of 8.13% averaged in 2025 and the unadjusted 2017, and the old path used our own estimate for 2028. With today's inputs but the old path the value would be $180.40.
What would you have to believe to pay $210.77?
That Capital One goes back to its own history. The share price is close to our base case, which assumes a long-run return on equity of about 10%, the level Capital One averaged before Discover. That is lower than the 12.6% it earned in the third quarter.
The downside is that 2025 was not a one-off. If we include 2025 in the mid-cycle average, the long-run return falls to 8.56% and the value to $181.74. If Capital One earns exactly its 8.81% cost of equity in the long run, the value is $187.57. A long-run return two points lower than our base, at 7.98%, gives $168.26.
The upside is that the bigger, network-owning Capital One earns more than the old one. If the return holds near its 2027 level of about 11.7%, the value is $254.44, and a long-run return two points above our base, at 11.98%, gives $261.75.
The cost of equity matters too. At 7.81% the value is $254.86 and at 9.81% it is $185.79. Using Capital One's own five-year beta of 1.04 from StockAnalysis instead of the industry beta raises the cost of equity to 9.78% and cuts the value to $186.55. Damodaran's beta for money-center banks would cut the cost of equity to 8.24% and raise the value to $235.84. Using only the US premium of 4.46% gives $215.56. If integration costs stayed at the third-quarter level of $385m a quarter through 2027, the value would be $209.70.
| Scenario (QSILabs model runs) | Value per share |
|---|---|
| Base case: long-run ROE 9.98%, cost of equity 8.81% | $215.00 |
| Previous method with today's inputs (long-run ROE 8.13%) | $180.40 |
| 2025 included in the mid-cycle average (ROE 8.56%) | $181.74 |
| Long-run ROE equal to the 8.81% cost of equity | $187.57 |
| Long-run ROE 7.98% / 11.98% | $168.26 / $261.75 |
| ROE held near its 2027 level (11.7%) | $254.44 |
| Cost of equity 7.81% / 9.81% | $254.86 / $185.79 |
| Own 5-year beta of 1.04 (cost of equity 9.78%) | $186.55 |
| Money-center bank beta (cost of equity 8.24%) | $235.84 |
| US-only ERP 4.46% (cost of equity 8.79%) | $215.56 |
| Integration costs held at the Q3 level ($385m a quarter) through 2027 | $209.70 |
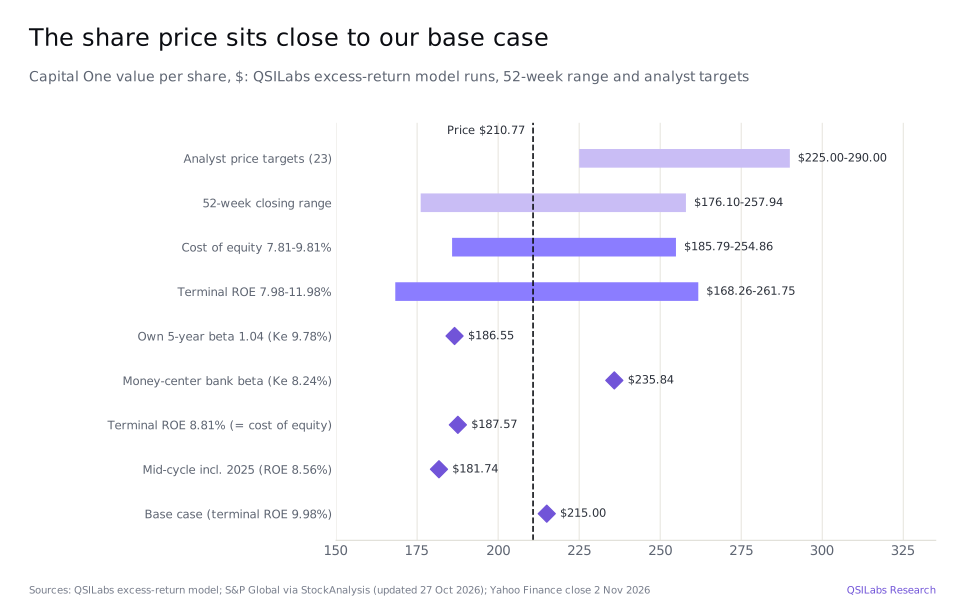
Analysts are more positive than we are. StockAnalysis reports 23 analysts with a consensus Buy rating; their price targets average $255.19, with a median of $252, a low of $225 and a high of $290 (S&P Global data, updated 27 October 2026). The gap is mainly about the long run: holding returns near their 2027 level, rather than fading them to Capital One's pre-Discover average, would put our value at $254.44, inside the analysts' range.
Risks to the Capital One investment case
- Credit turns. Capital One is mainly a credit card lender, and card losses rise quickly when unemployment rises. The domestic card charge-off rate was 5.10% as recently as the first quarter of 2026.
- The interchange settlement. Management expects the revised Visa and Mastercard settlement with merchants, which still needs court approval, to cost Capital One interchange revenue, roughly as much as the remaining Discover synergies.
- Marketing spending. Capital One plans to "lean harder into marketing in 2027". If new accounts take longer to turn into loans, costs will rise before revenue.
- Integration execution. The conversion of existing Discover card accounts is due to finish in the first quarter of 2027, and moving credit cards onto the Discover Network will take years.
- Auto mix. More subprime auto lending raises yields but also charge-offs, which have risen to 1.59% from 1.54% a year earlier.
- Goodwill-heavy balance sheet. About $43bn of the $105bn of common equity is goodwill and intangibles, so returns on tangible equity look much better than returns on all the equity shareholders have paid in.
FAQ
What value does QSILabs put on Capital One stock?
Our excess-return model values Capital One at $215.00 a share, 2.0% above the $210.77 close on 2 November 2026. It assumes a return on equity of 11.6% in 2027 that fades to a 9.98% long-run level, and an 8.81% cost of equity. If 2025 is included in the long-run average, the value is $181.74.
How much did Capital One earn in the third quarter of 2026?
Capital One earned $3,539m in Q3 2026, or $5.61 per diluted share, against $3,192m and $4.83 a year earlier. Revenue was $16,344m, up 6%, and the return on tangible common equity was 21.1%.
Why is Capital One's adjusted EPS higher than its GAAP EPS?
Adjusted EPS of $6.69 leaves out three costs linked to acquisitions: $483m of amortization of acquired intangibles, $338m of Discover integration costs and $47m of Brex integration costs. Together they cut GAAP EPS by $1.08, to $5.61.
How much has the Discover deal saved so far?
Management said year-to-date results reflect about $1.8bn of annualized combined synergies, ahead of schedule. Most came from moving Capital One's debit cards to the Discover Network and from expense savings. It expects the remaining synergies to roughly offset lost interchange revenue from the Visa and Mastercard settlement.
Why did Capital One release loan-loss reserves in Q3 2026?
Capital One released $225m of its allowance because card credit was better than expected. It released $250m in domestic card, partly offset by more weight on downside economic scenarios, and added $41m for its growing auto book. The allowance is $22.7bn, or 4.92% of loans.
What is Capital One's CET1 ratio?
Capital One's CET1 ratio was 13.8% at 30 September 2026, roughly flat on the second quarter and down from 14.4% a year earlier. Profit was largely offset by $2.6bn of share buybacks, dividends and loan growth.
Is Capital One stock a buy at $211?
Our value of $215.00 is 2.0% above the $210.77 close, so on our numbers the shares are about fairly priced. They trade at 9.7 times 2026 consensus adjusted EPS and 2.05 times tangible book value. Buying at this price needs Capital One to earn about its pre-Discover average return of 10% in the long run. This is not investment advice.
What dividend does Capital One pay?
Capital One pays a quarterly dividend of $0.80 a share, raised from $0.60 in the fourth quarter of 2025. That is $3.20 a year, a yield of about 1.5% at $210.77. The last ex-dividend date was 17 August 2026.
When will Capital One report Q4 2026 earnings?
Capital One reported Q4 2025 results on 22 January 2026, so Q4 and full-year 2026 results are expected in late January 2027. Consensus is $4.86 of adjusted EPS for the fourth quarter and $21.56 for 2026 (Equibles).
Sources
- Capital One Financial Corp., third quarter 2026 earnings release (Form 8-K, Exhibit 99.1, 20 Oct 2026; accession 0000927628-26-000142) www.sec.gov
- Capital One Financial Corp., third quarter 2026 financial supplement (Form 8-K, Exhibit 99.2, 20 Oct 2026) www.sec.gov
- Capital One Financial Corp., monthly charge-off and delinquency metrics for September 2026 (Form 8-K, Exhibit 99.1; accession 0000927628-26-000143) www.sec.gov
- Capital One Financial Corp., 2025 Annual Report on Form 10-K (filed 19 Feb 2026; accession 0000927628-26-000024) www.sec.gov
- SEC XBRL company facts for Capital One (CIK 0000927628), including the $1.8bn 2017 tax-reform charge (accession 0000927628-20-000102) data.sec.gov
- Capital One Q3 2026 earnings call transcript, 20 Oct 2026 (StockAnalysis) stockanalysis.com
- StockAnalysis: Capital One earnings call transcripts, including Q4 2025 (22 Jan 2026) (accessed 2 Nov 2026) stockanalysis.com
- Equibles: Capital One analyst estimates (accessed 2 Nov 2026) equibles.com
- StockAnalysis: Capital One forecast and analyst ratings, S&P Global data (updated 27 Oct 2026, accessed 2 Nov 2026) stockanalysis.com
- StockAnalysis: Capital One statistics (accessed 2 Nov 2026) stockanalysis.com
- Yahoo Finance chart data: COF closing prices and dividends (November 2025 to November 2026) query1.finance.yahoo.com
- Damodaran Online: betas by industry (global), January 2026 pages.stern.nyu.edu
- Damodaran Online: cost of capital by industry, US and global (equity risk premiums), January 2026 pages.stern.nyu.edu
- US Treasury daily par yield curve rates (10-year yield on 20 Oct 2026) home.treasury.gov
- QSILabs Capital One excess-return model (internal; risk-free rate 5.12%; price as of 2 Nov 2026)
Disclaimer
This article is for information only and is not investment advice, a recommendation or an offer to buy or sell any security. QSI Labs and its authors may hold positions in the securities discussed. Forecasts and valuations are estimates that depend on assumptions that may prove wrong. Figures are taken from company filings and third-party sources believed to be reliable, but we do not guarantee their accuracy. Do your own research or consult a licensed adviser before investing.
More from QSI Labs
Related analysis: American Express stock Q3 2026: card fees and credit, Visa stock Q3 2026: cross-border volumes and buybacks, Mastercard stock Q3 2026: services and stablecoins, JPMorgan stock Q3 2026: NII and buybacks and Citigroup stock Q3 2026: Services and RoTCE.
Read our white paper, QSI Labs: An AI-Native Trading Firm Built on a Training Loop (October 2026), available on request, or browse the research index.