Research / Earnings and valuation
Citigroup Stock Q3 2026:EPS Up 53% as Services Grows 15%
As of: Figures are as of Citigroup's third-quarter 2026 results (the quarter ended 30 September 2026, reported 13 October 2026 in a Form 8-K with its earnings release and quarterly financial data supplement) and its Q3 2026 earnings call the same day. The share price used in our valuation is the NYSE close of C on 30 October 2026, $122.64; the shares closed at $123.10 on 2 November 2026. Analyst data were accessed on 2 November 2026. Published 2 November 2026.
The short answer. Citigroup stock Q3 2026 is a story of a turnaround that is starting to show in the returns. In the three months to 30 September 2026, Citigroup earned $5,245m, up 40%, and $2.85 per diluted share, up 53% from $1.86. Revenue rose 8% to $23,845m, expenses fell 2%, and the return on tangible common equity (RoTCE) rose to 11.5% from 8.0%. Services, the cash-management and custody business, grew revenue 15% and earned a 31.2% return on its capital. Management raised its 2026 RoTCE guidance to above 11%. Our excess-return model values Citigroup at $98.13 a share, 20.0% below the $122.64 close on 30 October 2026: the share price assumes Citi earns a little more than its cost of equity for good, something it has not done on average over the past decade.
Key takeaways
- EPS up 53%, profit up 40%. Q3 2026 net income was $5,245m against $3,752m a year earlier, and diluted EPS rose to $2.85 from $1.86. The year-ago quarter included a $726m goodwill impairment tied to Banamex; excluding it, EPS rose 27% from $2.24 (8-K Ex 99.1).
- Services is the engine. Services revenue rose 15% to $6,614m and its net income 27% to $2,637m, about half of Citi's profit, on a 31.2% RoTCE (8-K Ex 99.1).
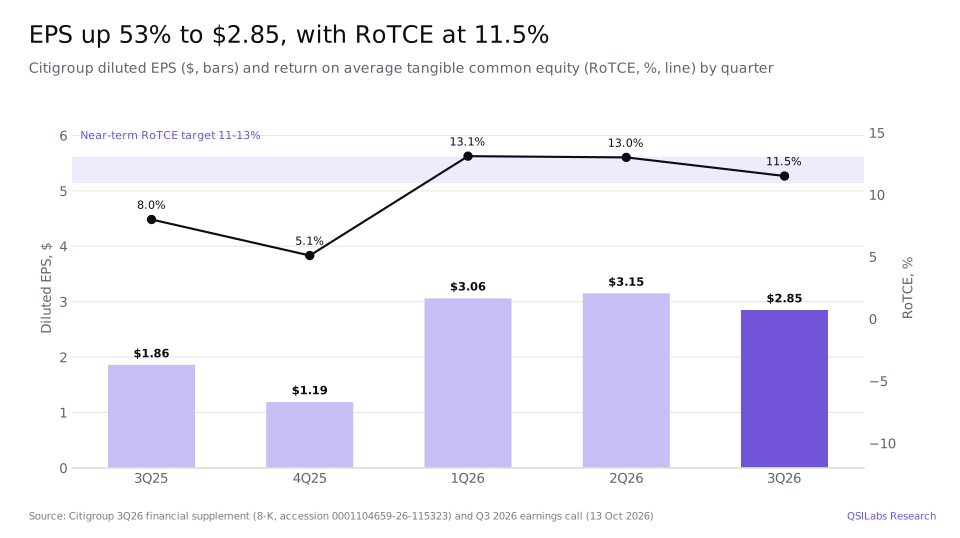
- Returns are inside the target range. RoTCE was 11.5% in the quarter and 12.6% in the first nine months, against 8.6% a year earlier. The near-term target is 11-13% "into the 2027 and 2028 time period" (8-K Ex 99.2; Q3 2026 earnings call).
- Guidance raised. Citi now expects a 2026 RoTCE above 11%, against its original 10-11% target, with growth in net interest income excluding Markets "in the mid to high 6% range" and an efficiency ratio below 60% (Q3 2026 earnings call).
- Capital returned, CET1 steady. Citi returned $4.1bn to common shareholders, including $3bn of buybacks, and held its CET1 ratio at 12.8%, about 1.2 points above its 11.6% regulatory requirement (8-K Ex 99.1; Q3 2026 earnings call).
- Our value: $98.13 a share, 20.0% below the $122.64 close on 30 October 2026 and up from $96.43 in our previous estimate. The average analyst price target we track is $150.83 (StockAnalysis, S&P Global data).
- What to watch. Fourth-quarter results, expected in mid-January 2027, where consensus EPS is $2.27, and the Banamex deconsolidation in early 2027, which brings an expected loss of about $9bn through the income statement (Equibles; Q3 2026 earnings call).
Key numbers from Citigroup's Q3 2026 earnings
| Metric | Q3 2026 | Q3 2025 | Change |
|---|---|---|---|
| Total revenue | $23,845m | $22,090m | +7.9% |
| Net interest income | $16,982m | $14,940m | +13.7% |
| Non-interest revenue | $6,863m | $7,150m | -4.0% |
| Operating expenses | $13,952m | $14,290m | -2.4% |
| Provision for credit losses | $2,586m | $2,450m | +5.6% |
| Net income | $5,245m | $3,752m | +39.8% |
| Diluted EPS | $2.85 | $1.86 | +53.2% |
| Return on common equity (ROE) | 10.1% | 7.1% | +3.0 pts |
| Return on tangible common equity (RoTCE) | 11.5% | 8.0% | +3.5 pts |
| Efficiency ratio | 58.5% | 64.7% | -6.2 pts |
| End-of-period loans | $819.7bn | $733.9bn | +11.7% |
| End-of-period deposits | $1,505.3bn | $1,383.9bn | +8.8% |
| CET1 ratio (Standardized) | 12.8% | 13.3% | -0.5 pts |
| Tangible book value per share | $101.59 | $95.72 | +6.1% |
Citigroup Q3 2026 earnings: what happened
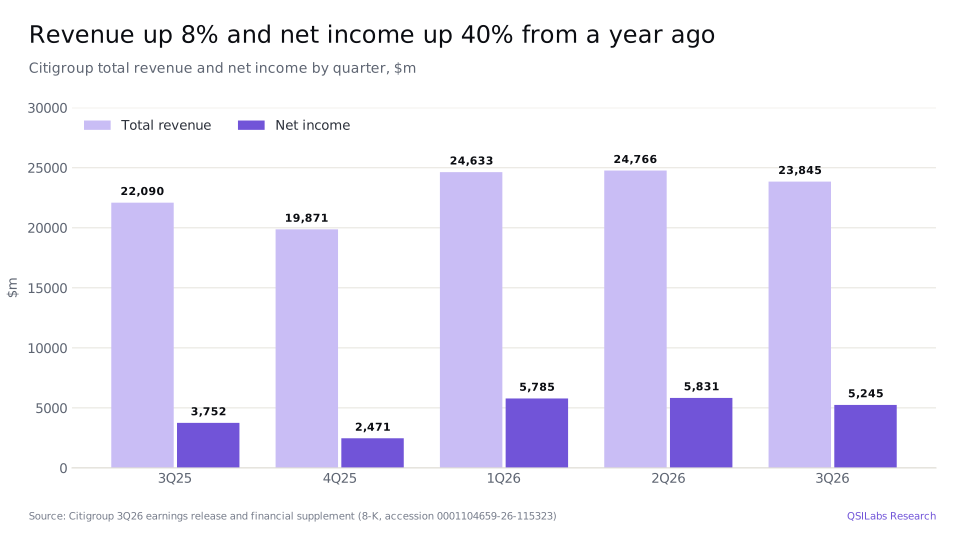
Citigroup reported its third-quarter 2026 results on 13 October 2026. Total revenue was $23,845m, up 8% from $22,090m a year earlier and down 4% from $24,766m in the second quarter. Chair and chief executive Jane Fraser called it "the best third-quarter revenue in a decade". Four of the five businesses grew revenue: Services, Wealth, Markets and Banking. Only the All Other segment, which holds the legacy businesses Citi is selling, shrank (8-K Ex 99.1).
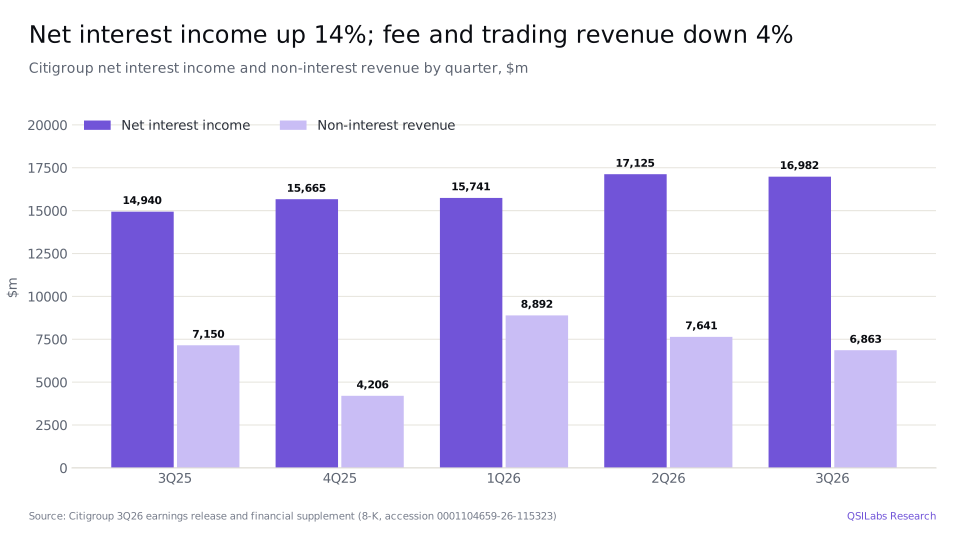
The mix of revenue changed. Net interest income, the difference between what the bank earns on loans and securities and what it pays on deposits and debt, rose 14% to $16,982m, helped by growth in Markets, Services, Wealth and US cards. Non-interest revenue, mainly fees and trading gains, fell 4% to $6,863m, because of declines in Markets and in US cards, where Citi paid more to its card partners; Services, Banking, Wealth and All Other grew (8-K Ex 99.1).
Costs fell. Operating expenses were $13,952m, down 2%, mainly because the year-ago quarter included the $726m Banamex goodwill impairment. Excluding that item, expenses rose 3%, driven by transaction and servicing costs, deposit insurance, pay and a contribution to the Citi Foundation, partly offset by lower professional services costs. The efficiency ratio, expenses as a share of revenue, improved to 58.5% from 64.7% (8-K Ex 99.1).
The provision for credit losses was $2,586m, against $2,450m a year earlier. Net credit losses, loans actually written off, were unchanged at $2,217m, and Citi added $369m to its reserves, citing changes in the economic outlook and a larger loan book. Pre-tax income rose 37% to $7,307m. The effective tax rate was about 26%, against 29% a year earlier (8-K Ex 99.1).
Net income was $5,245m, and net income for common shareholders, after $175m for minority interests and $353m of preferred dividends, was $4,892m. Diluted EPS rose 53% to $2.85, faster than profit, because the average diluted share count fell 8% to 1,706.6m. The return on common equity was 10.1% and RoTCE 11.5% (8-K Ex 99.1; 8-K Ex 99.2).
The first nine months were stronger than the quarter. Diluted EPS was $9.07, up 57% from $5.78, and RoTCE was 12.6%, against 8.6% a year earlier (8-K Ex 99.2).
- 20 Nov 2025C closes at $97.63, its 52-week closing lowYahoo Finance
- 31 Dec 2025C ends 2025 at $116.69Yahoo Finance
- 14 Jan 2026Q4 2025 results; 2026 guidance of 5-6% growth in net interest income excluding Markets and an efficiency ratio of about 60%StockAnalysis transcript summary
- May 2026Investor Day: near-term RoTCE target of 11-13% and a directional CET1 target of 13.1%Q3 2026 earnings call
- 22 Jun 2026C closes at $145.67, its 52-week closing highYahoo Finance
- 3Q26Quarterly dividend raised 12%, to $0.67 a share from $0.60Q3 2026 earnings call; Yahoo Finance
- 13 Oct 2026Q3 2026 results: EPS $2.85, RoTCE 11.5%; 2026 RoTCE guidance raised to above 11%. C closes 5.6% lower at $124.538-K Ex 99.1; Q3 2026 earnings call; Yahoo Finance
- 30 Oct 2026C closes at $122.64 on the NYSE, the price used in our valuationYahoo Finance
- 2 Nov 2026C closes at $123.10; ex-dividend date for the $0.67 quarterly dividendYahoo Finance; Equibles
- Mid-Jan 2027Q4 and full-year 2026 results expectedQSILabs estimate from the January 2026 timing
- Early 2027Banamex deconsolidation, with an expected loss of about $9bn related to currency translation adjustmentsQ3 2026 earnings call
Why is Services driving Citi's returns?
Services moves and holds money for companies, banks and governments. It has two parts: Treasury and Trade Solutions, which handles payments, cash management and trade finance, and Securities Services, which holds and administers investments for asset managers and other institutions (8-K Ex 99.1).
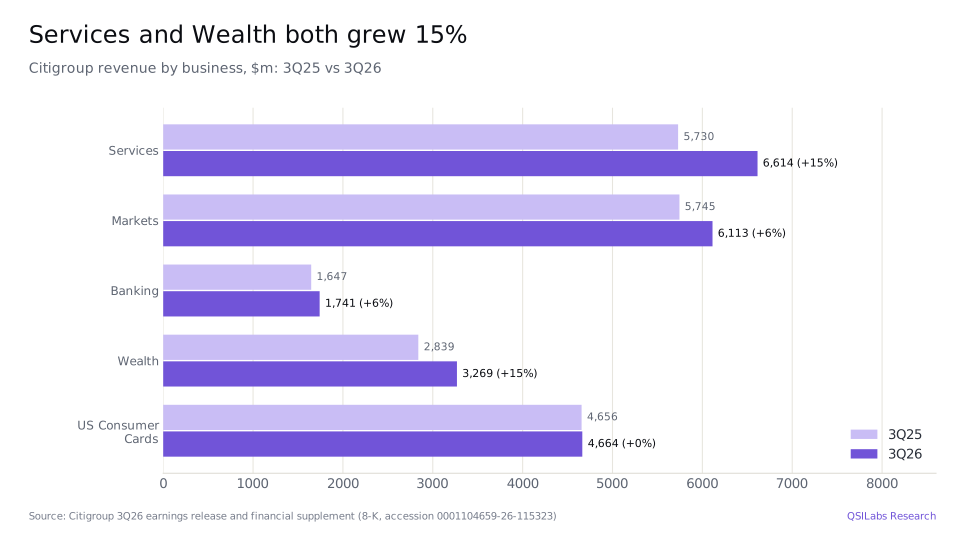
Services revenue rose 15% to $6,614m. Treasury and Trade Solutions grew 16% to $4,902m, with net interest income up 18% on higher deposit balances and spreads and fees up 12%. Cross-border transaction value rose 10% to $116bn, commercial card spending 10% and US dollar clearing volume 5%. Securities Services grew 13% to $1,712m, helped by a 16% rise in assets under custody and administration to $35 trillion (8-K Ex 99.1).
The business is valuable because of its deposits. Average Services deposits were $1,037bn in the quarter, up 16%, about two-thirds of Citi's $1,528bn of average deposits. Operating deposits from corporate clients are generally a stable source of funding for the rest of the bank (8-K Ex 99.1).
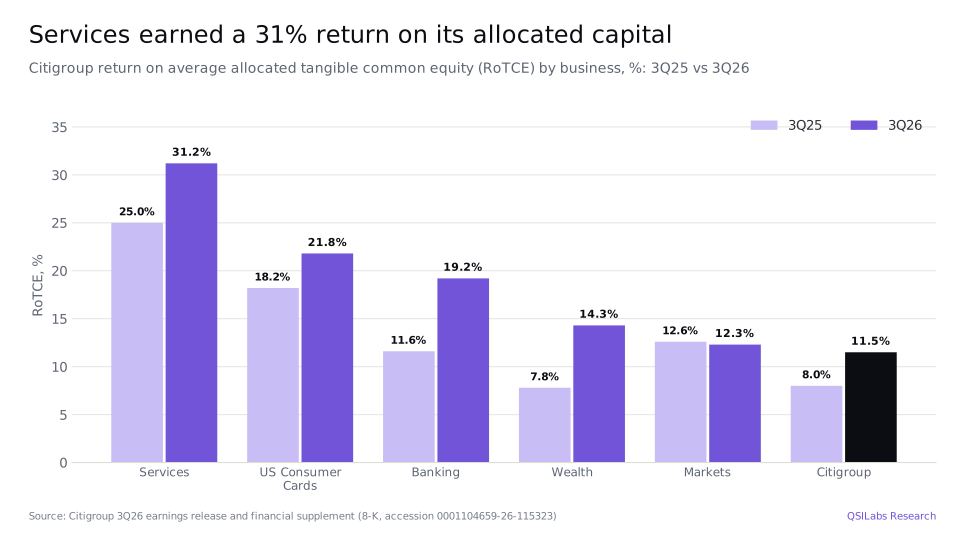
Profit grew faster than revenue. Expenses rose 10% to $2,976m, but net income rose 27% to $2,637m, and the RoTCE was 31.2%, up from 25.0%. Services used $34bn of Citi's $169bn of allocated tangible common equity, a fifth of the total, and earned about half of Citi's net income (8-K Ex 99.1).
Markets, Banking, Wealth and cards
Markets. Revenue rose 6% to $6,113m. Equities rose 14% to $1,727m on strong results in Asia and in prime brokerage. Fixed income rose 4% to $4,386m: spread products grew 13% while rates and currencies were flat. Net income rose 2% to $1,743m, and the RoTCE was 12.3%. Markets used $56bn of tangible common equity, the most of any business (8-K Ex 99.1; Q3 2026 earnings call).
Banking. Revenue rose 6% to $1,741m. Investment banking fees grew 9% to $1,350m, driven by equity capital markets, up 77% to $343m as Citi gained share in follow-on offerings and convertibles. Advisory fees fell 4% and debt underwriting 3%. Net income rose 40% to $378m and the RoTCE was 19.2% (8-K Ex 99.1).
Wealth. Revenue rose 15% to $3,269m, with growth in all three parts: Citigold and retail banking up 16%, the Private Bank up 17% and Wealth at Work up 7%. Net income nearly doubled, up 93% to $585m, and the RoTCE rose to 14.3% from 7.8%. Clients added $38bn of net new investment assets, and client investment assets were $759bn, up 15% (8-K Ex 99.1).
US Consumer Cards. Revenue was flat at $4,664m. Net interest income rose 6% on larger balances, but non-interest revenue fell 62% because of higher payments to card partners and higher rewards costs. Card spending rose 11% to $175bn. Net income fell 8% to $851m, mainly because Citi built reserves, but the RoTCE was still 21.8% (8-K Ex 99.1).
All Other. The segment that holds Legacy Franchises, mainly Mexico, and corporate costs lost $955m, against $756m a year earlier, as its net credit losses rose 46%, driven by Mexican consumer lending (8-K Ex 99.1).
Net interest income and the 2026 outlook
Net interest income rose $2,042m, or 14%, to $16,982m. Every business except Banking and All Other contributed, and much of the growth came from deposits: Citi earned more on larger deposit balances in Services and Wealth and on wider deposit spreads (8-K Ex 99.1).
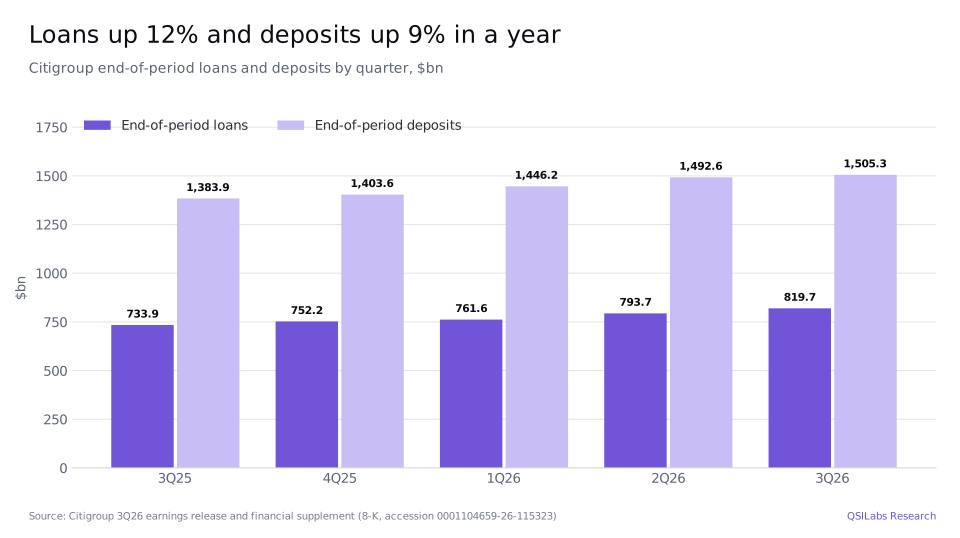
The balance sheet is growing again. End-of-period loans were $819.7bn, up 12%, driven by Markets, US cards, Wealth, Banking and Services. End-of-period deposits were $1,505.3bn, up 9%, driven by Services. Total assets were $2,941bn, up 11% (8-K Ex 99.1).
Management raised its 2026 outlook on the call. It now expects:
- an RoTCE above 11% for the year, against the original 10-11% target;
- net interest income excluding Markets to grow "in the mid to high 6% range", up from the 5-6% guided in January;
- a typical seasonal fall in Markets revenue in the fourth quarter, about 20% "or possibly a bit more";
- a full-year efficiency ratio below 60%; and
- a full-year US cards net credit loss rate of around 4%, the low end of the earlier range (Q3 2026 earnings call; StockAnalysis transcript summary).
Citi earned a 12.6% RoTCE in the first nine months, so even a weaker fourth quarter leaves the full year comfortably above 11%. Consensus expects fourth-quarter EPS of $2.27, down from $2.85 in the third quarter, and $11.38 for the year (Equibles).
Credit quality: losses and reserves
Credit is stable. Net credit losses were $2,217m, unchanged from a year earlier and down 8% from the second quarter. In US Consumer Cards, net credit losses fell 4% to $1,670m, helped by better results in private-label cards. Net credit losses in All Other rose to $433m from $297m, driven by Mexican consumer lending (8-K Ex 99.1).
Reserves are large. The total allowance for credit losses was $22.4bn, and the allowance on loans was $20.1bn, 2.5% of funded loans, down from 2.7% a year earlier. In US cards the reserve ratio is 7.7%, and about 86% of card balances are with borrowers with FICO scores of 660 or more. Citi's reserves assume an average unemployment rate of 5.3% over eight quarters, including a downside scenario of nearly 7% (8-K Ex 99.1; Q3 2026 earnings call).
Problem loans fell. Non-accrual loans, on which Citi has stopped recognising interest, fell 12% in a year to $3.3bn: corporate non-accruals fell 16% to $1.7bn and consumer non-accruals 5% to $1.5bn. Of Citi's corporate exposure, 79% is investment grade (8-K Ex 99.1; Q3 2026 earnings call).
Capital, buybacks and the Banamex exit
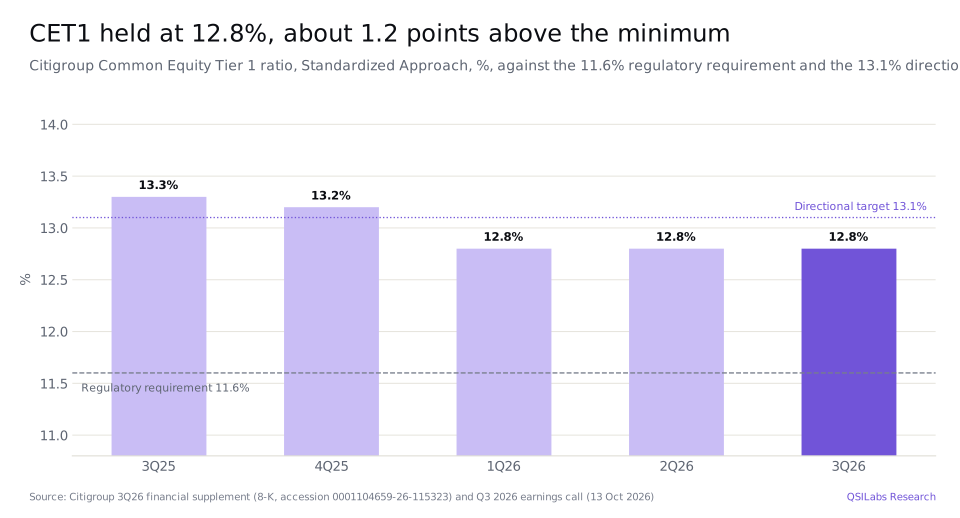
Citi's CET1 ratio, its core capital as a share of risk-weighted assets, was 12.8% at 30 September 2026, unchanged from June and down from 13.3% a year earlier. That is about 120 basis points above its current regulatory requirement of 11.6%. Citi assumes the requirement rises to 12.1% from January 2028, and at its Investor Day in May it gave a directional CET1 target of 13.1%. The supplementary leverage ratio was 5.0% (8-K Ex 99.1; Q3 2026 earnings call).
In the third quarter Citi returned $4.1bn to common shareholders: $3bn of share buybacks and about $1.1bn of dividends, an 85% payout of the $4,892m it earned for common shareholders. It raised the quarterly dividend by 12%, to $0.67 a share from $0.60, an annual rate of $2.68 or a 2.2% yield at $122.64. Shares outstanding were 1,655.2m at the end of September, down 7.5% from 1,789.3m a year earlier (8-K Ex 99.1; 8-K Ex 99.2; Q3 2026 earnings call; Yahoo Finance).
Capital is also being released from deferred tax assets. As US profits improve, Citi has cut the deferred tax assets deducted from CET1 capital by about $900m so far this year, a little ahead of the path it set at Investor Day (Q3 2026 earnings call).
Banamex is the big event of 2027. Citi has now sold 49% of Banamex, its Mexican consumer and small business bank, and plans to deconsolidate it next year, with an initial public offering to follow. On deconsolidation it expects to recognise a loss of about $9bn related to currency translation adjustments through the income statement in early 2027. Citi expects the deconsolidation as a whole to be "slightly accretive" to its CET1 ratio (Q3 2026 earnings call). In our reading, the loss moves currency losses that already sit in accumulated other comprehensive income into earnings, so it should cut 2027 reported earnings without reducing common equity.
Book value per share was $115.61, up 7% in a year, and tangible book value per share $101.59, up 6%. Common stockholders' equity was $191,359m: total stockholders' equity of $209,409m less $18,050m of preferred stock (8-K Ex 99.1; 8-K Ex 99.2).
Citigroup stock Q3 2026: is C undervalued?
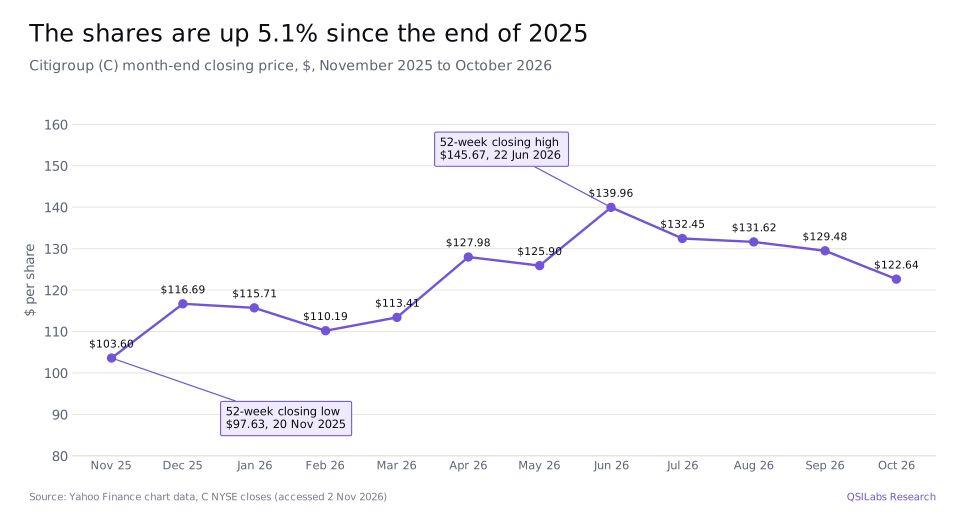
No, on our numbers. We value Citigroup at $98.13 a share, 20.0% below the $122.64 close on 30 October 2026 and 20.3% below the $123.10 close on 2 November. At $122.64 the shares trade at 10.8 times consensus 2026 EPS of $11.38, 9.4 times 2027 EPS of $13.09, 1.06 times book value of $115.61 and 1.21 times tangible book value of $101.59 (Equibles; 8-K Ex 99.1). They are up 5.1% since the end of 2025 and 15.8% below their 52-week closing high of $145.67.
Method
We value Citigroup with an excess-return model. A bank's debt and deposits are its raw material, not its financing, so we value the equity directly: today's common book equity of $191,359m plus the present value of the profit the bank earns above its cost of equity each year, plus a terminal value. We discount at an 8.78% cost of equity: a 5.12% risk-free rate, the US 10-year Treasury yield on 20 October 2026, plus a beta of 0.70 times a 5.25% equity risk premium. The beta is Damodaran's January 2026 figure for money-center banks worldwide. The premium blends his January 2026 premiums for the United States (4.46%), Europe, emerging markets and the world as a whole, weighted by where Citi earned its revenue in 2025, about half of it in North America. Terminal growth is 2.5%.
Return on equity is the key assumption. For 2026 we use the first nine months' actual profit for common shareholders, $15,865m, plus consensus fourth-quarter EPS of $2.27. For 2027 we use consensus EPS of $13.09, which gives a return on equity of 11.3%. For 2028 there is no dated consensus, so we use the company's own target: the 12% midpoint of its 11-13% RoTCE goal for 2027-28, converted to a 10.5% return on common equity using the ratio of tangible to total common equity in the third quarter (87.5%). From 2029 the return fades in a straight line over five years to 7.2%, Citigroup's own average return on equity in 2016-2025, excluding 2017 (a one-off US tax reform charge) and the pandemic years 2020 and 2021. We treat that as its mid-cycle level. Book equity grows at 2.5% a year and the rest of profit is paid out. Tax is already inside consensus EPS; Citi's effective tax rate was about 26% in the third quarter, and 25.4% over the past 12 months (8-K Ex 99.1; StockAnalysis).
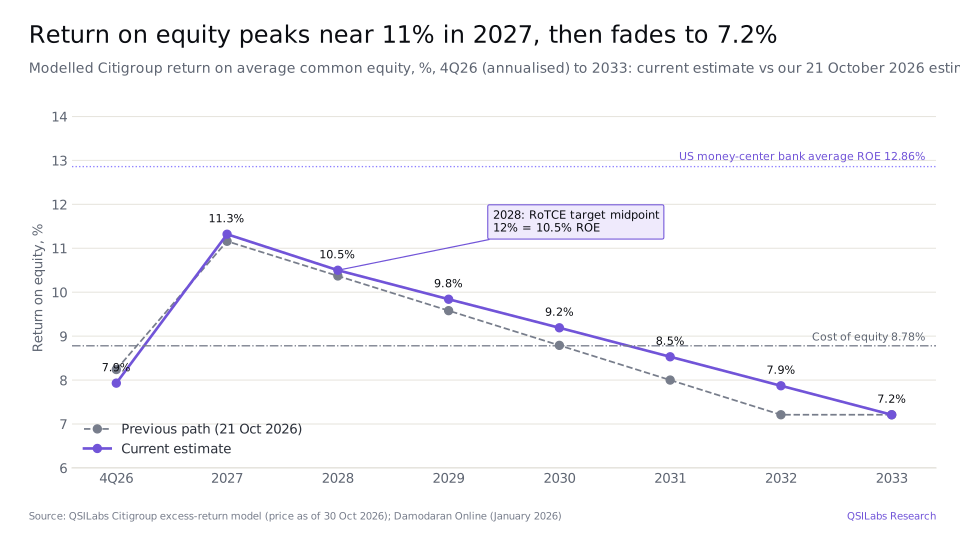
That path is cautious on the long run. From 2027 returns stay above the cost of equity until 2030, and the forecast years add $2,242m of value in total. But a terminal return of 7.2% is below the 8.78% cost of equity, so every year after the forecast destroys a little value, and the terminal value is minus $27,725m. Adding these to book equity gives $165,877m, or $98.13 a share on 1,690.4m diluted shares, 0.87 times book value.
The bridge from enterprise to equity value is simple for a bank. We do not deduct deposits, Citi's $345.8bn of long-term debt or its $61.5bn of short-term borrowings: for a bank they are operating funding, and their interest cost is already in the profit we forecast. Preferred stock of $18,050m is not part of common book equity, so it is already excluded (8-K Ex 99.2).
Our value is up from $96.43 in our previous estimate, made on 21 October 2026 at a price of $123.85. The cost of equity is unchanged at 8.78%. The change comes from setting 2028 at the company's return target, updated fourth-quarter and 2027 consensus, and third-quarter book equity. Using only the US premium of 4.46% would cut the cost of equity to 8.23% and raise the value to $106.70, still below the share price.
What would you have to believe to pay $122.64?
That Citi's turnaround is permanent. If Citi earns exactly its 8.78% cost of equity in the long run, about a 10.0% RoTCE, our model gives $120.52 a share, 1.7% below the share price. That is below the 11.5% RoTCE Citi earned in the third quarter, but about 1.6 points above its own average return on equity over the past decade.
The upside is large if Citi reaches its goals. If it holds a return on equity of about 10.6%, close to its 2028 level, for good, the value is $146.99. If it reaches the 14-15% sustainable RoTCE management is aiming for, a 12.7% return on equity, the value is $176.39, and at the 12.86% average for US money-center banks it is $178.87.
The downside is a return to the past. A long-run return two points lower than our base, at 5.2%, gives $69.53; two points higher, at 9.2%, gives $126.67. The cost of equity matters too: at 7.78% the value is $114.97 and at 9.78% it is $85.69.
| Scenario (QSILabs model runs) | Value per share |
|---|---|
| Base case: long-run ROE 7.21%, cost of equity 8.78% | $98.13 |
| US-only ERP 4.46% (cost of equity 8.23%) | $106.70 |
| Long-run ROE equal to the 8.78% cost of equity | $120.52 |
| Long-run ROE 5.21% / 9.21% | $69.53 / $126.67 |
| Cost of equity 7.78% / 9.78% | $114.97 / $85.69 |
| ROE held at 10.6% | $146.99 |
| Sustainable 14-15% RoTCE target held (12.7% ROE) | $176.39 |
| US money-center bank average ROE 12.86% | $178.87 |
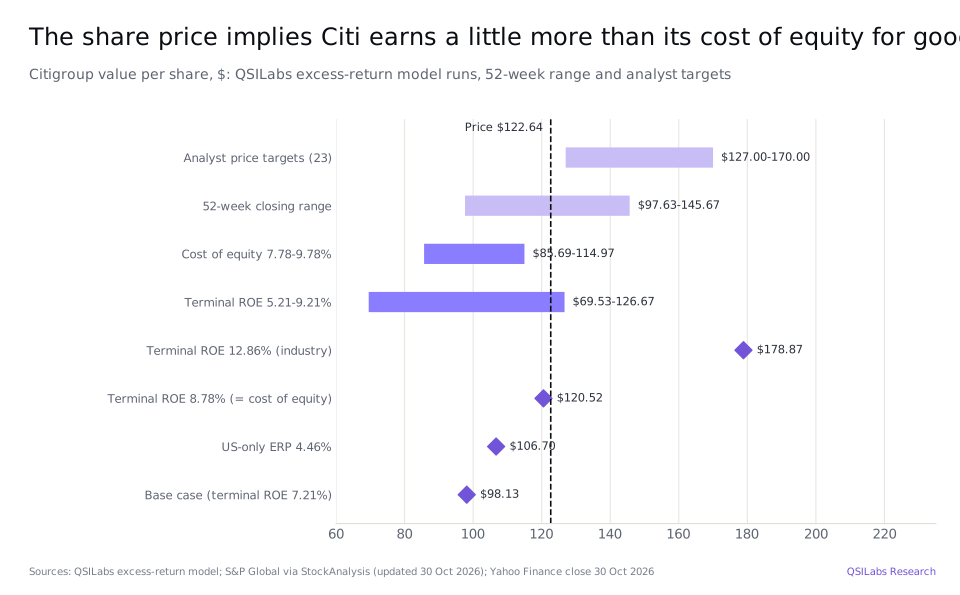
Analysts are much more positive than we are. StockAnalysis reports 23 analysts with a consensus Buy rating; their price targets average $150.83, with a median of $154, a low of $127 and a high of $170 (S&P Global data, page updated 30 October 2026). The gap is mainly about the long run: holding returns near their 2028 level, rather than fading them to Citi's historical average, would put our value at $146.99, inside the analysts' range.
Risks to the Citigroup investment case
- Returns fall back. Citi's average return on equity in 2016-2025, outside the distorted years, was about 7.2%. If the transformation does not hold, returns could fall back towards that level, which is below our 8.78% cost of equity.
- Markets volatility. Markets is the largest user of capital and earned a 12.3% RoTCE in Q3 2026, down from 17.0% in the second quarter. Management expects a seasonal fall of about 20% or more in fourth-quarter Markets revenue.
- Card economics. US Consumer Cards revenue was flat because non-interest revenue fell 62% on partner payments and rewards. Card net credit losses could rise if unemployment rises from today's levels.
- The Banamex exit. Deconsolidation brings an expected loss of about $9bn in early 2027, and the timing of the Banamex IPO depends on market conditions and regulators.
- Capital rules. The CET1 requirement is expected to rise to 12.1% in January 2028, and changes to capital rules or the stress tests could change how much capital Citi must hold and how much it can buy back.
- Costs and execution. Citi is pulling forward investment, including in AI, to reach its targets. If revenue growth slows, the efficiency ratio could move back above 60%.
FAQ
What value does QSILabs put on Citigroup stock?
Our excess-return model values Citigroup at $98.13 a share, 20.0% below the $122.64 close on 30 October 2026. It assumes a return on equity of 11.3% in 2027 and 10.5% in 2028 that fades to a 7.2% long-run level, and an 8.78% cost of equity. If Citi earns its cost of equity for good, the value is $120.52.
How much did Citigroup earn in the third quarter of 2026?
Citigroup earned $5,245m in Q3 2026, or $2.85 per diluted share, against $3,752m and $1.86 a year earlier. Revenue was $23,845m, up 8%, and the return on tangible common equity was 11.5%.
Why did Citigroup's EPS rise 53%?
Three things pushed EPS up 53%. Revenue rose 8% while expenses fell 2%; the year-ago quarter included a $726m Banamex goodwill impairment; and buybacks cut the average diluted share count by 8%. Excluding the impairment, EPS rose 27%.
What is Citi's RoTCE target?
Citi expects an RoTCE above 11% in 2026 and has a near-term target of 11-13% for 2027-28. Its longer-term aim is a sustainable RoTCE of 14-15%. It earned 11.5% in Q3 2026 and 12.6% in the first nine months.
What will the Banamex deconsolidation cost Citi?
Citi expects to recognise a loss of about $9bn related to currency translation adjustments through the income statement when it deconsolidates Banamex in early 2027. It expects the deconsolidation to be slightly positive for its CET1 ratio. Citi has sold 49% of Banamex so far.
What is Citigroup's CET1 ratio?
Citigroup's CET1 ratio was 12.8% at 30 September 2026 under the Standardized Approach, about 1.2 points above its 11.6% regulatory requirement. Citi assumes the requirement rises to 12.1% in January 2028 and has a directional target of 13.1%.
Is Citigroup stock a buy at $123?
Our value of $98.13 is 20.0% below the $122.64 close, so on our numbers the shares are not cheap. They trade at 10.8 times 2026 consensus EPS and 1.21 times tangible book value. Buying at this price needs Citi to earn a little more than its 8.78% cost of equity for good. This is not investment advice.
What dividend does Citigroup pay?
Citigroup pays a quarterly dividend of $0.67 a share, raised 12% from $0.60 in the third quarter of 2026. That is $2.68 a year, a yield of about 2.2% at $122.64. Equibles lists 2 November 2026 as the ex-dividend date for the latest payment.
When will Citigroup report Q4 2026 earnings?
Citigroup reported Q4 2025 results on 14 January 2026, so Q4 and full-year 2026 results are expected in mid-January 2027. Consensus is $2.27 a share for the fourth quarter and $11.38 for 2026 (Equibles).
Sources
- Citigroup Inc., third quarter 2026 results and key metrics (Form 8-K, Exhibit 99.1, 13 Oct 2026; accession 0001104659-26-115323) www.sec.gov
- Citigroup Inc., 3Q26 quarterly financial data supplement (Form 8-K, Exhibit 99.2, 13 Oct 2026) www.sec.gov
- Citigroup Q3 2026 earnings call transcript, 13 Oct 2026 (StockAnalysis) stockanalysis.com
- StockAnalysis: Citigroup earnings call transcripts and summaries, including Q4 2025 (14 Jan 2026) (accessed 2 Nov 2026) stockanalysis.com
- Equibles: Citigroup analyst estimates (snapshot 1 Nov 2026) equibles.com
- StockAnalysis: Citigroup forecast and analyst ratings, S&P Global data (updated 30 Oct 2026, accessed 2 Nov 2026) stockanalysis.com
- StockAnalysis: Citigroup statistics (accessed 2 Nov 2026) stockanalysis.com
- Yahoo Finance chart data: C closing prices and dividends (November 2025 to November 2026) query1.finance.yahoo.com
- Damodaran Online: return on equity by industry (US), January 2026 pages.stern.nyu.edu
- Damodaran Online: betas by industry (global), January 2026 pages.stern.nyu.edu
- Damodaran Online: country equity risk premiums, January 2026 pages.stern.nyu.edu
- QSILabs Citigroup excess-return model (internal; risk-free rate 5.12%, US Treasury 10-year yield on 20 Oct 2026; price as of 30 Oct 2026)
Disclaimer
This article is for information only and is not investment advice, a recommendation or an offer to buy or sell any security. QSI Labs and its authors may hold positions in the securities discussed. Forecasts and valuations are estimates that depend on assumptions that may prove wrong. Figures are taken from company filings and third-party sources believed to be reliable, but we do not guarantee their accuracy. Do your own research or consult a licensed adviser before investing.
More from QSI Labs
Related analysis: JPMorgan stock Q3 2026: NII and buybacks, Bank of America stock Q3 2026: NII and capital, Wells Fargo stock Q3 2026: loans and ROTCE, Morgan Stanley stock Q3 2026: wealth and equities and Goldman Sachs stock Q3 2026: advisory and equities.
Read our white paper, QSI Labs: An AI-Native Trading Firm Built on a Training Loop (October 2026), available on request, or browse the research index.