Research / Earnings and valuation
American Express Stock Q3 2026:Revenue Up 9% as Card Fees Rise 16%
As of: Figures are as of American Express's third-quarter 2026 results (the quarter ended 30 September 2026, reported 23 October 2026 in a Form 8-K) and its Form 10-Q for that quarter. The share price used in our valuation is the NYSE close of AXP on 30 October 2026, $319.11; the shares closed at $327.98 on 2 November 2026. Analyst data were accessed on 2 November 2026. Published 2 November 2026.
The short answer. American Express stock Q3 2026 is a story of steady growth with a busy quarter of one-off items around it. In the three months to 30 September 2026, revenue net of interest expense rose 9% to $20,062m, which the company called a record for a third quarter. Net card fees rose 16%, card member spending (billed business) 8%, and credit losses fell. Diluted EPS jumped 31% to $5.42 because of a gain on the sale of its stake in Global Business Travel Group (GBTG); excluding that gain and a restructuring charge, adjusted EPS was $4.68, up 13%. Our cash-flow model values American Express at $313.98 a share, 1.6% below the $319.11 close on 30 October 2026, so we see the shares as roughly fairly priced.
Key takeaways
- Revenue up 9%, card fees up 16%. Q3 2026 revenue net of interest expense was $20,062m against $18,426m a year earlier. Net card fees rose to $2,969m and net interest income 10% to $4,940m (8-K Ex 99.2).
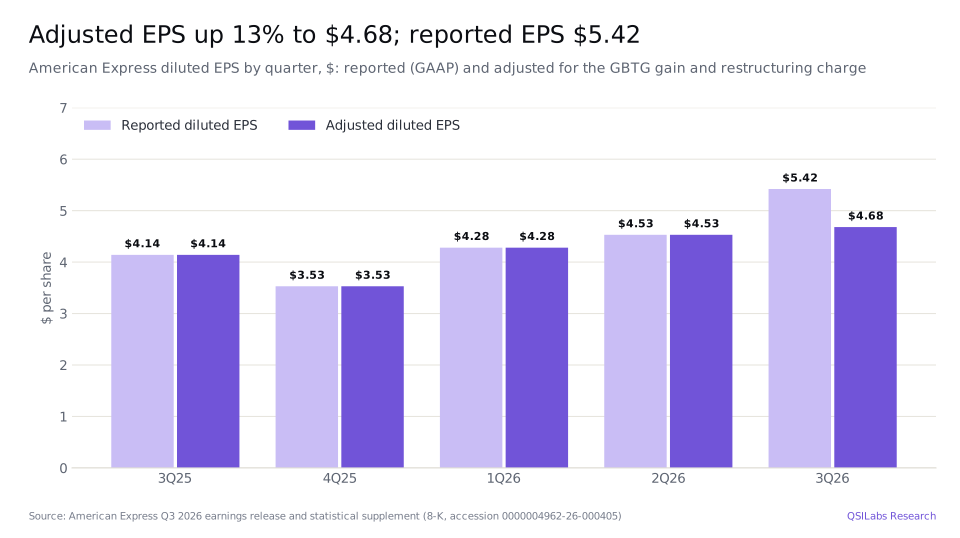
- Two EPS numbers. Diluted EPS was $5.42, up 31%, including a $982m pre-tax gain on the GBTG sale and a $336m restructuring charge. Adjusted EPS was $4.68, up 13% from $4.14 (8-K Ex 99.1).
- Guidance raised. American Express now expects 2026 EPS of $18.30-18.60, or $17.60-17.90 adjusted, against $17.30-17.90 in January, and still expects about 10% revenue growth (8-K Ex 99.1; Q4 2025 release).
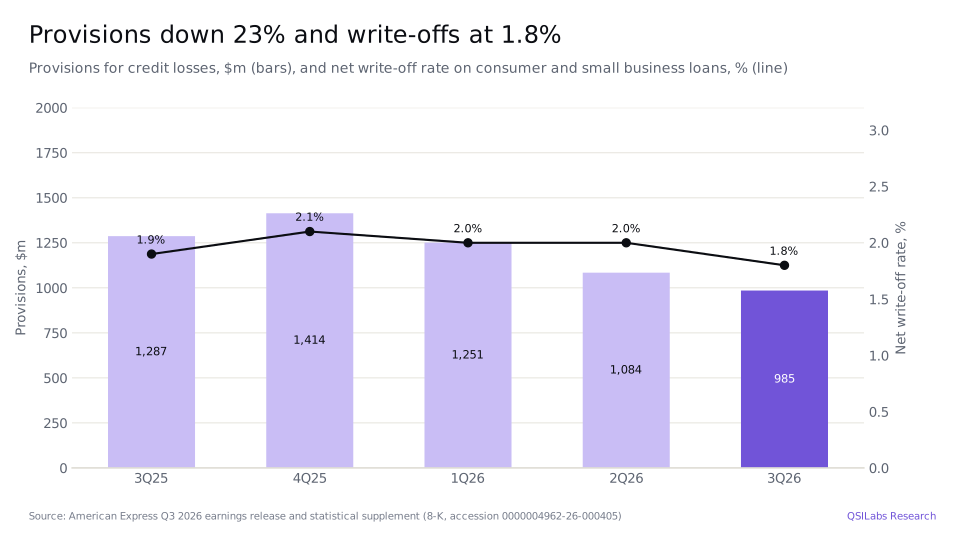
- Credit is improving. The net write-off rate on consumer and small business card balances fell to 1.8% from 1.9%, and provisions fell 23% to $985m as the company released reserves (8-K Ex 99.2).
- A regulatory cost. On 8 October 2026 the company consented to Federal Reserve and OCC orders over its financial crimes compliance programme, including a $350m civil money penalty; legal reserves rose $400m in the quarter (Form 10-Q).
- Our value: $313.98 a share, 1.6% below the $319.11 close on 30 October 2026 and down from $319.24 in our previous estimate. Analysts' average price target is $365.79 (StockAnalysis, S&P Global data).
- What to watch. Fourth-quarter results, expected in late January 2027, where consensus adjusted EPS is about $4.33, and whether spending growth holds near 8% as the Platinum card refresh is lapped.
Key numbers from American Express's Q3 2026 earnings
| Metric | Q3 2026 | Q3 2025 | Change |
|---|---|---|---|
| Revenue net of interest expense | $20,062m | $18,426m | +8.9% |
| Discount revenue | $10,169m | $9,413m | +8.0% |
| Net card fees | $2,969m | $2,551m | +16.4% |
| Net interest income | $4,940m | $4,486m | +10.1% |
| Provisions for credit losses | $985m | $1,287m | -23.5% |
| Total expenses | $14,546m | $13,314m | +9.3% |
| Pretax income | $4,531m | $3,825m | +18.5% |
| Net income | $3,712m | $2,902m | +27.9% |
| Diluted EPS | $5.42 | $4.14 | +31% |
| Adjusted EPS | $4.68 | $4.14 | +13% |
| Billed business | $454.0bn | $421.0bn | +7.8% |
| Net write-off rate (principal, consumer and small business) | 1.8% | 1.9% | -0.1 pts |
| CET1 ratio | 10.9% | 10.5% | +0.4 pts |
| Book value per common share | $51.02 | $44.76 | +14.0% |
American Express Q3 2026 earnings: what happened
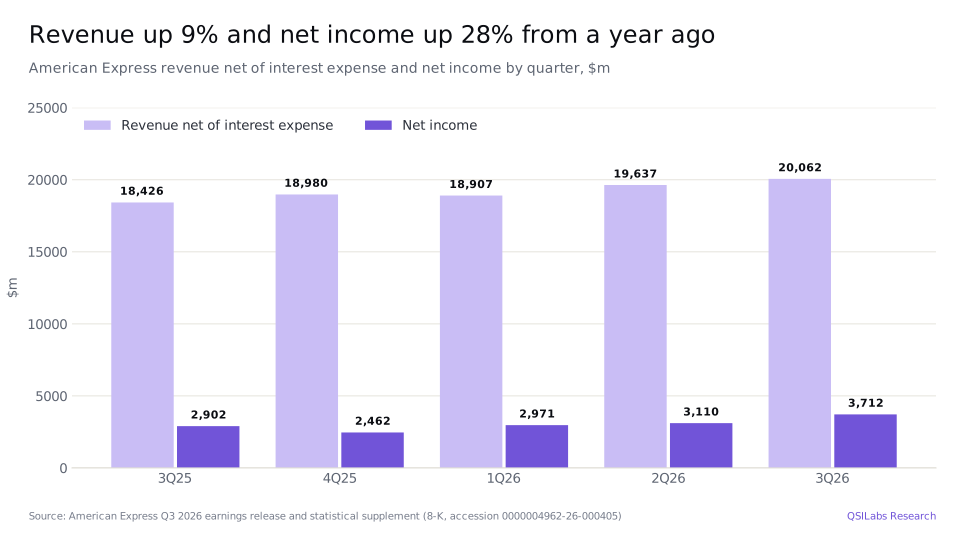
American Express reported its third-quarter 2026 results on 23 October 2026. Revenue net of interest expense was $20,062m, up 9% from $18,426m a year earlier and up 2% from $19,637m in the second quarter; the company described it as record third-quarter revenue. Discount revenue, the fee merchants pay when customers use an American Express card, rose 8% to $10,169m. Net card fees rose 16% to $2,969m and net interest income, mostly interest on card balances less the cost of deposits and debt, rose 10% to $4,940m (8-K Ex 99.1; 8-K Ex 99.2).
The headline profit figure was inflated by one-off items. American Express booked a $982m pre-tax gain ($751m after tax) on the sale of its equity stake in GBTG, and used part of it to fund a $336m restructuring charge. Management said on the earnings call that the restructuring cuts about 5% of global positions (8-K Ex 99.1; Q3 2026 earnings call summary, Yahoo Finance).
Against that, legal reserves rose $400m in the quarter, covering the part of the OCC civil money penalty not reserved before and separate legal proceedings, and an update to credit reserve models added about $0.24 a share (Form 10-Q; Q3 2026 earnings call summary, Yahoo Finance). Excluding the GBTG gain and the restructuring charge, pretax income was $3,885m, up 2% from $3,825m.
Pretax income was $4,531m and net income $3,712m, up 28%. The effective tax rate was 18.1%, against 24.1% a year earlier, because of discrete benefits from resolving prior-period tax items. Diluted EPS was $5.42, up 31%, and adjusted EPS $4.68, up 13%, on 674m average diluted shares, 3% fewer than a year ago (8-K Ex 99.1).
Chief executive Stephen Squeri said: "Our business momentum continues, with strength in billings, new acquisitions and Card Member retention, and excellent credit quality" (8-K Ex 99.1).
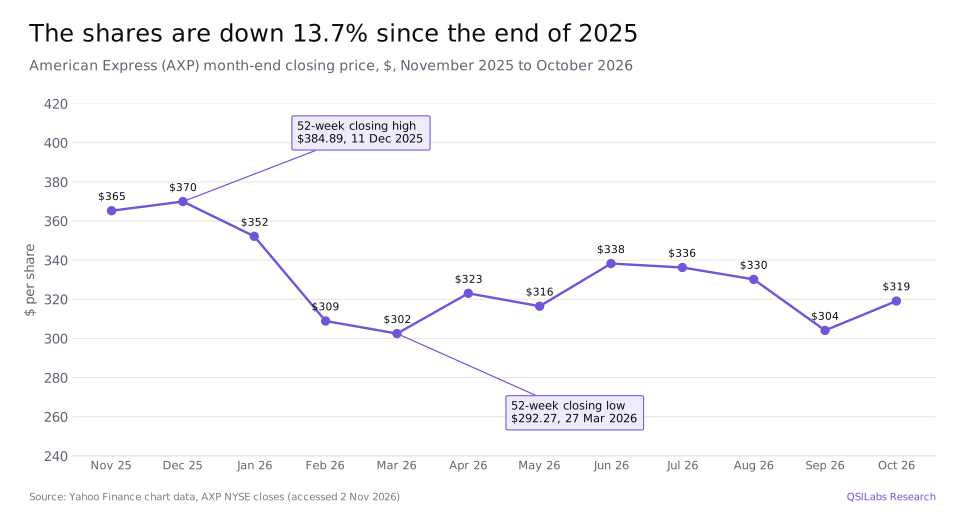
- 11 Dec 2025AXP closes at $384.89, its 52-week closing highYahoo Finance
- 30 Jan 2026Q4 2025 results: 2025 revenue up 10% to $72.2bn; 2026 guidance of 9-10% revenue growth and EPS of $17.30-17.90; dividend to rise about 16%Q4 2025 release
- 27 Mar 2026AXP closes at $292.27, its 52-week closing lowYahoo Finance
- 2Q26Revenue growth guidance for 2026 raised to 10%Q2 2026 release
- 12 Aug 2026$1.6bn of 6.450% Series E preferred shares issued; Series D redeemed on 15 September8-K Ex 99.2
- 8 Oct 2026Consent orders with the Federal Reserve and the OCC over financial crimes compliance, including a $350m civil money penaltyForm 10-Q
- 9 Oct 2026Ex-dividend date for the $0.95 quarterly dividendStockAnalysis
- 23 Oct 2026Q3 2026 results: revenue up 9%, EPS $5.42 ($4.68 adjusted); 2026 EPS guidance raised. AXP closes 3.7% lower at $313.228-K Ex 99.1; Yahoo Finance
- 30 Oct 2026AXP closes at $319.11 on the NYSE, the price used in our valuationYahoo Finance
- 2 Nov 2026AXP closes at $327.98Yahoo Finance
- Late Jan 2027Q4 and full-year 2026 results expectedQSILabs estimate from the January 2026 timing
Card fees, spending and the Platinum refresh
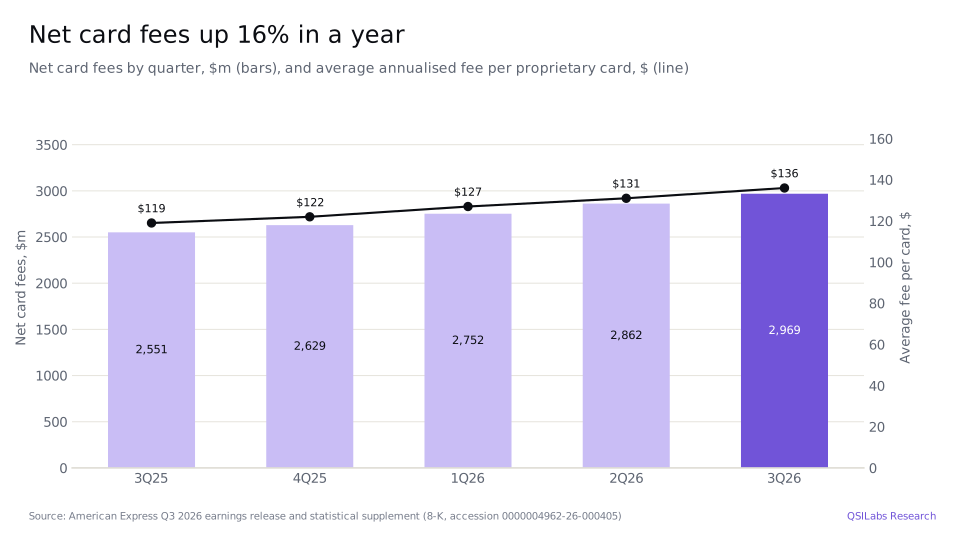
Card fees are the fastest-growing part of American Express's revenue. Net card fees of $2,969m were 16% higher than a year earlier, and the average fee per proprietary card rose to $136 from $119, after the refresh of the US Consumer Platinum card. The company acquired 3.1m new proprietary cards in the quarter, against 3.2m a year earlier, and had 155.4m cards in force, up 3% (8-K Ex 99.2).
Spending grew more slowly. Billed business, the amount card members spent on American Express cards, was $454.0bn, up 8%, or 8% on an FX-adjusted basis. Travel and entertainment spending, 29% of the total, rose 10%, and goods and services spending rose 7%. Average spending per proprietary basic card was $6,735, up 5% (8-K Ex 99.2).
The cost of that growth is higher rewards and services. Variable customer engagement costs, card member rewards, business development and card member services, rose 16% to $8,891m, faster than revenue. Card member services alone rose 36% to $2,006m, reflecting the richer Platinum benefits. Management expects this cost growth to slow in the fourth quarter as the company laps last year's Platinum refresh (8-K Ex 99.2; Q3 2026 earnings call summary, Yahoo Finance).
Which American Express segments grew fastest?
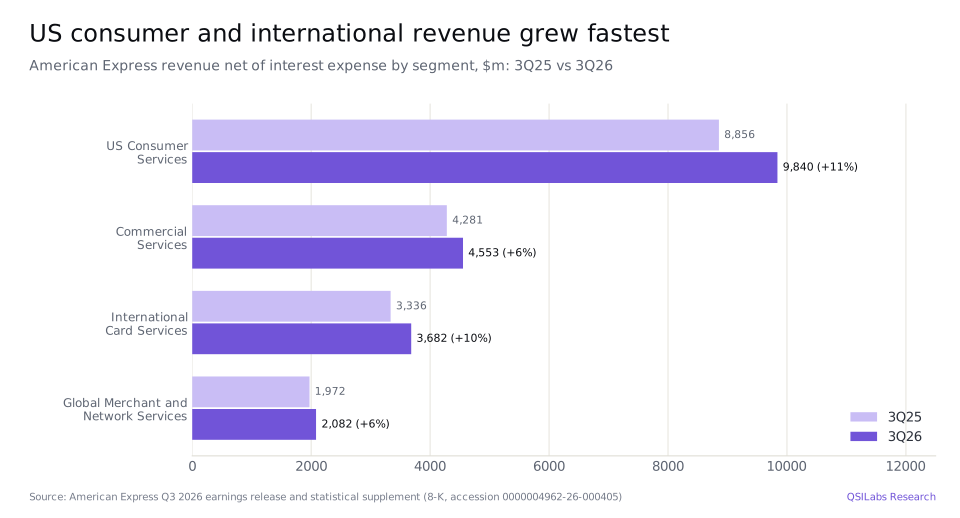
US Consumer Services, the largest segment, grew revenue 11% to $9,840m and pretax income 24% to $2,295m, helped by lower credit provisions. International Card Services revenue rose 10% to $3,682m, and its billed business rose 11%, the fastest of any segment, though pretax income fell 2% to $432m on higher costs (8-K Ex 99.2).
Commercial Services, the small business and corporate card business, grew revenue 6% to $4,553m, but its billed business rose only 3% and pretax income fell 6% to $1,029m. Global Merchant and Network Services, which runs the card network, grew revenue 6% to $2,082m and pretax income 4% to $1,082m. Card acceptance reached more than 190m merchant locations (8-K Ex 99.1; 8-K Ex 99.2).
Credit quality and provisions
Credit quality improved. The principal-only net write-off rate on consumer and small business card balances, the share of balances written off as uncollectable, was 1.8%, down from 1.9% a year earlier and 2.0% in the second quarter. Balances 30 or more days past due fell to 1.2% from 1.3% (8-K Ex 99.1; 8-K Ex 99.2).
Total provisions for credit losses were $985m, down 23% from $1,287m. Net write-offs on card balances were $1,130m, more than the $895m card provision, so card loss reserves fell to $5,634m, or 2.5% of card balances, from 2.9% a year earlier. Management said the shift towards fee-paying card members, who tend to be lower credit risks, supports a lower reserve rate. Card balances were $221.1bn, up 7% (8-K Ex 99.2; Q3 2026 earnings call summary, Yahoo Finance).
Capital, buybacks and the dividend
The Common Equity Tier 1 (CET1) ratio, core capital as a share of risk-weighted assets, rose to 10.9% from 10.4% in the second quarter, near the top of the company's 10-11% target range. CET1 capital was $29,338m against $270,071m of risk-weighted assets (8-K Ex 99.2; Form 10-Q).
In the third quarter American Express bought back 4.8m shares for $1,600m, at an average of $331.37, and paid $641m of common dividends. In the first nine months it returned $7,442m, $5,505m of it through buybacks. Shares outstanding fell to 671m from 689m a year earlier. The quarterly dividend is $0.95, up 16% from $0.82, or $3.80 a year: a 1.2% yield at $319.11 (Form 10-Q; 8-K Ex 99.2).
The company also refinanced its preferred stock. In August it issued $1.6bn of 6.450% Series E preferred shares and in September used the proceeds to redeem its 3.550% Series D preferred shares, a $16m charge to profit for common shareholders. The return on average equity was 42.4% in the quarter, lifted by the GBTG gain, and 38.0% in the first nine months (8-K Ex 99.2).
2026 guidance and the long-term aspiration
American Express raised its 2026 EPS guidance to $18.30-18.60 on a GAAP basis, or $17.60-17.90 adjusted for the GBTG gain and restructuring, up 14-16% from $15.38 in 2025. In January it had guided to $17.30-17.90, and with its second-quarter results it raised its revenue growth guidance to 10%, which it reaffirmed. Revenue was up 10% in the first nine months, at $58,606m (8-K Ex 99.1; Q2 2026 release; Q4 2025 release).
The new range implies fourth-quarter adjusted EPS of $4.11-4.41, against $3.53 a year earlier. Analysts' average estimate for 2026 adjusted EPS is $17.82 and for 2027 $20.20, a further 13% rise (StockAnalysis, S&P Global data). Management said on the call that it remains confident of mid-teens EPS growth over the long term (Q3 2026 earnings call summary, Yahoo Finance).
American Express stock Q3 2026: is AXP stock expensive?
We value American Express at $313.98 a share, 1.6% below the $319.11 close on 30 October 2026 and 4.3% below the $327.98 close on 2 November. At $319.11 the shares trade at 17.9 times 2026 consensus adjusted EPS of $17.82, 15.8 times 2027 EPS of $20.20 and 6.3 times book value per share of $51.02. They are down 13.7% since the end of 2025 and 17.1% below their 52-week closing high of $384.89.
Method
We value American Express on its free cash flow to equity: the profit it earns each year, less the capital it has to retain to support growth. For a card issuer, deposits and borrowings are raw material rather than financing, so we value the equity directly and discount at a 9.45% cost of equity: a 5.12% risk-free rate plus a beta of 0.97 times a 4.46% equity risk premium, using the Damodaran January 2026 beta for non-bank financial services. Terminal growth is 2.5%.
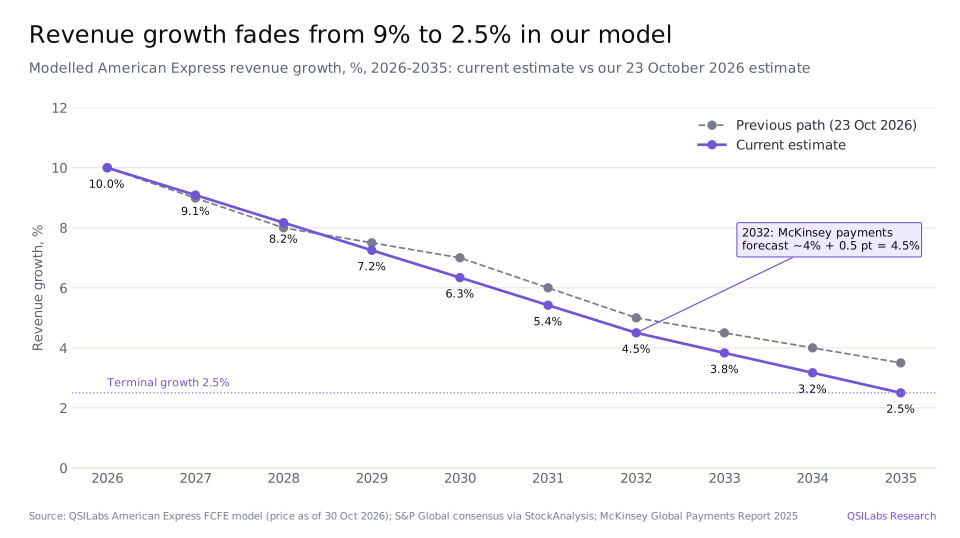
Revenue follows analyst consensus: about 10% growth in 2026, to $79.5bn, in line with company guidance, and 9.1% in 2027, to $86.7bn. After 2027 growth fades in a straight line to 4.5% in 2032, McKinsey's forecast of about 4% annual growth in global payments revenue to 2029 plus half a point, and then to 2.5% by 2035. The pretax margin is 19.5% in 2026 and 19.7% from 2027, the margin implied by 2027 consensus EPS, close to American Express's 19.1% in 2025 and 19.6% in 2024 (Form 10-K). The tax rate is 21.5%, the effective rate for 2025 and 2024.
Capital is the main brake on cash flow. American Express must hold CET1 capital against its risk-weighted assets, which grow with its business. Holding a 10.5% CET1 ratio, the middle of its target range, it keeps about 37 cents of each extra dollar of revenue as capital. On our forecasts that leaves free cash flow to equity of $10.8bn in 2027, rising to $18.9bn in 2035.
The present value of forecast cash flows to 2035 is $89.7bn and of the terminal value $121.9bn, 58% of the total. To that we add $1.0bn: $0.98bn of CET1 capital above the 10.5% level, plus profit earned between the end of September and the valuation date, less the $637m dividend declared for November. We deduct the $1.6bn of Series E preferred stock. Deposits, the $58.5bn of long-term debt and $1.4bn of short-term borrowings are not deducted: they fund the card balances, and their interest cost is already in the profit we forecast (8-K Ex 99.2). That gives equity value of $211.0bn, or $313.98 a share on 672m diluted shares.
Assumptions we changed in this update
Our value is down from $319.24 on 23 October 2026, when the share price was $313.22. We replaced three assumptions that were not tied to a source. Growth after 2027 previously eased from 8.0% to 3.5% in 2035 and then dropped to 2.5%; it now follows consensus, then McKinsey's payments forecast, then the terminal rate, with no step. The pretax margin was 20.0% from 2027; it is now 19.7%, the level implied by 2027 consensus EPS, held flat under our standard rule for mature companies. The tax rate was 23%; it is now 21.5%, the reported effective rate for 2025 and 2024, excluding the one-off benefits in 2026. Fourth-quarter 2026 profit now uses consensus EPS of $17.82 for the year. Taken together, the changes lower the value by $5.26 a share. The cost of equity is unchanged.
What would you have to believe to pay $319.11?
Not much more than our base case. The price implies either terminal growth of about 2.7% or a cost of equity of about 9.3%. The upside comes from faster growth or higher margins. If revenue grows 10% a year in 2028-2030, the rate American Express expects for 2026, before fading to 2.5% by 2035, the value is $350.02. If the pretax margin is two points higher from 2028, at about 21.7%, it is $346.80.
The downside is a weaker cycle. If the margin is two points lower, at about 17.7%, close to the 17.4% American Express earned in 2023, the value falls to $281.16. The cost of equity matters too: at 8.45% the value is $368.72 and at 10.45% it is $273.18. A simpler two-stage version of the model gives $294.93.
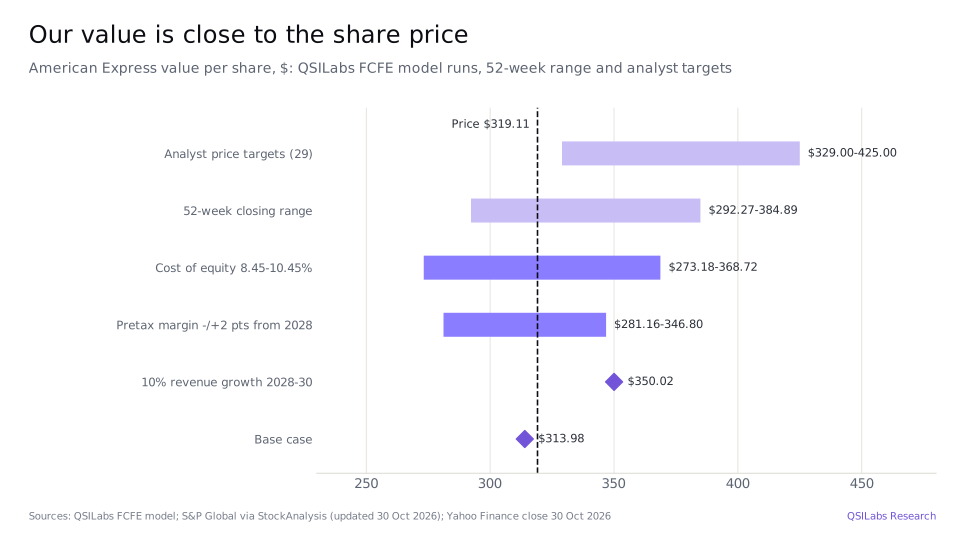
Analysts are more positive than we are. StockAnalysis reports 29 analysts with a consensus Buy rating: 9 Strong Buy, 5 Buy and 15 Hold. Their price targets average $365.79, with a median of $362.50, a low of $329 and a high of $425 (S&P Global data, page updated 30 October 2026).
Risks to the American Express investment case
- Regulation and compliance. The October 2026 Federal Reserve and OCC orders require the company to fix its financial crimes compliance programme. Further penalties or limits on new business would hurt growth.
- Rewards costs rise faster than revenue. Variable customer engagement costs grew 16% against 9% revenue growth. If competition for premium card members keeps pushing up rewards and benefits, margins could fall below the 19.7% we assume.
- Spending slows. Billed business growth has eased from 10% in the first quarter to 8%. A weaker economy or lower travel spending would cut discount revenue, the largest revenue line.
- Credit normalises. The 1.8% net write-off rate is low, and reserves have fallen to 2.5% of card balances. A rise in unemployment would raise both write-offs and provisions.
- Card pricing and network rules. Pricing regulation, interest-rate or fee caps, and changes to how merchants accept cards, including any effect of the Visa and Mastercard merchant settlement, could reduce the fees American Express earns (8-K Ex 99.1; Q3 2026 earnings call summary, Yahoo Finance).
- One-off items cloud the earnings trend. The GBTG gain, restructuring, legal reserves and tax benefits all moved 2026 earnings. Underlying growth is clearer in adjusted EPS, up 14% in the first nine months.
FAQ
What value does QSILabs put on American Express stock?
Our cash-flow model values American Express at $313.98 a share, 1.6% below the $319.11 close on 30 October 2026. It assumes revenue growth fading from about 9% in 2027 to 2.5% by 2035, a 19.7% pretax margin and a 9.45% cost of equity. If revenue grows 10% a year in 2028-2030, the value is $350.02.
How much did American Express earn in the third quarter of 2026?
American Express earned net income of $3,712m in Q3 2026, or $5.42 per diluted share, against $2,902m and $4.14 a year earlier. Adjusted EPS, excluding the GBTG gain and a restructuring charge, was $4.68, up 13%. Revenue net of interest expense was $20,062m, up 9%.
Why did American Express report two EPS figures this quarter?
Reported EPS of $5.42 includes a $982m pre-tax gain on the sale of the company's stake in Global Business Travel Group and a $336m restructuring charge. Together they added $0.74 a share. Adjusted EPS of $4.68 excludes both, which makes it easier to compare with earlier quarters.
What is American Express's 2026 EPS guidance?
American Express expects 2026 EPS of $18.30-18.60, or $17.60-17.90 adjusted, raised on 23 October 2026 from $17.30-17.90. It expects revenue growth of about 10%. The adjusted range is 14-16% above 2025 EPS of $15.38.
How fast are American Express card fees growing?
Net card fees rose 16% to $2,969m in Q3 2026. The average fee per proprietary card rose to $136 from $119 a year earlier, after the refresh of the US Consumer Platinum card. In the first nine months card fees were $8,583m, up 17%.
Is American Express's credit quality getting worse?
No. The net write-off rate on consumer and small business card balances fell to 1.8% in Q3 2026 from 1.9% a year earlier, and balances 30 or more days past due fell to 1.2%. Provisions for credit losses fell 23% to $985m.
Is American Express stock a buy at $319?
Our value of $313.98 is 1.6% below the $319.11 close, so we see the shares as roughly fairly priced rather than cheap. They trade at 17.9 times 2026 consensus adjusted EPS. More upside needs revenue to keep growing near 10% a year or margins to rise. This is not investment advice.
What dividend does American Express pay?
American Express pays a quarterly dividend of $0.95 a share, up 16% from $0.82 a year earlier. That is $3.80 a year, a yield of about 1.2% at $319.11. The latest ex-dividend date was 9 October 2026.
When will American Express report Q4 2026 earnings?
American Express reported Q4 2025 results on 30 January 2026, so Q4 and full-year 2026 results are expected in late January 2027. Consensus adjusted EPS is $17.82 for 2026, which implies about $4.33 for the fourth quarter.
Sources
- American Express Company, third quarter 2026 earnings release (Form 8-K, Exhibit 99.1, 23 Oct 2026; accession 0000004962-26-000405) www.sec.gov
- American Express Company, Q3 2026 statistical supplement (Form 8-K, Exhibit 99.2, 23 Oct 2026) www.sec.gov
- American Express Company, Form 10-Q for the quarter ended 30 Sep 2026 (accession 0000004962-26-000409) www.sec.gov
- American Express Company, Form 10-K for the year ended 31 Dec 2025 www.sec.gov
- American Express Company, fourth quarter and full year 2025 earnings release (Form 8-K, Exhibit 99.1, 30 Jan 2026) www.sec.gov
- American Express Company, second quarter 2026 earnings release (Form 8-K, Exhibit 99.1) www.sec.gov
- American Express Company Q3 2026 earnings call summary, 23 Oct 2026 (Yahoo Finance) finance.yahoo.com
- StockAnalysis: American Express forecast and analyst ratings, S&P Global data (updated 30 Oct 2026, accessed 2 Nov 2026) stockanalysis.com
- StockAnalysis: American Express statistics (accessed 2 Nov 2026) stockanalysis.com
- Yahoo Finance chart data: AXP closing prices and dividends (November 2025 to November 2026) query1.finance.yahoo.com
- McKinsey & Company, Global Payments Report 2025 (via PaySpace Magazine summary) www.mckinsey.com
- PaySpace Magazine: McKinsey report forecasts global payments revenues to surpass $3tn by 2029 payspacemagazine.com
- Damodaran Online: betas and cost of capital by industry (US), January 2026 pages.stern.nyu.edu
- QSILabs American Express free-cash-flow-to-equity model (internal; price as of 30 Oct 2026)
Disclaimer
This article is for information only and is not investment advice, a recommendation or an offer to buy or sell any security. QSI Labs and its authors may hold positions in the securities discussed. Forecasts and valuations are estimates that depend on assumptions that may prove wrong. Figures are taken from company filings and third-party sources believed to be reliable, but we do not guarantee their accuracy. Do your own research or consult a licensed adviser before investing.
More from QSI Labs
Related analysis: Visa stock Q3 2026: cross-border volumes and buybacks, Mastercard stock Q3 2026: services and stablecoins, JPMorgan stock Q3 2026: NII and buybacks and Wells Fargo stock Q3 2026: loans and ROTCE.
Read our white paper, QSI Labs: An AI-Native Trading Firm Built on a Training Loop (October 2026), available on request, or browse the research index.