Research / Earnings and valuation
Apple stock Q3 2026:a record $114.5bn quarter, iPhone up 17% and Siri AI
Apple stock Q3 2026 results landed on 2 November 2026, after the market close, and they were Apple's best September quarter ever. In the quarter to 26 September 2026, which is Apple's fiscal fourth quarter of 2026 and calendar Q3 2026, revenue rose 12% to $114.5bn, iPhone revenue rose 17% to $57.6bn and Services reached an all-time high of $31.6bn. Fiscal 2026 revenue was a record $478.8bn, up 15%. All figures in this article are as of Apple's fiscal Q4 2026 results (Form 8-K filed 2 November 2026), and share prices are as of the 2 November 2026 close of $338.32, set before the results were released.
Key takeaways
- Revenue: Apple's net sales rose 12% to $114,477m in the quarter to 26 September 2026 (fiscal Q4 2026, calendar Q3 2026), above the 9% to 11% growth Apple had guided to in July (Apple 8-K, 2 November 2026).
- iPhone and Mac: iPhone revenue rose 17% to $57,583m, a September-quarter record, and Mac revenue rose 24% to $10,792m. iPad fell 10% and Wearables, Home and Accessories fell 8%.
- Margins: gross margin was 47.9%, including about 1 percentage point from tariff refunds, down from 50.1% in the June quarter. Diluted EPS was $2.10, up 14%, including $0.05 from tariff refunds.
- Fiscal 2026: revenue $478.8bn (+15%), operating income $158.1bn (+19%), EPS $8.98 (+20%), free cash flow $136.1bn, and $102.1bn returned through buybacks and dividends.
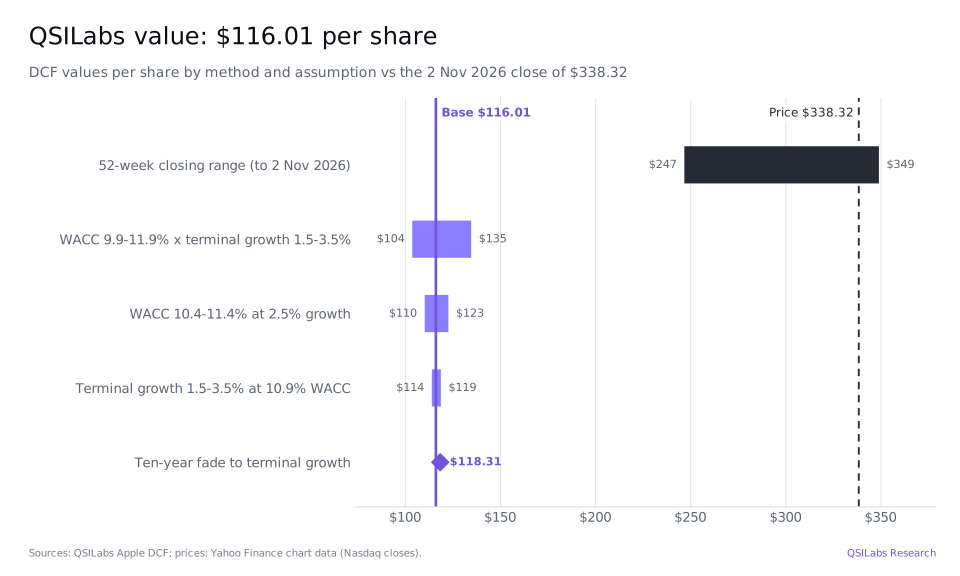
- Valuation: the QSILabs discounted cash flow value for Apple (AAPL) is $116.01 per share as of 2 November 2026, against a $338.32 close, about 66% lower. The price implies a discount rate of about 5.2% on our cash flows, versus our 10.9%.
Apple stock Q3 2026 in brief
Short answer: Apple delivered a strong quarter, beat its own revenue outlook and finished its best year ever, but the share price already assumes far more than our base case. Our discounted cash flow value is $116.01 per share (a QSILabs estimate), about 66% below the $338.32 close, almost unchanged from our $116.03 before the results. The gap comes from the discount rate and from slower long-run growth, not from the quarter: Apple grew faster than we expected, but one quarter adds little to a value built on ten years of cash flow.
| Key number, fiscal Q4 2026 (calendar Q3 2026) | Value | Year on year | Source |
|---|---|---|---|
| Net sales | $114,477m | +12% | 8-K Ex 99.1 |
| iPhone | $57,583m | +17% | 8-K Ex 99.1 |
| Services | $31,573m | +10% | 8-K Ex 99.1 |
| Mac | $10,792m | +24% | 8-K Ex 99.1 |
| Gross margin | 47.9% | from 47.2% | 8-K Ex 99.1 |
| Operating income | $35,631m | +10% | 8-K Ex 99.1 |
| Diluted EPS | $2.10 | +14% | 8-K Ex 99.1 |
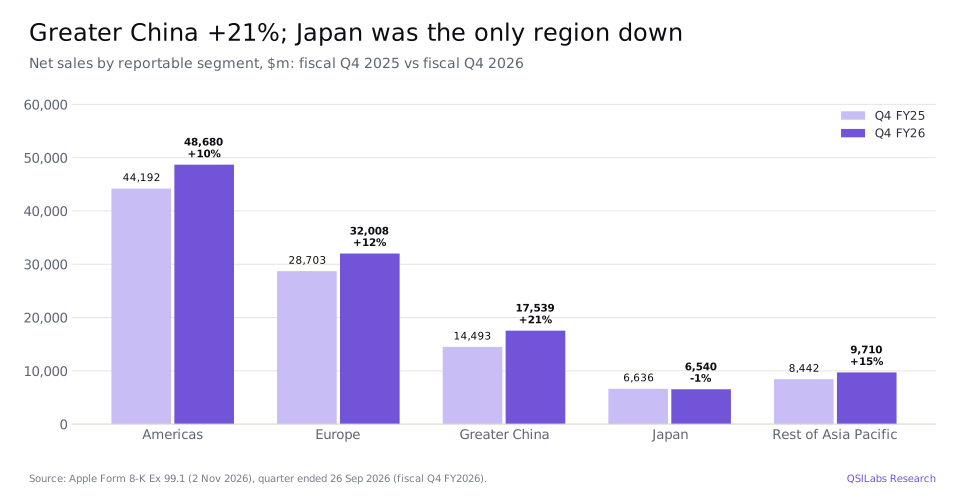
| Greater China net sales | $17,539m | +21% | 8-K Ex 99.1 |
| Fiscal 2026 free cash flow | $136,056m | +38% | 8-K Ex 99.1 |
| QSILabs value per share | $116.01 | vs $338.32 close | QSILabs DCF |
How did Apple do in Q3 2026 compared with a year ago?
Apple grew revenue 12% in calendar Q3 2026, its fiscal fourth quarter, to $114,477m from $102,466m, a September-quarter record. Products revenue rose 12% to $82,904m and Services rose 10% to $31,573m. Operating income rose 10% to $35,631m and net income rose 12% to $30,711m.
The quarter beat the outlook Apple gave on its fiscal Q3 call in July, when it guided to revenue growth of 9% to 11%, a gross margin of 47% to 48% and operating expenses of $19.1bn to $19.4bn. Revenue grew 11.7%, the gross margin was 47.9% and operating expenses were $19,189m, so revenue came in above the range and the other two inside it.
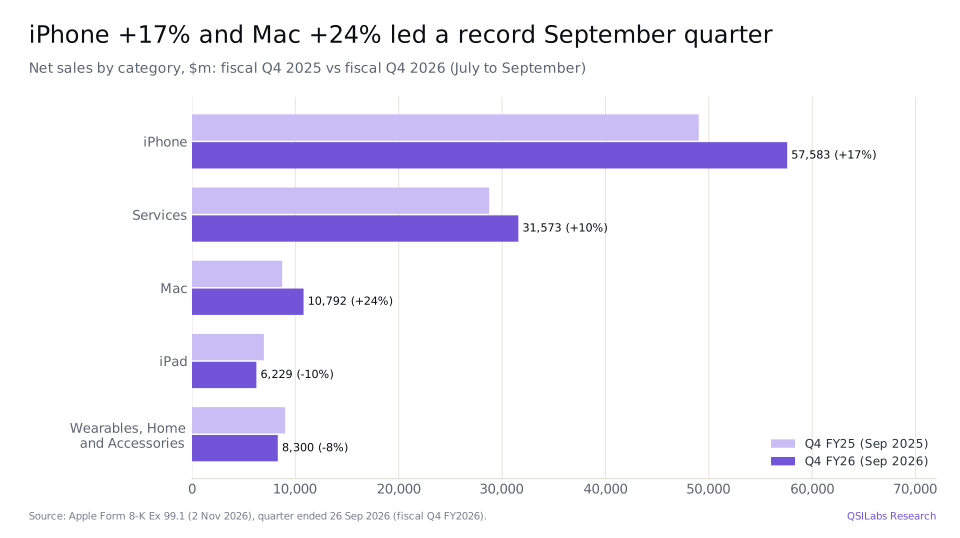
Growth was narrower than in the June quarter. Then, iPhone, Mac and Services all grew by double digits and every region grew. This time iPhone and Mac did the work, Services slowed to 10%, and iPad, wearables and Japan declined. Operating income grew more slowly than revenue because operating expenses rose 21%, led by a 32% rise in research and development to $11,730m.
- 29 Jan 2026Fiscal Q1 2026 results: record revenue of $143.8bn, iPhone +23%Apple 8-K
- 30 Mar 202652-week closing low of $246.63Yahoo Finance
- 30 Apr 2026Fiscal Q2 2026 results: revenue $111.2bn, iPhone +22%Apple 8-K
- Jun 2026Siri AI introduced at WWDC26Apple 8-K, 30 Jul 2026
- 30 Jul 2026Fiscal Q3 2026 results: revenue +16% to $109.4bnApple 8-K
- 29 Oct 202652-week closing high of $348.91Yahoo Finance
- 2 Nov 2026Fiscal Q4 2026 results: revenue +12% to $114.5bn; shares closed at $338.32 before the releaseApple 8-K; Yahoo Finance
How strong was the iPhone 18 cycle in Q3 2026?
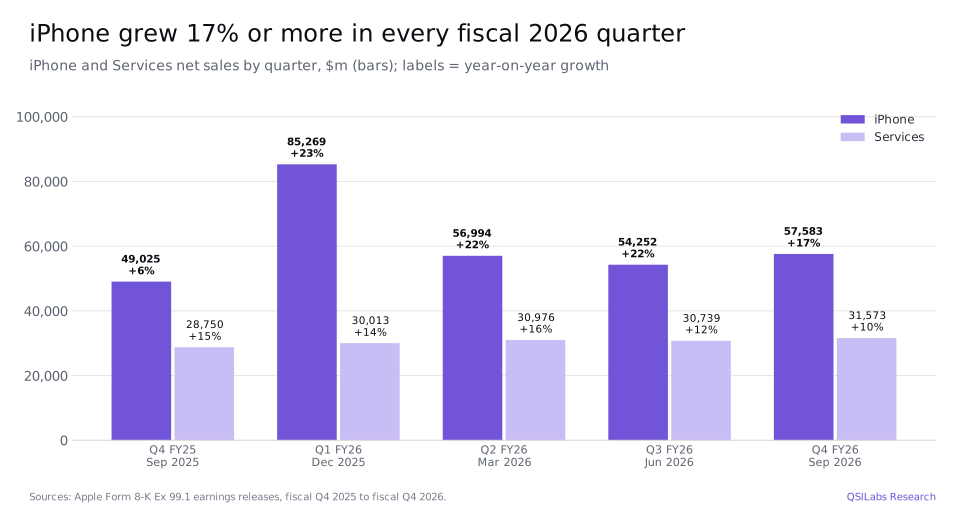
iPhone revenue was $57,583m in the September quarter, up 17% and a record for the quarter. It is the fourth fiscal 2026 quarter in a row with iPhone growth of 17% or more: 23% in the December quarter, 22% in March, 22% in June and 17% in September. For the full year, iPhone revenue rose 21% to $254,098m and made up 53% of Apple's sales.
The September quarter includes only the first weeks of iPhone 18 Pro and iPhone 18 Pro Max sales. iPhone Duo, which Apple's release calls "the most transformational iPhone since the original", went on sale in October, after the quarter ended, so none of its sales are in these numbers. Apple also cites a new generation of home hardware and Touch on the Mac, and Apple says the lineup, together with Siri AI, will "carry us into the holiday season".
Mac, iPad and wearables
Mac revenue rose 24% to $10,792m, after 29% growth in the June quarter, and reached $37,929m for the year (+13%). iPad revenue fell 10% to $6,229m and Wearables, Home and Accessories fell 8% to $8,300m. Both were flat for the full year, at $27,929m and $35,577m. Inventories rose to $14,541m at 26 September 2026 from $5,718m a year earlier.
How fast did Apple Services grow in Q3 2026?
Apple's Services revenue grew 10% to $31,573m in the September quarter, an all-time high but the slowest growth of the past five quarters. Services grew 15% a year earlier, 14% in the December quarter, 16% in March and 12% in June. For fiscal 2026, Services revenue was $123,301m, up 13%, or 26% of Apple's revenue.
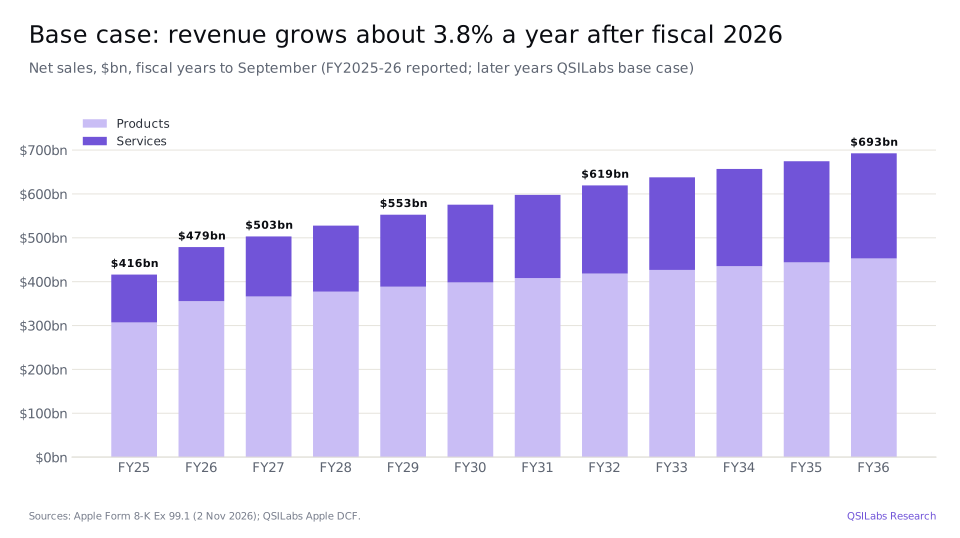
Services matter more than their share of sales suggests. Their gross margin was 76.0% in the quarter, against 37.2% for products, so Services earned $23,980m of gross profit, 44% of Apple's total. Our base case keeps Services growth at 11% in fiscal 2027 and fades it to 4% by fiscal 2036, so Services rise to about 35% of revenue.
Why did Apple's gross margin fall to 47.9% in Q3 2026?
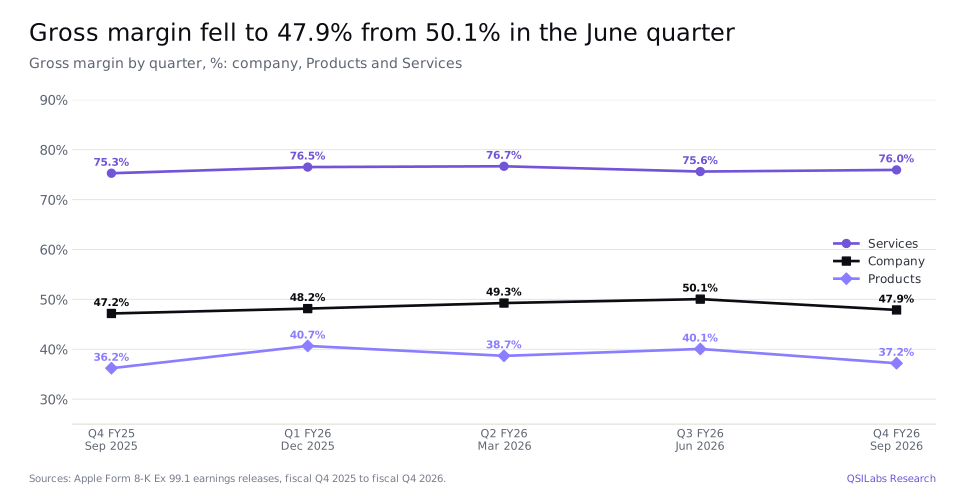
Apple's gross margin was 47.9% in the September quarter, up from 47.2% a year earlier but down from 50.1% in the June quarter. Both recent quarters were helped by tariff refunds: about 1 percentage point in September and about 2 points in June, according to Apple's releases. Without them, the margin was about 47% in September and about 48% in June.
The products gross margin was 37.2%, down from 40.1% in the June quarter but up from 36.2% a year earlier. The Services margin was 76.0%, up from 75.3%. For the full year, the gross margin was 48.8%, up from 46.9% in fiscal 2025, and the operating margin was 33.0%, up from 32.0%.
Spending is rising faster than sales. Operating expenses were $75,539m in fiscal 2026, up 22%, and research and development was $45,765m, up 32%, or 9.6% of revenue against 8.3% a year earlier. Apple does not break out its AI spending, but the jump in R&D coincides with the Siri AI launch.
How did Apple do in Greater China in Q3 2026?
Greater China net sales rose 21% to $17,539m in the September quarter, the fastest growth of Apple's five regions. For fiscal 2026, Greater China revenue rose 28% to $82,378m. The Americas rose 10% to $48,680m, Europe 12% to $32,008m and Rest of Asia Pacific 15% to $9,710m. Japan was the only region to shrink, down 1% to $6,540m.
How much cash did Apple return to shareholders in fiscal 2026?
Apple generated $145,097m of operating cash flow in fiscal 2026, up 30%, and spent $9,041m on property, plant and equipment, down 29%. That leaves free cash flow of $136,056m, up 38%, or 28% of revenue. It returned $102,111m to shareholders: $86,390m of buybacks and $15,721m of dividends. In the September quarter alone, Apple generated about $28bn of operating cash flow and returned about $28bn.
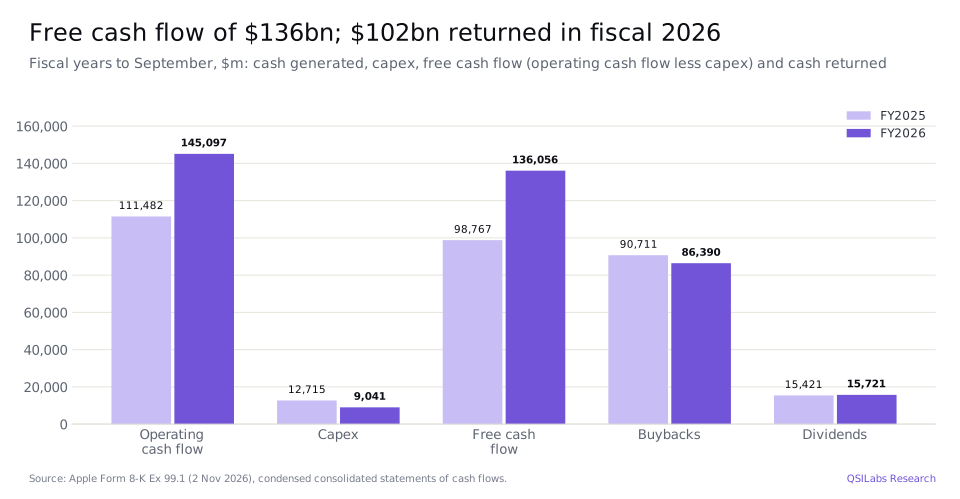
Buybacks cut the diluted share count by 1.6% in a year, to 14,630m in the September quarter. The board declared a dividend of $0.27 per share, payable on 16 November 2026 to shareholders of record on 12 November 2026.
Balance sheet
At 26 September 2026, Apple held $136,935m of cash and marketable securities against $80,111m of debt ($78,114m of term debt and $1,997m of commercial paper), so net cash was $56,824m, up from $33,763m a year earlier and down from $62,173m at the end of June. Shareholders' equity was $112,093m, up from $73,733m a year earlier, and intangible assets rose to $20,278m from $11,093m.
Siri AI and Apple's AI strategy: what do the results show?
Apple's AI story so far is about software running on its own devices, not about a cloud business. Apple introduced Siri AI at WWDC26 in June and, in this release, presents it as part of the holiday lineup. The visible financial signs are on the cost side: research and development rose 32% in fiscal 2026, and Apple's capex fell to $9.0bn, a fraction of what the large cloud companies spend.
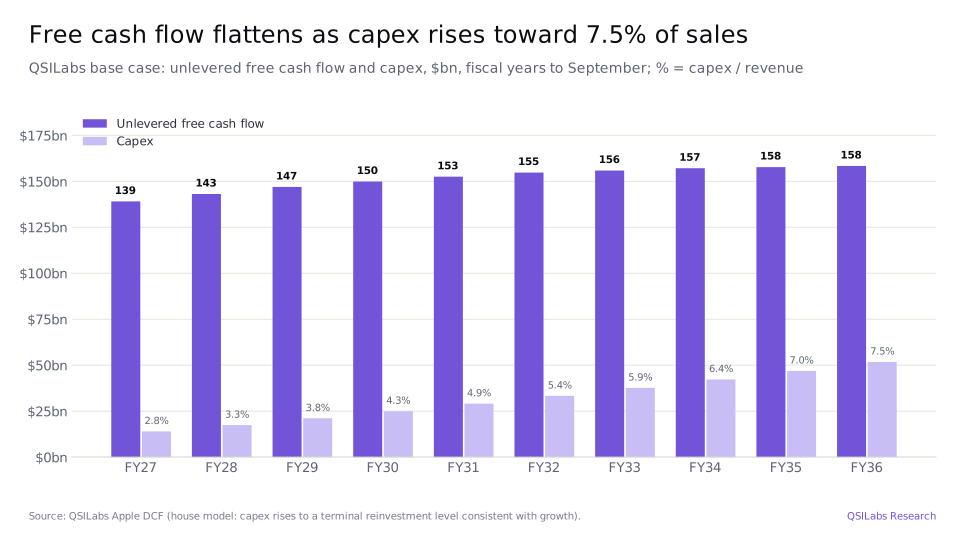
That makes Apple's AI economics different from those of its peers. It does not need to build data centres to sell AI, but it does need AI features to keep its installed base upgrading and paying for Services. Apple's CFO said the installed base of active devices reached a new all-time high across all major product categories and geographic segments. Our model assumes capital spending rises to $14bn in fiscal 2027 and then, under our house rule, to about 7.5% of revenue by fiscal 2036, the reinvestment we consider consistent with long-run growth. If Apple keeps capex near 2% of revenue, our value rises.
What is Apple's outlook for Q1 fiscal 2027?
Apple does not give guidance in its earnings release; it gives its outlook on the conference call, which began at 2:00 pm PT on 2 November 2026. No transcript of that call was available when we published, so this article does not use any outlook for the December quarter. Our model does not depend on one: it assumes fiscal 2027 revenue of $503.1bn, up 5%, with Products up 3% and Services up 11%.
What is Apple's fair value? AAPL valuation after Q3 2026
Our discounted cash flow value for Apple is $116.01 per share as of 2 November 2026, against a $338.32 close. The value was $116.03 before the results, at a 20 October 2026 valuation date and a $339.50 price. The update replaces our fiscal 2026 estimates with the reported figures, moves the balance sheet to 26 September 2026 and rolls the forecast forward a year.
Method
QSILabs values Apple with a discounted cash flow model built from Products and Services revenue. We discount unlevered free cash flow (operating profit after tax, plus depreciation, less capex and working capital) for fiscal 2027 to 2036, then add a terminal value. The discount rate is 10.86%, the Damodaran cost of capital for US computers and peripherals (January 2026): a cost of equity of 11.14% from a 5.12% Treasury yield, an industry beta of 1.35 and a 4.46% equity risk premium, with 4.4% debt in the capital structure at an after-tax cost of 4.85%. A bottom-up cross-check with a beta of 1.0 gives 10.05%. Terminal growth is 2.5%, with reinvestment set by a 15% return on new capital, and the tax rate is 16.5%. We then add $136.9bn of cash and securities, deduct $80.1bn of debt and add $12.7bn of cash flow earned between the year end and the valuation date, and divide by 14,630m diluted shares.
Our forecast
Our base case takes revenue from $478.8bn in fiscal 2026 to $503.1bn in fiscal 2027 and $692.6bn in fiscal 2036, about 3.8% a year. The operating margin is held at 32.85%, close to the 33.0% Apple earned in fiscal 2026, because Apple already earns well above the median margin of mature hardware peers and our house rule does not extend margin gains beyond that.
The terminal value is 43% of enterprise value. Enterprise value is $1,628bn and equity value $1,697bn, against a market value of about $4.95tn at $338.32.
Football field
Sensitivity
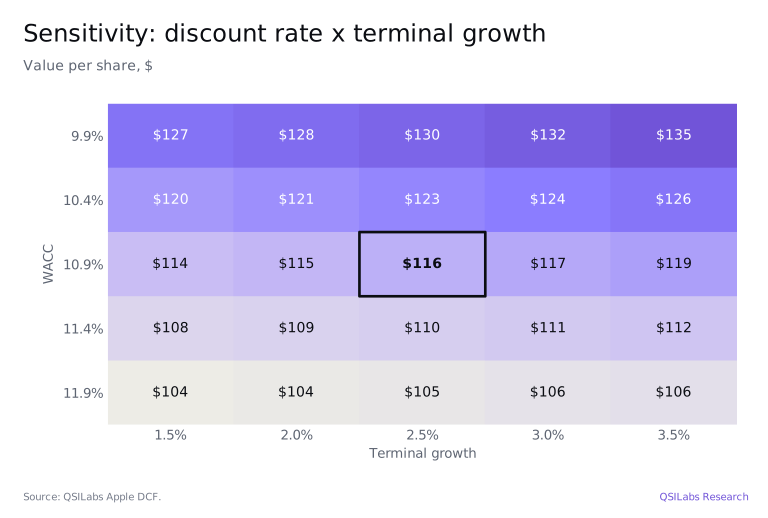
Even our most generous combination, a 9.9% discount rate and 3.5% terminal growth, gives $135 a share. Holding our cash flows, the discount rate that would justify $338.32 is about 5.2%, barely above the 5.12% Treasury yield. A ten-year fade of growth and returns after the forecast, which we show but do not use as the headline, gives $118.31.
Is Apple stock overvalued after Q3 2026?
On our numbers, Apple (AAPL) stock looks overvalued after Q3 2026: at $338.32 it trades at about 2.9 times our value of $116.01 per share, about 38 times fiscal 2026 earnings of $8.98 a share, and on a free cash flow yield of about 2.7%. The shares closed 3% below their 52-week closing high of $348.91 (29 October 2026) and 37% above their low of $246.63 (30 March 2026).
The bull case is that Apple deserves a much lower discount rate than an average hardware company. Its revenue is recurring, its Services margin is 76%, its installed base is at a record, and it returns almost all of its free cash flow. If investors treat Apple almost like a bond, the price makes sense, and the iPhone Duo and Siri AI cycle could keep growth above our 3% to 5% for longer. The bear case is that the price leaves no room for error: it needs a discount rate close to the risk-free rate or growth far above Apple's long-run history, while Services growth is slowing and regulators are targeting the App Store and search payments.
What are the biggest risks for Apple stock?
- Valuation: the price implies a discount rate of about 5.2% on our cash flows. A rise in interest rates or in the risk premium investors demand would hit the shares hard.
- Services growth: Services growth slowed to 10% in the September quarter from 15% a year earlier. Services earn 44% of Apple's gross profit, so a further slowdown would weigh on profits.
- Regulation: App Store rules, payments from search partners and competition cases in the US, Europe and elsewhere could reduce Services revenue.
- China: Greater China grew 28% in fiscal 2026 and accounts for 17% of revenue, and it depends on trade relations and local competition.
- Tariffs and costs: tariff refunds added about 1 point to the September-quarter gross margin and 2 points in June. Those benefits will not repeat, and memory and component costs can change quickly.
- AI execution: if Siri AI fails to drive upgrades, the iPhone cycle could fade after the launch quarters, while R&D keeps rising.
Apple stock FAQ
What is Apple's fair value after Q3 2026?
The QSILabs discounted cash flow value for Apple (AAPL) is $116.01 per share as of 2 November 2026, about 66% below the $338.32 close that day. It uses a 10.86% discount rate and 2.5% terminal growth. Across our sensitivity grid, the value ranges from $104 to $135. It is a QSILabs estimate, not a price target or a recommendation.
Is Apple stock a buy after Q3 2026 earnings?
We do not make buy or sell recommendations. On our model, the $338.32 price is about 2.9 times our $116.01 value, so the shares only make sense if you accept a discount rate near 5% or much faster long-run growth than our base case. Apple's results were strong: revenue rose 12% and beat its own outlook.
How much revenue did Apple make in Q3 2026?
Apple's revenue was $114,477m in the quarter to 26 September 2026, which is its fiscal Q4 2026 and calendar Q3 2026, up 12% from $102,466m a year earlier and a September-quarter record. Products made $82,904m and Services $31,573m. Fiscal 2026 revenue was $478,834m, up 15%.
How did iPhone sales do in Q3 2026?
iPhone revenue rose 17% to $57,583m in the September quarter, a record for the quarter, after 22% growth in the June quarter. Fiscal 2026 iPhone revenue was $254,098m, up 21%. The quarter includes the first weeks of iPhone 18 Pro and iPhone 18 Pro Max sales; iPhone Duo went on sale in October, after the quarter ended.
How fast did Apple Services grow in Q3 2026?
Services revenue grew 10% to $31,573m, an all-time high, but the slowest growth of the past five quarters. Fiscal 2026 Services revenue was $123,301m, up 13%, with a gross margin of about 76%.
Why did Apple's gross margin fall in Q3 2026?
Apple's gross margin was 47.9% in the September quarter, down from 50.1% in the June quarter but up from 47.2% a year earlier. Tariff refunds added about 1 point in September and about 2 points in June, and the products margin fell to 37.2% from 40.1% in a launch quarter.
How much did Apple spend on buybacks in fiscal 2026?
Apple repurchased $86,390m of its shares and paid $15,721m of dividends in fiscal 2026, a total of $102,111m, against free cash flow of $136,056m. The quarterly dividend is $0.27 per share.
What is Apple's guidance for Q1 fiscal 2027?
Apple does not give guidance in its earnings release. It gives a December-quarter outlook on its conference call, held on 2 November 2026, and no transcript was available when we published. Our model assumes fiscal 2027 revenue of $503.1bn, up 5%.
Sources
- Apple Inc., fiscal Q4 2026 earnings release (Form 8-K, Exhibit 99.1, 2 Nov 2026; accession 0000320193-26-000024) www.sec.gov
- Apple Inc., fiscal Q3 2026 earnings release (Form 8-K, Exhibit 99.1, 30 Jul 2026; accession 0000320193-26-000018) www.sec.gov
- Apple Inc., Form 10-Q for the quarter ended 27 June 2026 (accession 0000320193-26-000020) www.sec.gov
- Apple Inc., fiscal Q2 2026 earnings release (Form 8-K, Exhibit 99.1, 30 Apr 2026; accession 0000320193-26-000011) www.sec.gov
- Apple Inc., fiscal Q1 2026 earnings release (Form 8-K, Exhibit 99.1, 29 Jan 2026; accession 0000320193-26-000005) www.sec.gov
- Apple Inc., Form 10-K for the year ended 27 September 2025 (accession 0000320193-25-000079) www.sec.gov
- Apple Inc., fiscal Q4 2025 earnings release (Form 8-K, Exhibit 99.1, 30 Oct 2025; accession 0000320193-25-000077) www.sec.gov
- Apple fiscal Q3 2026 earnings call transcript (The Motley Fool), source of the July outlook www.fool.com
- MacRumors, Apple to report Q4 2026 earnings on November 2 (6 Oct 2026), launch timing of iPhone 18 Pro and iPhone Duo www.macrumors.com
- SEC EDGAR, Apple Inc. filings (CIK 0000320193) www.sec.gov
- Yahoo Finance chart data: AAPL daily closes (to 2 Nov 2026) query1.finance.yahoo.com
- Aswath Damodaran, cost of capital by industry (NYU Stern, January 2026 update) pages.stern.nyu.edu
- QSILabs Apple discounted cash flow model (internal, valuation date 2 Nov 2026)
Disclaimer
This article is for information only and is not investment advice or a recommendation to buy or sell any security. Values, forecasts and scenarios are QSILabs estimates based on public information and our own assumptions, and they may be wrong. Reported figures come from Apple's Form 8-K earnings releases; prices are as of the 2 November 2026 close. QSI Labs may hold positions in securities mentioned. For more of our work, see the QSI Labs research index.
More from QSI Labs
Read our white paper, QSI Labs: An AI-Native Trading Firm Built on a Training Loop (October 2026), available on request, or browse the research index.