Research / Earnings and valuation
Philip Morris Stock Q3 2026:Revenue Up 5.5% as IQOS, ZYN and Pricing Lift Profit
As of: Figures are as of Philip Morris International's third-quarter 2026 results (quarter ended 30 September 2026, reported 21 October 2026 in a Form 8-K) and its Form 10-Q for the quarter (filed 23 October 2026). PMI reports on a calendar year, so Q3 2026 is the July-September quarter. The share price is the NYSE close of PM on 30 October 2026, $208.79. Analyst estimates are S&P Global consensus as shown by StockAnalysis (updated 28 October 2026). Published 2 November 2026.
The short answer. Philip Morris stock Q3 2026 coverage starts with a strong quarter. Philip Morris International (NYSE: PM) grew net revenues 5.5% to $11.4bn in the three months to 30 September 2026, or 7.1% on an organic basis, and operating income rose 14.1% to $4.87bn. Price increases on cigarettes did most of the work: international combustibles pricing rose 8.9%, while smoke-free volumes grew a slower 2.7% as heated tobacco shipments to Japan lapped a tough comparison. In the US, ZYN nicotine pouch shipments rose 4.2% and segment revenue jumped 22.7%. Adjusted diluted EPS rose 5.4% to $2.36 and PMI now expects 2026 adjusted EPS of $8.29 to $8.44. Our discounted cash flow model puts Philip Morris at $146.56 a share, against a $208.79 close on 30 October 2026. The business is growing and highly cash generative; the question is how much of that growth the share price, up about 44% in a year, already assumes.
Key takeaways
- Revenue and profit up. Q3 2026 net revenues were $11,438m, up 5.5% from $10,845m (7.1% organic). Operating income rose 14.1% to $4,866m, a GAAP operating margin of 42.5% against 39.3% a year earlier. PMI described revenue, gross profit and operating income as a new quarterly high for the group.
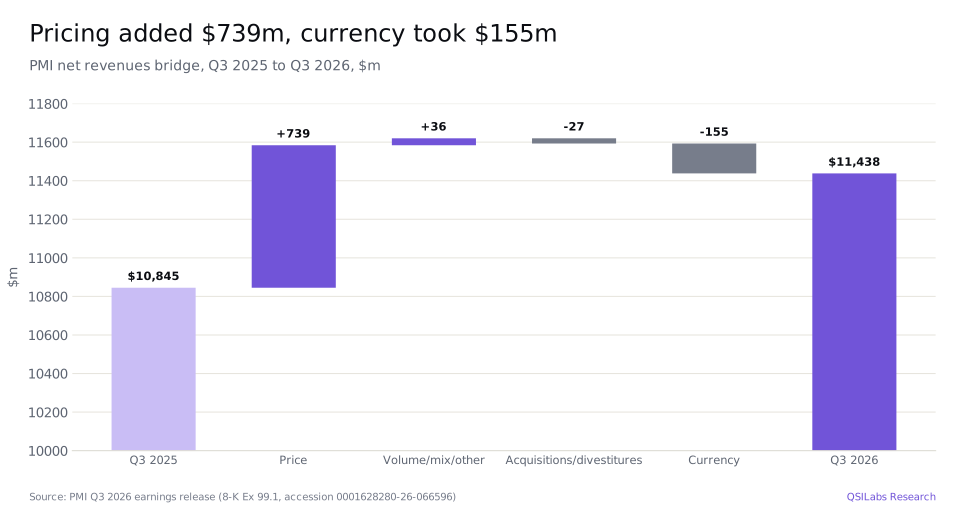
- Pricing carried the quarter. Of the $593m rise in net revenues, pricing contributed $739m and volume and mix $36m, while currency cost $155m and divestitures $27m. International combustibles pricing rose 8.9%.
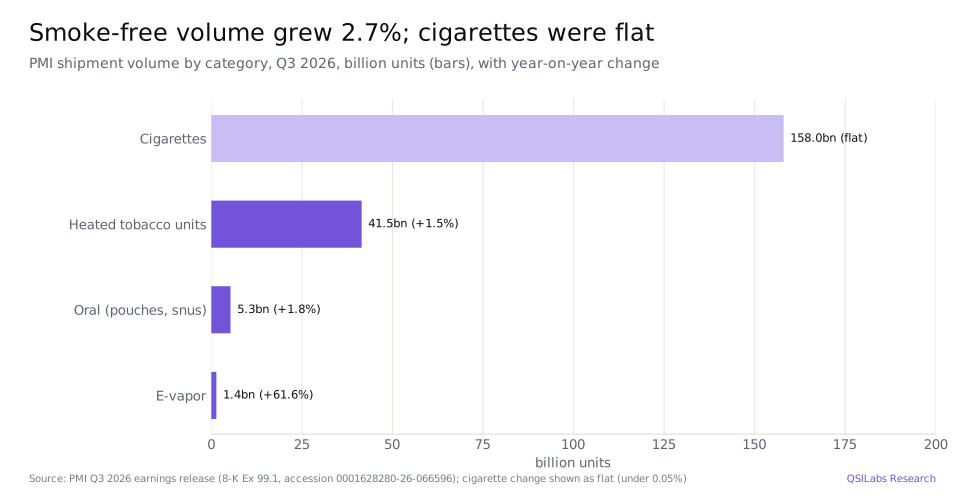
- Smoke-free grew more slowly. Smoke-free shipments rose 2.7% to 48.2bn units, and smoke-free products were more than 40% of net revenues (about 42% year to date). IQOS heated tobacco unit shipments rose 1.5% to 41.5bn; VEEV e-vapor shipments rose 61.6%.
- ZYN kept growing in the US. US ZYN shipments rose 4.2% to 3.2bn pouches and US segment revenue rose 22.7% to $845m, but segment operating income fell 3.3% as PMI stepped up marketing.
- EPS split. Reported diluted EPS fell 4.9% to $2.12, mainly on a non-cash fair value adjustment to equity investments; adjusted diluted EPS rose 5.4% to $2.36.
- Guidance held except for currency. PMI expects 2026 adjusted diluted EPS of $8.29 to $8.44, up 9.9% to 11.9%, organic revenue growth of 5% to 7% and operating cash flow of about $13.5bn, with no share buybacks.
- Our value: $146.56 a share, about 30% below the $208.79 close on 30 October 2026, as of 2 November 2026. A two-stage cross-check gives $145.00; analysts' average price target is $211.47.
Key numbers from Philip Morris's Q3 2026 earnings
| Metric | Q3 2026 | Q3 2025 | Change |
|---|---|---|---|
| Net revenues | $11,438m | $10,845m | +5.5% |
| Organic net revenue growth | +7.1% | ||
| Gross profit | $7,854m | $7,361m | +6.7% |
| Operating income | $4,866m | $4,263m | +14.1% |
| GAAP operating margin | 42.5% | 39.3% | +3.2pt |
| Adjusted operating income | $5,117m | $4,670m | +9.6% |
| Adjusted operating margin | 44.7% | 43.1% | +1.6pt |
| Diluted EPS | $2.12 | $2.23 | -4.9% |
| Adjusted diluted EPS | $2.36 | $2.24 | +5.4% |
| Total shipments | 206.2bn units | +0.6% | |
| Smoke-free shipments | 48.2bn units | +2.7% | |
| IQOS heated tobacco units | 41.5bn | +1.5% | |
| US ZYN shipments | 3.2bn pouches | +4.2% |
Sources: PMI Q3 2026 earnings release (Form 8-K, Exhibit 99.1); margins are QSILabs calculations from reported figures.
What did Philip Morris report for Q3 2026?
Philip Morris International reported its third-quarter results on 21 October 2026 and filed its Form 10-Q on 23 October. PMI reports on a calendar year, so Q3 2026 is simply July to September. The headline numbers were good on almost every line that PMI controls. Net revenues rose 5.5% to $11,438m, the highest of the eleven quarters since the start of 2024 in its SEC filings, and gross profit rose 6.7% to $7,854m. Marketing, administration and research costs fell 2.1% to $2,993m, partly because the prior-year quarter carried larger one-off charges, so operating income grew more than twice as fast as revenue.
On PMI's organic measure, which strips out currency and acquisitions, revenue grew 7.1% and operating income 10.5%. The gap between reported and organic growth is mostly currency: a stronger dollar against some of PMI's markets cut revenue by $155m against the prior year. For the first nine months, net revenues were $32,776m, up 8.2% (5.9% organic), and operating income was $13,289m, up 15.4% (7.7% organic).
- 1 Apr 2026First excise-driven price increase in Japan (JPY40 per pack)8-K Ex 99.1
- 30 Jun 2026FDA grants modified-risk (MRTP) authorisation to 20 ZYN flagship variants8-K Ex 99.1
- 21 Aug 2026FDA grants PMTA marketing authorisation to 11 ZYN ULTRA variants; ZYN now has 31 authorised variants8-K Ex 99.1
- 18 Sep 2026Board raises the quarterly dividend 8.8% to $1.60 a share ($6.40 annualised)Form 8-K
- 30 Sep 2026Q3 2026 ends: cash $6.7bn, total debt $47.6bnForm 10-Q
- 1 Oct 2026Second excise-driven price increase in Japan (JPY20 per pack)8-K Ex 99.1
- 2 Oct 2026Record and ex-dividend date for the $1.60 dividendForm 8-K
- 21 Oct 2026Q3 results: revenues $11.4bn (+5.5%), adjusted EPS $2.36; 2026 forecast updated for currency only8-K Ex 99.1
- 23 Oct 2026Form 10-Q for the quarter filedSEC EDGAR
- 26 Oct 2026$1.60 dividend paidForm 8-K
- 30 Oct 2026PM closes at $208.79 on the NYSE, the price used in our valuationYahoo Finance
Group CEO Jacek Olczak called it "another excellent quarter, with growing total volumes, double-digit organic operating income growth and robust margin expansion", and said PMI was on track for a sixth consecutive year of volume growth. Total shipments rose 0.6% to 206.2bn units: cigarettes were flat at 158.0bn and smoke-free products rose 2.7% to 48.2bn.
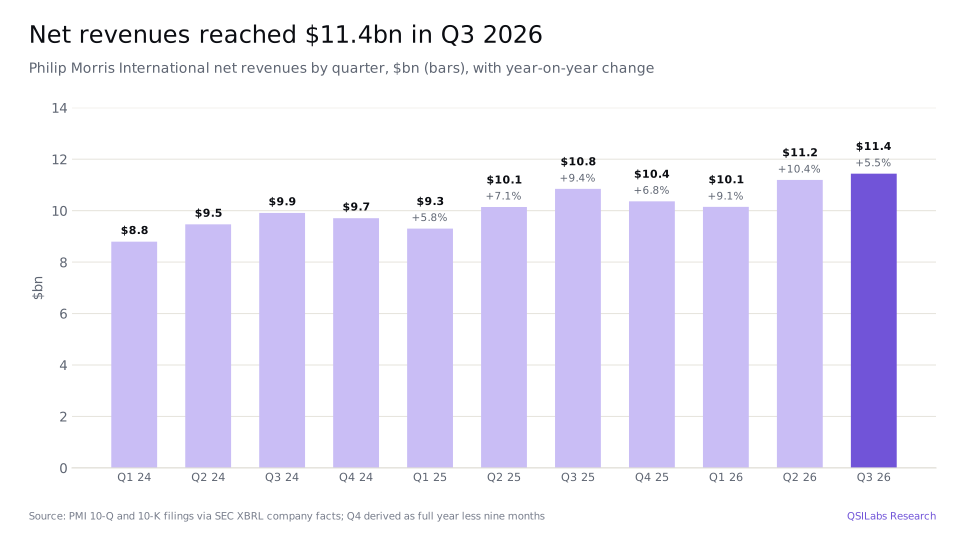
The bridge from last year shows where the growth came from. Pricing added $739m across the group, of which $565m came from international combustibles, $153m from the US and $21m from international smoke-free. Volume, mix and other items added only $36m: higher heated tobacco and e-vapor volumes added $108m in the smoke-free segment, but a less favourable mix of cigarette markets subtracted $75m.
How fast is PMI's smoke-free business growing?
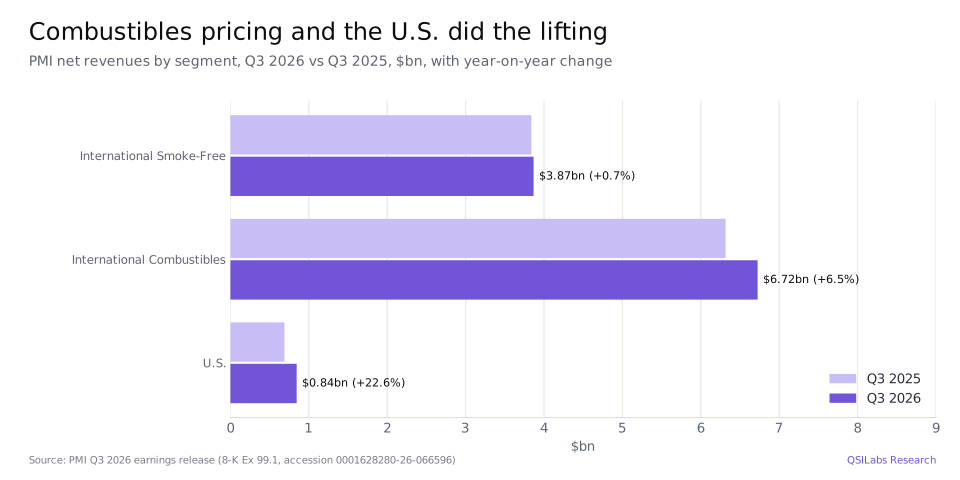
The International Smoke-Free segment, which holds IQOS heated tobacco, international ZYN and other oral products and VEEV e-vapor, grew net revenues just 0.7% to $3,867m, or 3.4% organically. Shipments rose 2.7%, but PMI said the quarter faced a challenging heated tobacco comparison because of the timing of shipments between periods, notably in Japan. Consumer demand looked stronger than shipments: adjusted in-market sales, PMI's closest proxy for consumer offtake, accelerated to 8.0% growth in the segment.
IQOS is the core of the smoke-free business. Heated tobacco unit shipments rose 1.5% to 41.5bn, and IQOS reached 9.9% of combined cigarette and heated tobacco industry volumes in the markets where it is sold, up 1.0 percentage point. PMI estimates that it holds around three-quarters of global heated tobacco volume. Heated tobacco adjusted in-market sales grew 7.1%, and 10% excluding Japan and Poland.
- Japan. Adjusted in-market sales grew 3.4%, or 1.3% excluding pantry-loading ahead of an excise-driven price increase of JPY20 a pack on 1 October, which followed a JPY40 increase on 1 April. IQOS held a 68% share of the heated tobacco category.
- Europe. Adjusted in-market sales grew an estimated 6.0% despite disruption in Ukraine and a characterising flavour ban in Poland, and IQOS's adjusted share rose 0.9 points to 11.6%.
- Rest of the world. Outside Europe and Japan, adjusted in-market sales grew 12.7%.
The other smoke-free categories are smaller but growing. International modern oral volume, mainly ZYN, rose 20.6% to 0.5bn pouches and ZYN is now sold in 62 international markets, although total international oral volume rose only 0.5% because of declines in legacy Nordic snus. VEEV e-vapor shipments rose 61.6% to 1.4bn units. Across the group, smoke-free products are sold in 110 markets and more than 30 of them get over half their PMI revenue from smoke-free.
How is ZYN doing in the United States?
The US segment, built mainly on the 2022 acquisition of Swedish Match, sells ZYN nicotine pouches, snus, cigars and a wellness business. US net revenues rose 22.7% to $845m and gross profit rose 24.2% to $539m. ZYN shipments grew 4.2% to 3.2bn pouches, against a tough comparison with a promotional campaign a year earlier, and PMI said ZYN's category share rose by more than 100 basis points between June and September, as estimated by Nielsen.
Profit did not keep pace. US operating companies income fell 3.3% (it rose 1.5% organically), and adjusted operating companies income was $171m, because PMI increased commercial investment behind new products. Over the summer the FDA granted marketing authorisation under the premarket tobacco product application (PMTA) route to 11 variants of ZYN ULTRA, a higher-nicotine pouch, bringing ZYN to 31 authorised variants, and on 30 June it granted modified-risk tobacco product (MRTP) authorisation to 20 ZYN flagship variants. PMI says it will spend more on the brand in the fourth quarter, including a wider "When It Clicks" campaign and moving most flagship ZYN products from 15-pouch to 20-pouch cans.
Why are cigarette revenues still rising?
Cigarettes are still the largest part of PMI. The International Combustibles segment had $6,725m of net revenues in Q3 2026, 59% of the group, up 6.5% (7.8% organic). Shipment volume was broadly flat at 158.0bn: growth in Turkey, Indonesia and Egypt offset declines in markets such as Russia, Poland and Japan. With volume flat, revenue growth came from price, which rose 8.9%, and from the restructuring of distribution terms in certain markets, which PMI says is not expected to recur at the same level in future quarters.
PMI's share of the cigarette category rose 0.4 points to 25.9%, and Marlboro gained 0.5 points to an 11.4% share, which PMI described as a record. Gross profit in the segment rose 8.6% to $4,610m, slightly held back by higher energy-related input costs. Over nine months, though, international cigarette shipments were down 1.2%, and PMI expects a full-year cigarette decline similar to that year-to-date trend.
What is happening to Philip Morris's margins and earnings per share?
Margins widened. PMI's adjusted gross margin rose 0.8 points to 68.7% and its adjusted operating income margin rose 1.6 points to 44.7%. On a GAAP basis, operating income was 42.5% of net revenues in Q3 2026, against 39.3% a year earlier and the highest of the last eleven quarters. Part of the GAAP improvement came from smaller adjusting items: these reduced operating income by $251m in Q3 2026 against $407m a year earlier.
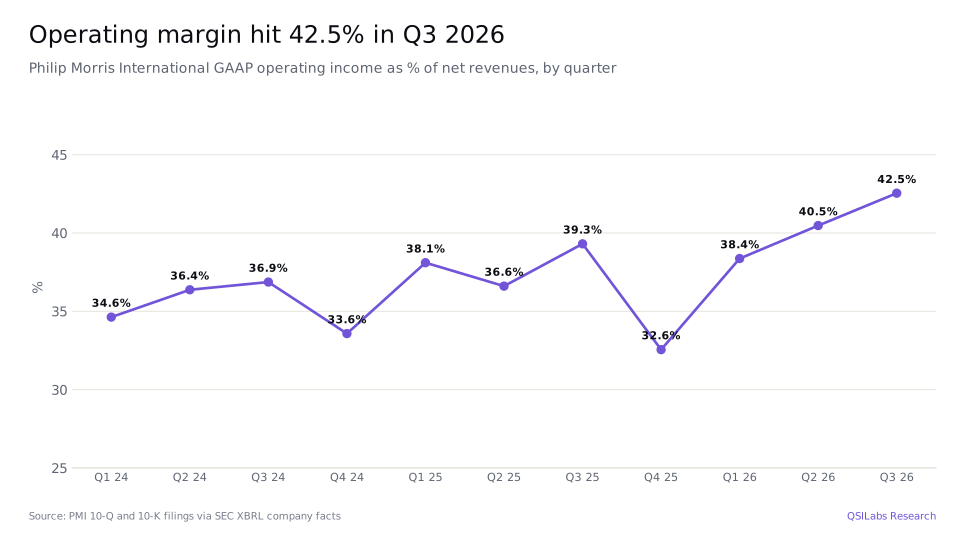
Earnings per share moved in opposite directions. Reported diluted EPS fell 4.9% to $2.12 from $2.23, mainly because of a non-cash fair value adjustment for equity security investments (a $0.06 charge, against a $0.07 gain a year earlier) and a $0.04 loss on buying out a Dutch pension plan. The prior-year quarter also included several one-off items, among them a $0.10 Germany excise tax litigation charge, a $0.09 impairment of a wellness investment and $0.14 of tax benefits. Excluding these items, adjusted diluted EPS rose 5.4% to $2.36, or 5.8% excluding a one-cent currency drag. Net earnings attributable to PMI were $3,313m against $3,478m. For nine months, reported diluted EPS was $5.48 (down 7.0%) and adjusted EPS $6.52 (up 11.8%), with the gap including a $0.33 a share impairment of PMI's equity investment in RBH, its former Canadian business.
What is Philip Morris's 2026 guidance?
PMI updated its full-year forecast for currency only. It now expects reported diluted EPS of $7.11 to $7.26 and adjusted diluted EPS of $8.29 to $8.44, up 9.9% to 11.9% from $7.54 in 2025. That includes a favourable currency effect of $0.18 a share, down from $0.24 previously; excluding currency, adjusted EPS growth would be 7.5% to 9.5%.
- Volumes: total cigarette and smoke-free shipments growing, with high single-digit smoke-free shipment growth.
- Revenue: organic net revenue growth of 5% to 7%, more likely in the middle or upper half, helped by a fourth-quarter reacceleration in international smoke-free.
- Profit: organic operating income growth of 7% to 9%, more likely in the middle or lower half, because of geopolitical cost pressures and higher US investment.
- Cash and tax: operating cash flow of about $13.5bn, capital expenditure of $1.4bn to $1.6bn and an effective tax rate of about 21.5%.
- Balance sheet: net debt of close to 2.0 times adjusted EBITDA by the end of 2026, and no share repurchases.
PMI flagged two specific headwinds. Energy-related inflation linked to the Middle East conflict raised costs in the third quarter and is expected to weigh slightly more in the fourth, and strikes on supply and logistics infrastructure in Ukraine have disrupted parts of the business. Analysts were close to the guidance after the results: S&P Global consensus, as shown by StockAnalysis on 28 October, was for 2026 revenue of $43.61bn and EPS of $8.35, rising to $45.72bn and $9.06 in 2027.
How much cash does Philip Morris generate, and where does it go?
PMI's cash flow is seasonal, with working capital absorbing cash early in the year. In the first nine months of 2026 operating cash flow was $10,445m, up from $7,524m, and capital expenditure was $1,115m, leaving free cash flow of about $9.3bn. Dividends took $6,903m, about two-thirds of operating cash flow. Net borrowing fell by $734m: PMI repaid $4,587m of long-term debt and raised $1,478m, while short-term borrowings rose. Cash ended the quarter at $6,683m.
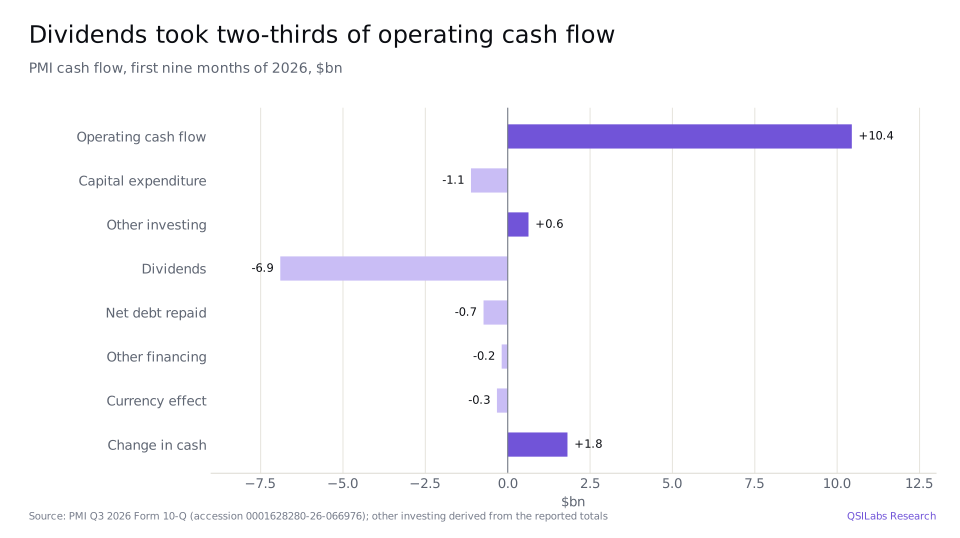
The dividend is the main use of cash. On 18 September the board raised the quarterly dividend 8.8% to $1.60 a share, an annualised $6.40, paid on 26 October to shareholders of record on 2 October. PMI says it has raised its dividend every year since becoming a public company in 2008, a cumulative increase of 248%, or 7.2% a year. At the 30 October price the annualised dividend is a yield of about 3.1%.
The balance sheet carries the debt from the Swedish Match purchase. At 30 September PMI had total debt of $47,562m ($2,525m of short-term borrowings, $3,328m of long-term debt due within a year and $41,709m due later), so net debt was about $40.9bn. It also had $6.0bn of undrawn committed revolving credit facilities. With no buybacks planned, cash beyond the dividend is going to debt reduction.
Philip Morris stock Q3 2026: is PM stock overvalued?
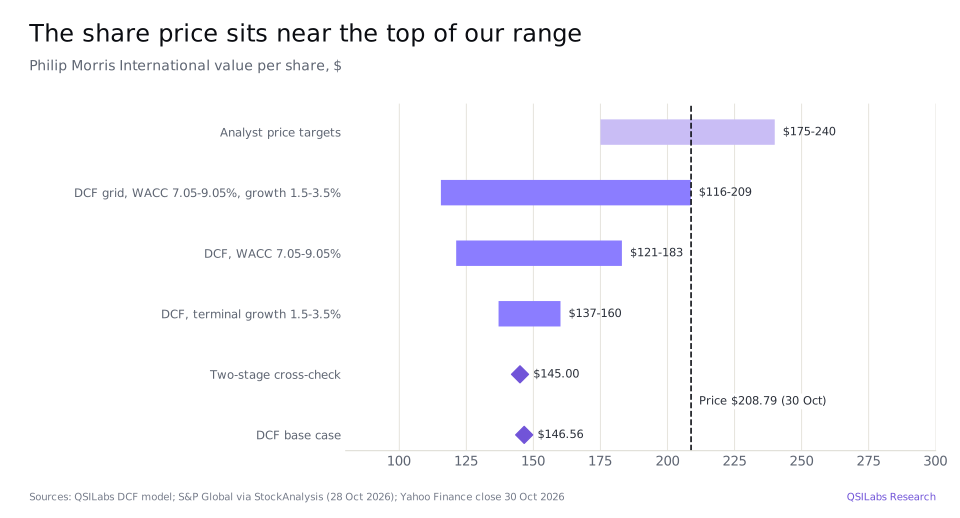
On our assumptions, yes. Our discounted cash flow model values Philip Morris International at $146.56 a share, against a close of $208.79 on 30 October 2026, about 30% lower. A two-stage cross-check, which fades returns on new investment toward the cost of capital, gives $145.00. At $208.79 and 1,559m shares outstanding, PMI's market value is about $325bn, roughly 25 times the midpoint of its 2026 adjusted EPS forecast and 23 times 2027 consensus EPS.
The shares have re-rated sharply. PM closed at $144.60 on 3 November 2025, so the 30 October close was about 44% higher a year later, and it was the highest close in that year of Yahoo Finance data. Analysts are more positive than our model: S&P Global consensus via StockAnalysis has an average price target of $211.47 from 16 analysts, with a range of $175 to $240, and an overall Buy rating.
Method
We forecast net revenues, operating income, tax, depreciation, capital spending and working capital for each year from 2026 to 2035, and discount the unlevered free cash flow at an 8.05% weighted average cost of capital, taken from Damodaran's January 2026 US industry data for tobacco. A bottom-up estimate gives a higher 9.49%, so our base rate is the less punitive of the two. After 2035 we assume 2.5% growth a year, with reinvestment consistent with that growth; the terminal value is 58.5% of enterprise value.
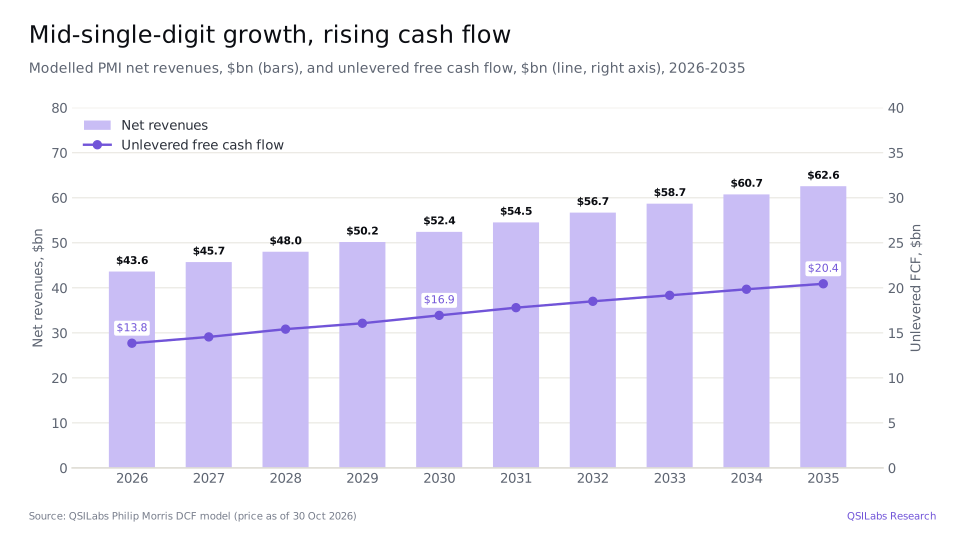
- Revenue: $43.61bn in 2026, in line with consensus, then growth of 4.85% in 2027, 5.0% in 2028, 4.5% in 2029 and 2030, 4.0% in 2031 and 2032 and 3.0% to 3.5% after that, reaching $62.57bn in 2035.
- Operating margin: 39.4% in 2026, rising to 40% in 2028 and 41% from 2031 as smoke-free products gain scale.
- Tax: 21.5%, in line with PMI's guidance.
- Investment: capital expenditure of $1.5bn in 2026, rising with revenue, against depreciation and amortisation of about $2.05bn.
That gives unlevered free cash flow of $13.8bn in 2026, rising to $16.9bn in 2030 and $20.4bn in 2035. Discounted, the explicit forecast is worth $112.7bn and the terminal value $158.7bn, for an enterprise value of $271.4bn. From that we subtract net debt of $40.9bn and $2.3bn of minority interests, and add a net $0.4bn of other items (PMI's $2.0bn of equity investments, less the $2.5bn dividend payable at 30 September, plus cash generated between quarter-end and the valuation date). The equity value of $228.6bn over 1,560m diluted shares gives $146.56.
How the number moves if you argue with us
The value is most sensitive to the cost of capital and terminal growth, as it is for any steady, long-lived cash generator.
| WACC \ terminal growth | 1.5% | 2.0% | 2.5% | 3.0% | 3.5% |
|---|---|---|---|---|---|
| 7.05% | $166.3 | $173.8 | $183.0 | $194.3 | $208.7 |
| 7.55% | $150.5 | $156.2 | $163.0 | $171.2 | $181.4 |
| 8.05% | $137.0 | $141.4 | $146.6 | $152.7 | $160.1 |
| 8.55% | $125.5 | $128.9 | $132.9 | $137.5 | $143.0 |
| 9.05% | $115.5 | $118.2 | $121.2 | $124.7 | $128.9 |
Only the most generous corner of the grid, a 7.05% cost of capital with 3.5% growth for ever, reaches the share price. Put differently, the market is pricing PMI as if smoke-free growth will keep revenue compounding well above inflation for decades, or as if its cash flows deserve a cost of capital closer to a utility's than a consumer company's. Either may prove right. Revenue growth faster than our mid-single-digit path, or operating margins above 41% as heated tobacco and pouches scale, would also close part of the gap. But at our central assumptions, the shares price in a lot of good news.
What are the main risks for Philip Morris stock?
- Regulation and taxes. Excise increases, flavour bans (as in Poland), restrictions on heated tobacco, e-vapor or nicotine pouches, and FDA decisions on product applications can change volumes and prices quickly in individual markets.
- Litigation. PMI's 10-Q describes US lawsuits alleging nicotine addiction from ZYN or deceptive ZYN marketing, including the Kelly, Bates-Ferreira, Norris and Siegert putative class actions and a suit by the City of Baltimore, alongside long-running tobacco litigation in other countries.
- Japan and IQOS growth. In Japan, where IQOS holds 68% of the heated tobacco category, in-market growth slowed to 1.3% excluding pantry-loading after two excise-driven price rises in 2026; heated tobacco growth elsewhere has to offset that.
- US investment. The step-up in ZYN marketing and the move to 20-pouch cans could hold back US profit in the near term, and competition in nicotine pouches is intense.
- Currency and costs. Most of PMI's revenue is earned outside the US, so a stronger dollar reduces reported results, and energy-related cost inflation linked to the Middle East conflict is weighing on costs.
- Pricing power. Cigarette pricing of 8.9% is well above inflation in most markets; if smokers trade down or illicit trade grows, combustible revenue could stop growing.
- Debt. Total debt of $47.6bn limits buybacks until leverage falls, and higher interest rates would raise refinancing costs.
For comparison with other consumer staples, read our Coca-Cola stock Q3 2026 and Procter & Gamble stock Q3 2026 analyses.
FAQ
What is the Philip Morris share price compared with the QSILabs DCF value after Q3 2026?
Our discounted cash flow model values Philip Morris International at $146.56 a share, against a close of $208.79 on 30 October 2026, about 30% lower. The value assumes revenue growth of about 3% to 5% a year, an operating margin rising from 39.4% to 41%, an 8.05% cost of capital and 2.5% terminal growth. Analysts' average price target is $211.47.
Is Philip Morris stock a buy after Q3 2026?
We do not make buy or sell recommendations. On our assumptions the share price is above the value of PMI's expected cash flows, and it would take a cost of capital of about 7% with 3.5% growth for ever to justify $208.79. Most analysts rate the shares Buy, with an average target of $211.47.
How much revenue did Philip Morris make in Q3 2026?
PMI's net revenues were $11,438m in the third quarter of 2026, up 5.5% from $10,845m a year earlier and 7.1% on an organic basis. International Combustibles contributed $6,725m, International Smoke-Free $3,867m and the US $845m. Nine-month net revenues were $32,776m, up 8.2%.
What is IQOS and how much does it sell?
IQOS is PMI's heated tobacco system, which heats tobacco sticks rather than burning them. PMI shipped 41.5bn heated tobacco units in Q3 2026, up 1.5%, and IQOS had 9.9% of combined cigarette and heated tobacco volumes in its markets. PMI estimates it holds around three-quarters of global heated tobacco volume.
How many ZYN pouches did Philip Morris ship in the US in Q3 2026?
PMI shipped 3.2bn ZYN pouches in the US in Q3 2026, up 4.2% year on year. US segment net revenues rose 22.7% to $845m. The FDA authorised 11 ZYN ULTRA variants on 21 August 2026, bringing ZYN to 31 variants with marketing authorisation.
Why did Philip Morris's reported EPS fall while adjusted EPS rose?
Reported diluted EPS fell 4.9% to $2.12 mainly because of a non-cash fair value charge on equity investments and a Dutch pension buy-out loss, while the prior-year quarter included net one-off gains, notably tax items. Adjusted diluted EPS, which excludes these items and amortisation, rose 5.4% to $2.36.
What does Philip Morris expect for full-year 2026?
PMI forecasts 2026 adjusted diluted EPS of $8.29 to $8.44, up 9.9% to 11.9%, and reported diluted EPS of $7.11 to $7.26. It expects organic revenue growth of 5% to 7%, organic operating income growth of 7% to 9%, operating cash flow of about $13.5bn and capital spending of $1.4bn to $1.6bn.
How much is the Philip Morris dividend?
PMI pays a quarterly dividend of $1.60 a share, raised 8.8% from $1.47 in September 2026, or $6.40 a year, a yield of about 3.1% at the 30 October 2026 price. It paid $6.9bn of dividends in the first nine months of 2026 and has raised its dividend every year since 2008.
Is Philip Morris buying back shares?
No. PMI's 2026 forecast assumes no share repurchases, as it uses cash beyond the dividend to reduce debt toward a net debt to adjusted EBITDA ratio of close to 2.0 times by the end of 2026.
How much debt does Philip Morris have?
At 30 September 2026 PMI had total debt of $47.6bn and cash of $6.7bn, so net debt was about $40.9bn. It had $6.0bn of committed revolving credit facilities, all undrawn.
Sources
- Philip Morris International Inc., Q3 2026 earnings release (Form 8-K, Exhibit 99.1, 21 Oct 2026; accession 0001628280-26-066596) www.sec.gov
- Philip Morris International Inc., Q3 2026 non-GAAP measures, glossary and financial schedules (Form 8-K, Exhibit 99.2, 21 Oct 2026) www.sec.gov
- Philip Morris International Inc., Form 10-Q for the quarter ended 30 Sep 2026 (filed 23 Oct 2026; accession 0001628280-26-066976) www.sec.gov
- Philip Morris International Inc., dividend increase press release (Form 8-K, Exhibit 99.1, 18 Sep 2026; accession 0001628280-26-062621) www.sec.gov
- Philip Morris International Inc., Forms 10-K and 10-Q (EDGAR filing index, CIK 1413329) www.sec.gov
- SEC XBRL company facts for Philip Morris International (CIK 1413329): quarterly and annual net revenues, operating income, EPS and cash flow data.sec.gov
- StockAnalysis: Philip Morris forecast and analyst ratings, S&P Global data (last updated 28 Oct 2026; accessed 2 Nov 2026) stockanalysis.com
- Yahoo Finance chart data: PM closing prices and dividend history (one year to 2 Nov 2026) query1.finance.yahoo.com
- Damodaran Online: cost of capital by industry (US), January 2026 pages.stern.nyu.edu
- QSILabs Philip Morris International discounted cash flow model (internal; price as of 30 Oct 2026)
Disclaimer
This article is for information only and is not investment advice, a recommendation or an offer to buy or sell any security. QSI Labs and its authors may hold positions in the securities discussed. Forecasts and valuations are estimates that depend on assumptions that may prove wrong. Figures are taken from company filings and third-party sources believed to be reliable, but we do not guarantee their accuracy. Do your own research or consult a licensed adviser before investing.
More from QSI Labs
Related analysis: Coca-Cola stock Q3 2026, Procter & Gamble stock Q3 2026, Costco stock Q3 2026: membership fees and AbbVie stock Q3 2026.
Read our white paper, QSI Labs: An AI-Native Trading Firm Built on a Training Loop (October 2026), available on request, or browse the research index.