Research / Earnings and valuation
Procter & Gamble Stock Q3 2026:Volume Grows, Margins Shrink
As of: Figures are as of The Procter & Gamble Company's results for the quarter ended 30 September 2026, which is the first quarter of P&G's fiscal year 2027 (P&G's fiscal year runs from July to June). We call it Q3 2026 because it covers July to September 2026. Results were reported on 22 October 2026 in the earnings release (Form 8-K, Exhibit 99.1) and the Form 10-Q filed the same day. The share price is the NYSE close of PG on 30 October 2026, $161.57. Published 2 November 2026.
The short answer. Procter & Gamble stock Q3 2026 results, for the July to September quarter that P&G calls the first quarter of fiscal 2027, showed a company selling more but keeping less of each dollar. Net sales rose 4% to $23.3bn, organic sales also rose 4% on 2.4% higher volume, and core EPS rose 1% to $2.00. Gross margin fell 160 basis points to 49.8% as commodity costs and product reinvestment ate the gains, and P&G kept its full-year guidance unchanged. Our discounted cash flow model puts The Procter & Gamble Company at $97.18 per share, about 40% below the $161.57 close on 30 October 2026. P&G is a steady business. The share price assumes a much lower cost of capital than we use.
P&G's quarter to 30 September 2026 was driven by volume. Organic sales grew 4%, made up of 2 points of volume, 1 point of mix and a small positive effect from pricing, and all five reporting segments grew organic sales (P&G Q1 fiscal 2027 earnings release). Net earnings attributable to P&G were $4.73bn, or $1.97 a diluted share, against $4.75bn, or $1.95, a year earlier (Form 10-Q). The shares jumped 5.6% on results day, from $156.84 to $165.59, then settled at $161.57 by 30 October, 9.2% above their level a year earlier (Yahoo Finance).
In this article we go through P&G's Q3 2026 numbers against a year earlier, segment by segment, explain why margins fell, set out the fiscal 2027 guidance, the $3.9bn Thorne acquisition, cash flow, the dividend and the balance sheet, and then value PG stock, with every assumption laid out so you can argue with it.
Key takeaways
- Valuation: QSILabs values The Procter & Gamble Company (NYSE: PG) at $97.18 per share as of results for the quarter ended 30 September 2026, against a $161.57 close on 30 October 2026, about 40% below the market price. Our sensitivity range is about $81-120 a share.
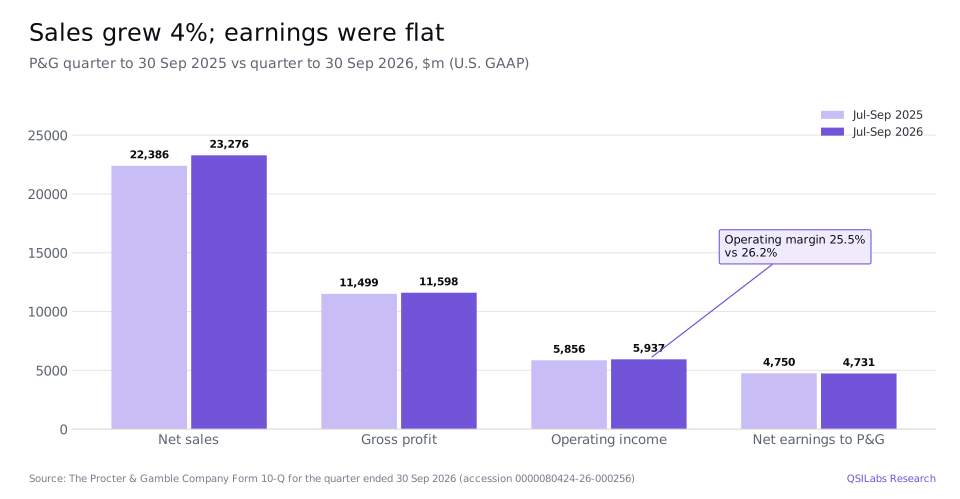
- Q3 2026 results: net sales were $23,276m in the quarter ended 30 September 2026, up 4.0% from $22,386m; operating income was $5,937m, up 1%; diluted EPS was $1.97, up 1%, and core EPS $2.00, up 1%. Currency-neutral core EPS was unchanged.
- Volume: organic volume grew 2.4%. Fabric & Home Care volume rose 4.3% and Baby, Feminine & Family Care 2.3%, while Health Care volume fell 2.9%.
- Margins: gross margin fell to 49.8% from 51.4% and operating margin to 25.5% from 26.2%. Commodities cost 140 basis points of core gross margin and product reinvestment another 140.
- Guidance kept: P&G still expects fiscal 2027 organic sales growth of 1-3% and core EPS of $6.89-7.11, a $7.00 midpoint; all-in sales growth is now 2-4% including Thorne.
- Cash and returns: operating cash flow was $5.8bn and free cash flow $4.4bn in the quarter; P&G returned $3.9bn and plans more than $10bn of dividends and about $5bn of buybacks in fiscal 2027. The quarterly dividend of $1.0885 is a 2.7% yield at $161.57.
Key numbers from P&G's Q3 2026 (fiscal Q1 2027) earnings
| July-September, $m | 2025 | 2026 | Change |
|---|---|---|---|
| Net sales | 22,386 | 23,276 | +4% |
| Cost of products sold | 10,887 | 11,678 | +7% |
| Gross profit | 11,499 | 11,598 | +1% |
| Selling, general and administrative expense | 5,643 | 5,661 | 0% |
| Operating income | 5,856 | 5,937 | +1% |
| Earnings before income taxes | 6,034 | 6,023 | 0% |
| Net earnings attributable to P&G | 4,750 | 4,731 | 0% |
| Diluted EPS ($) | 1.95 | 1.97 | +1% |
| Core EPS ($, non-GAAP) | 1.99 | 2.00 | +1% |
| Diluted weighted average shares (m) | 2,436.8 | 2,407.2 | -1% |
Source: P&G Form 10-Q for the quarter ended 30 September 2026, consolidated statements of earnings (accession 0000080424-26-000256), and the earnings release for core EPS. Gross margin was 49.8% against 51.4% a year earlier and the effective tax rate was 21.0% against 20.8%.
Procter & Gamble Q3 2026 earnings: what happened
P&G grew sales but not profit in Q3 2026. Net sales rose $890m to $23,276m, but cost of products sold rose $791m, so gross profit grew only $99m. SG&A was almost flat at $5,661m, and its share of sales fell 90 basis points to 24.3% as productivity savings and sales leverage offset more reinvestment. Operating income rose $81m to $5,937m, a margin of 25.5% against 26.2% (10-Q).
Below operating income, interest expense rose to $223m from $197m and interest income slipped to $102m from $108m. Other non-operating income was $207m against $268m. Earnings before income taxes were $6,023m, $11m lower than a year earlier, and taxes rose slightly to $1,267m. Net earnings attributable to P&G were $4,731m, down $19m. Because P&G bought back shares, the diluted share count fell 1.2% to 2,407.2m and diluted EPS still rose 1% to $1.97.
Core EPS, which excludes incremental restructuring charges from P&G's two-year productivity programme, was $2.00 against $1.99. The company said currency-neutral core EPS was unchanged. Its chief executive, Shailesh Jejurikar, called it a "strong start" that keeps P&G on track to deliver within its guidance ranges (earnings release).
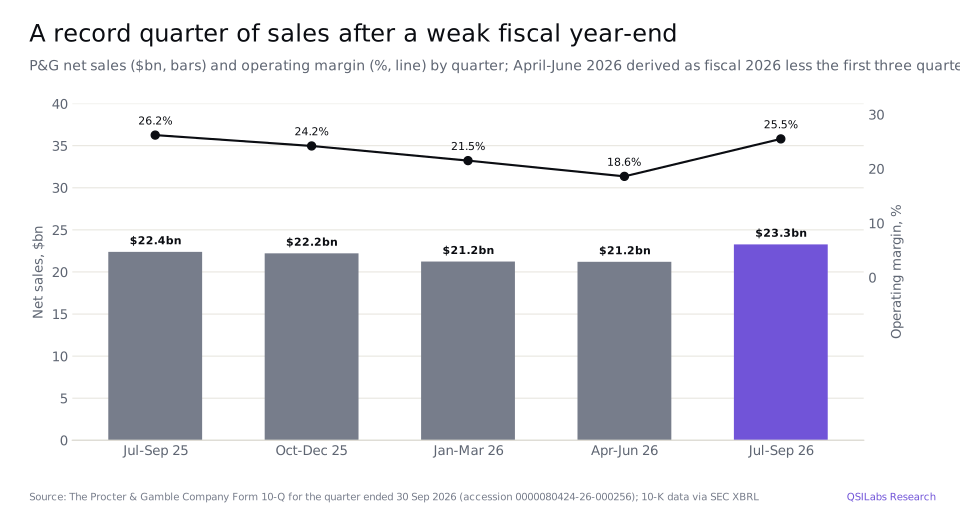
The quarter also stands out against the end of the last fiscal year. Using SEC XBRL data, P&G's operating margin fell from 26.2% in July-September 2025 to 24.2% in October-December, 21.5% in January-March and 18.6% in April-June 2026, the last derived as fiscal 2026 operating income of $19,748m less the first three quarters. P&G's first fiscal quarter is usually its strongest, so the 25.5% margin is a seasonal recovery rather than a new trend, but sales of $23.3bn were the highest of the five quarters shown.
- 30 Sep 2026Quarter ends; P&G holds $15.4bn of cash after raising short-term debt ahead of the Thorne deal10-Q
- 1 Oct 2026P&G completes the $3.9bn all-cash acquisition of Thorne, a premium vitamins and supplements brand10-Q
- 13 Oct 2026Annual meeting: all directors elected, say-on-pay approved, shareholder proposals defeated8-K, 16 Oct 2026
- 22 Oct 2026Q1 fiscal 2027 results and 10-Q; organic sales and EPS guidance kept; PG closes at $165.59, up 5.6% on the day8-K Ex 99.1; Yahoo Finance
- 23 Oct 2026Shares go ex-dividend for the $1.0885 quarterly dividendYahoo Finance
- 30 Oct 2026P&G issues $4.0bn of fixed-rate notes due 2031 to 2056; PG closes at $161.578-K, 30 Oct 2026; Yahoo Finance
- 2 Nov 2026P&G issues $352m of floating rate notes due 20768-K, 2 Nov 2026
How did each P&G segment do in Q3 2026?
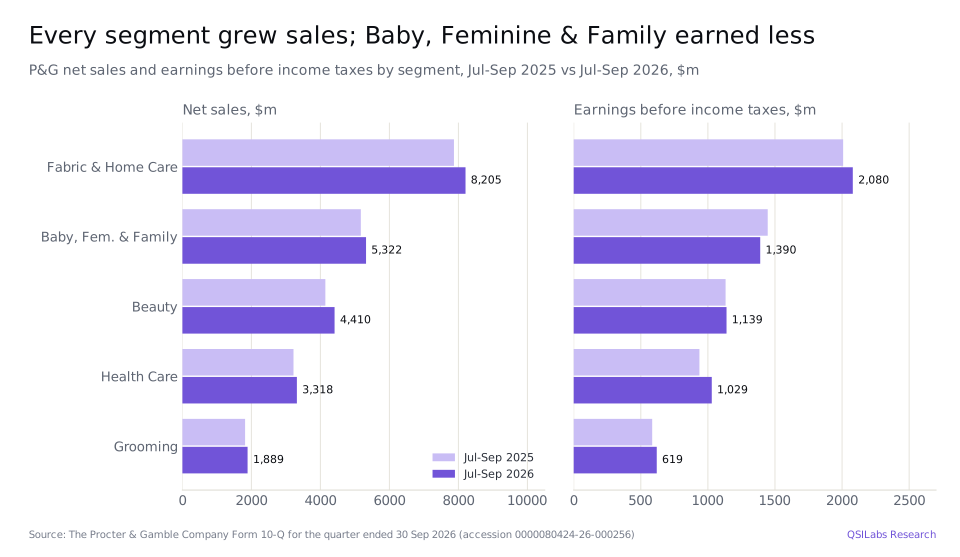
All five P&G segments grew net sales in Q3 2026, by between 3% and 6%. Earnings were more mixed: Health Care grew pre-tax earnings 10% and Grooming 6%, but Baby, Feminine & Family Care earned 4% less and Beauty only 1% more. In this quarter P&G moved its Habitat Care business, pest prevention and outdoor care, from Corporate into Fabric & Home Care and restated the prior year (10-Q, note 2).
Fabric & Home Care
Fabric & Home Care, P&G's largest segment with 35% of sales, grew net sales 4% to $8.2bn. Volume rose 4.3% on market growth and distribution gains, and organic sales rose 4.8%; pricing was slightly negative and currency took 0.6 points. Global market share rose 0.3 points, with Fabric Care up 0.4 points. Pre-tax earnings rose 4% to $2,080m and net earnings 3% to $1,601m, but gross margin fell 290 basis points on higher commodity costs, product investments and mix, offset by lower marketing and overhead spending (10-Q).
Baby, Feminine & Family Care
Baby, Feminine & Family Care grew net sales 3% to $5.3bn on 2.3% higher volume and 1.8 points of mix, with pricing down 1.2 points. Baby Care organic sales grew mid-single digits, including more than 40% growth in Greater China, and Baby Care's global share rose 0.8 points. Family Care, mainly paper towels and toilet paper in North America, grew low single digits but lost 0.5 points of share. This was the weakest segment for profit: pre-tax earnings fell 4% to $1,390m as gross margin dropped 220 basis points on commodity costs and merchandising investments.
Beauty
Beauty net sales rose 6.4% to $4.4bn, the fastest of any segment, with organic sales up 5.4% on 2.2% volume, 2.5 points of mix and 0.7 points of pricing. Hair Care, Personal Care and Skin Care all grew organic sales mid-single digits, and SK-II helped mix. Net earnings still fell 1% to $868m because gross margin fell 90 basis points and P&G spent more on marketing. Beauty's global share fell 0.2 points, and Skin Care's 0.6 points.
Health Care
Health Care net sales rose 3% to $3.3bn and organic sales 2.7%. Volume fell 2.9%, the only large volume decline in the group, because of fewer coughs and colds in Latin America and North America, exits from some markets under the restructuring plan and competitive activity in North America Oral Care. Pricing and mix each added about 3 points. Gross margin rose 200 basis points on pricing, tariff recoveries and productivity, and pre-tax earnings rose 10% to $1,029m. Personal Health Care gained 0.5 points of share; Oral Care lost 0.6 points. Thorne will be reported in this segment from October.
Grooming
Grooming, the smallest segment, grew net sales 4% to $1.9bn and organic sales 4.5%, almost all from innovation-based pricing of 3.5 points and mix of 1.5 points; volume fell 0.4%. Gross margin rose 60 basis points and pre-tax earnings rose 6% to $619m. Global share rose 0.2 points.
What drove P&G's organic sales growth in Q3 2026?
Volume drove P&G's organic sales growth in Q3 2026. Organic volume rose 2.4% for the group, while pricing added only 0.4 points and mix 1.1 points (earnings release). That is a change from the past few years, when price increases did most of the work. The volume came mainly from Fabric & Home Care and Baby Care, helped by distribution gains in North America and strong growth in Greater China, where Baby Care organic sales rose more than 40%.
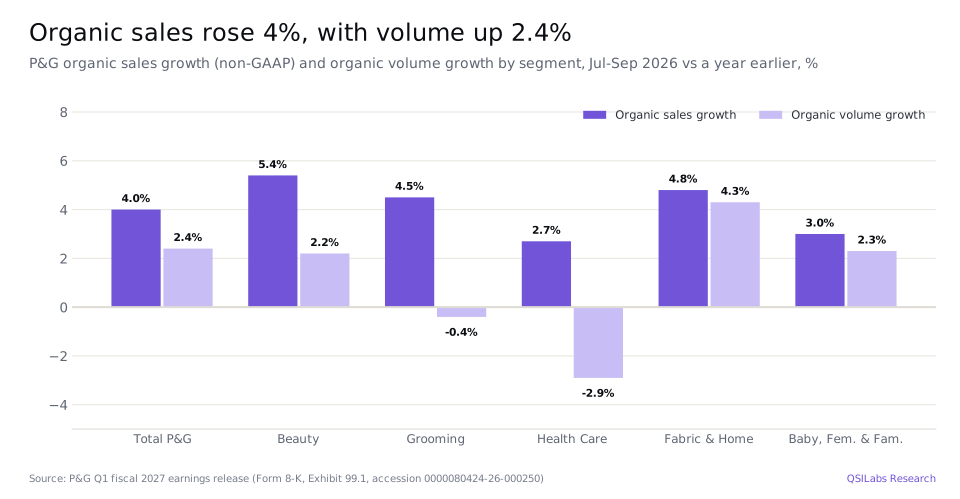
Two things are worth noting. First, some of the volume came with lower prices: pricing was negative in Fabric & Home Care and in Baby, Feminine & Family Care, where P&G cut prices in North America Baby Care and spent more on merchandising in Family Care. Second, P&G is deliberately walking away from some sales. The organic guidance for fiscal 2027 includes a headwind of 30-50 basis points from brand, product form and go-to-market discontinuations, and the 10-Q cites these exits for lower volume in IMETA hair care, Grooming, Oral Care and Feminine Care.
Why did P&G's margins fall in Q3 2026?
P&G's margins fell because costs rose faster than prices. Core gross margin, which excludes incremental restructuring charges, fell 150 basis points. Higher commodity costs took 140 basis points, product reinvestment, meaning spending to make products better at the same price, another 140, unfavourable mix 50 and other items 10. Gross productivity savings gave back 120 basis points, lower tariff costs and recovered tariffs 50 and pricing 20 (earnings release).
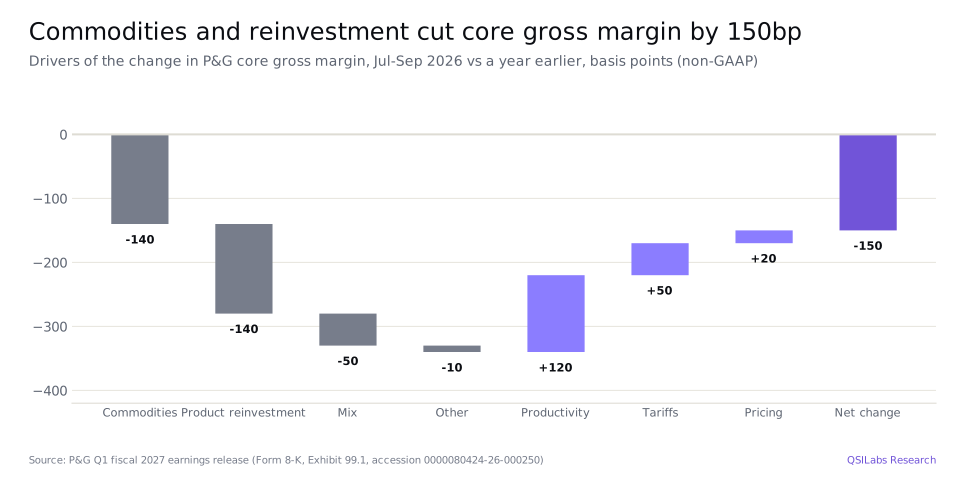
SG&A offset part of the gross margin loss. Core SG&A fell 80 basis points as a share of sales, as 130 basis points of productivity savings and 100 basis points of sales leverage more than covered 120 basis points of extra reinvestment. Core operating margin fell 80 basis points, or 90 basis points in constant currency, even after 250 basis points of total productivity savings.
The pressure is not a one-quarter event. P&G now expects commodity costs to be a headwind of about $1.4bn after tax in fiscal 2027, with higher raw material, energy and transportation costs. Add $300m from higher net interest expense, $150m from lower non-operating income and $50m from currency, and the company puts the total drag at $0.79 a share, or 11 points of core EPS growth. P&G is spending its productivity savings on better products and marketing rather than letting them reach profit, a choice that supports volume but limits earnings growth this year.
What is P&G's fiscal 2027 guidance?
P&G kept its fiscal 2027 guidance for organic sales and EPS and raised all-in sales growth for the Thorne acquisition. The fiscal year runs from 1 July 2026 to 30 June 2027.
| Fiscal 2027 guidance item | After Q1 fiscal 2027 |
|---|---|
| All-in sales growth | 2% to 4%, including Thorne from 1 October 2026 |
| Organic sales growth (non-GAAP) | 1% to 3%, including a 30-50bp headwind from discontinuations |
| Diluted EPS growth | 1% to 5% from $6.62 |
| Core EPS growth (non-GAAP) | In line to +3% from $6.89, or $6.89-7.11; midpoint $7.00 |
| Commodity headwind, after tax | About $1.4bn |
| Core effective tax rate | 20% to 21% |
| Capital spending | 4.5% to 5.5% of net sales |
| Free cash flow productivity | 85% to 90% |
| Dividends | More than $10bn |
| Share repurchases | About $5bn |
Source: P&G earnings release, 22 October 2026. Organic sales growth of 4% in the first quarter is above the top of the full-year range, so the guidance implies slower growth for the rest of the year, or a cautious company. Analysts are close to the midpoint: the S&P Global consensus expects fiscal 2027 revenue of $89.72bn, up 3.1%, and EPS of $6.98 (StockAnalysis).
Why did P&G buy Thorne?
P&G bought Thorne to add a premium vitamins, minerals and supplements brand to its Personal Health Care business. The deal closed on 1 October 2026, the day after the quarter ended, for $3.9bn in cash. Thorne sells mainly in North America and its results, which P&G says are not material, will appear in the Health Care segment from the October-December quarter. The main assets acquired are an indefinite-lived brand intangible and goodwill, and the purchase price allocation will be finalised by 31 December 2026 (10-Q, note 8).
At $3.9bn, Thorne is about 1% of P&G's $389bn market value, or about $1.62 a share. It matters less for the numbers than for the strategy: supplements are a growing, premium part of consumer health, where P&G already owns Metamucil and Vicks, and the category fits P&G's habit of buying brands it can expand through its distribution. P&G funded the purchase with debt. Cash rose to $15.4bn at 30 September after $5.8bn of net short-term borrowing, and on 30 October P&G sold $4.0bn of fixed-rate notes: $750m of 5.125% notes due 2031, $750m of 5.300% notes due 2033, $1.25bn of 5.450% notes due 2036 and $1.25bn of 5.900% notes due 2056 (8-K, 30 October 2026). On 2 November it added $352m of floating rate notes due 2076.
P&G cash flow, dividend and balance sheet
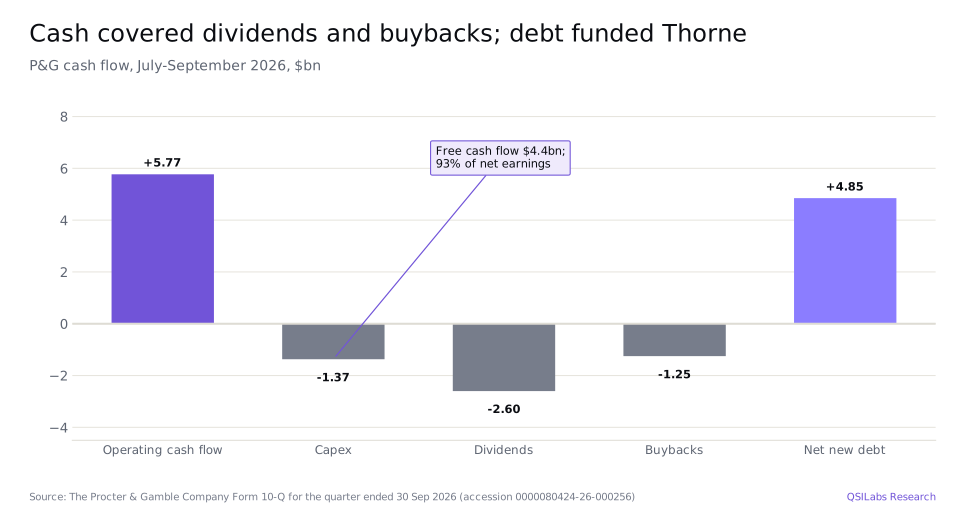
P&G generated $5,767m of operating cash flow in the quarter, $359m more than a year earlier, and spent $1,366m on capital projects, leaving free cash flow of $4,401m. Free cash flow productivity, P&G's measure of free cash flow as a share of net earnings, was 93%, above the 85-90% full-year target. Working capital was broadly neutral: higher receivables and inventories used $938m, but higher payables released $1,149m (10-Q).
Dividend and buybacks
P&G paid $2,603m of dividends and bought back $1,250m of shares in the quarter, $3.9bn in total. The quarterly dividend is $1.0885 a share, 3% more than a year earlier, or $4.35 a year, a 2.7% yield at $161.57. The latest dividend went ex on 23 October 2026. For the full year P&G expects to pay more than $10bn of dividends and buy back about $5bn of shares. With free cash flow at 85-90% of net earnings of about $16bn, that is close to all the cash the business generates, so Thorne and any extra spending are funded with debt.
Balance sheet
At 30 September 2026 P&G had $15.4bn of cash against $38.9bn of debt, of which $17.0bn was due within a year, much of it commercial paper. Current liabilities exceeded current assets by $12.5bn, normal for P&G, which relies on its strong credit ratings to roll short-term debt (10-Q). After the $3.9bn Thorne payment on 1 October, cash was about $11.5bn and net debt about $27.5bn, or about 1.2 times fiscal 2026 operating income plus depreciation and amortisation of $22.9bn. Shareholders' equity was $55.3bn and goodwill and intangibles $62.6bn.
Procter & Gamble stock Q3 2026: is PG overvalued?
On our numbers, yes. We value Procter & Gamble at $97.18 a share, against a $161.57 close on 30 October 2026: the price is 66% above our value. At $161.57 P&G's market value is about $389bn, or about 23 times the $7.00 midpoint of fiscal 2027 core EPS guidance, and its enterprise value about 20.5 times our fiscal 2027 operating income estimate.
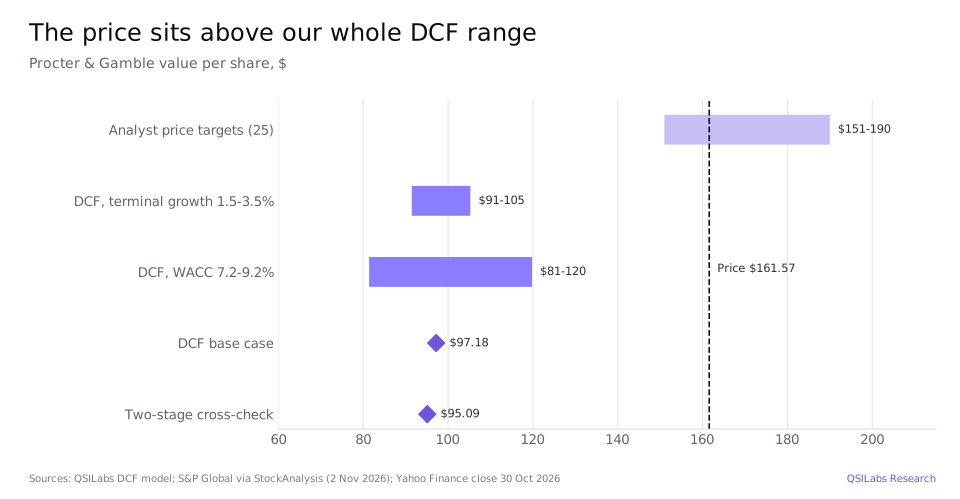
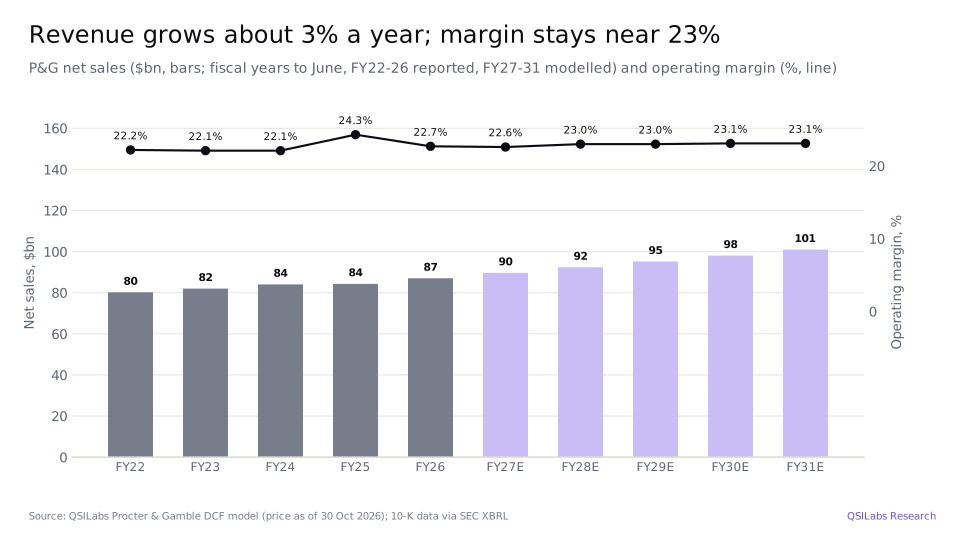
The gap is not about the quarter. P&G is a high-quality business with operating margins in the low-to-mid 20s, steady volume and strong cash returns. The question is what that is worth. Our model has operating income growing from $19.7bn in fiscal 2026 to about $27.1bn in fiscal 2036, about 3.2% a year, with revenue growth of about 3% a year. At an 8.16% cost of capital, that gives an enterprise value of $263bn. For the market price to be right with the same forecast, investors would need to accept a cost of capital of about 6.0%, or expect cash flow to grow by about 6% a year forever at our 8.16% rate.
Analysts are more positive. The 25 analysts in the S&P Global consensus rate PG a Buy, with 9 Strong Buy, 5 Buy and 11 Hold ratings, and an average price target of $173.65, a median of $176 and a range of $151 to $190. Several raised targets after the results, including UBS from $172 to $190 and TD Cowen from $150 to $166, and Freedom upgraded the stock to Buy (StockAnalysis).
Method
We forecast P&G's revenue, operating margin, tax, capital spending and working capital for fiscal 2027 to fiscal 2036, discount the unlevered free cash flow at an 8.16% weighted average cost of capital and add a terminal value with 2.5% growth. The cost of capital is Aswath Damodaran's figure for the US household products industry, from a dataset dated 5 January 2026: an 8.76% cost of equity, from a 5.12% risk-free rate and an industry beta of 0.82, and a 4.85% after-tax cost of debt, weighted 85:15. The terminal value is 57.5% of enterprise value.
We then add cash of $11.5bn, which is 30 September cash less the Thorne payment, and subtract $38.9bn of debt, $0.2bn of noncontrolling interests and $1.5bn for the cash that left the business between 30 September and the 30 October valuation date: the $2.6bn dividend that went ex on 23 October and a month of interest, less a month of free cash flow. That gives equity value of $233.9bn, or $97.18 across 2,407.2m diluted shares. A two-stage cross-check, in which returns on new investment fade over ten years, gives $95.09.
The main forecast inputs are:
- Fiscal 2027 revenue: $89.6bn, up 3.0%, the midpoint of the 2-4% all-in guidance including Thorne and within 0.1% of the $89.7bn consensus.
- Growth after fiscal 2027: 3.1% in fiscal 2028, in line with the $92.5bn consensus, then 3.0% a year to fiscal 2036, when revenue reaches about $117bn.
- Operating margin: 22.6% in fiscal 2027 on a GAAP basis, which implies about 21.6% for the last three quarters after the 25.5% first quarter, then 23.0% from fiscal 2028, rising slowly to 23.1%.
- Tax: 21%, the first-quarter rate and the top of the 20-21% core guidance.
- Capital spending: $4.5bn in fiscal 2027, 5.0% of sales and the middle of guidance, and $4.6bn in fiscal 2028, rising to 6.9% of sales by fiscal 2036 so that terminal growth is paid for by reinvestment.
- Working capital: negative, at about 2.4% of revenue, as P&G is paid by customers before it pays suppliers.
How the number moves if you argue with us
| Value per share, $ | g = 1.5% | g = 2.0% | g = 2.5% | g = 3.0% | g = 3.5% |
|---|---|---|---|---|---|
| WACC 7.16% | 109.79 | 114.32 | 119.78 | 126.53 | 135.07 |
| WACC 7.66% | 99.86 | 103.30 | 107.38 | 112.30 | 118.38 |
| WACC 8.16% | 91.44 | 94.09 | 97.18 | 100.84 | 105.25 |
| WACC 8.66% | 84.21 | 86.27 | 88.63 | 91.39 | 94.66 |
| WACC 9.16% | 77.94 | 79.55 | 81.37 | 83.48 | 85.93 |
Source: QSILabs Procter & Gamble DCF model. Even a 7.16% cost of capital with 3.5% growth forever gives $135.07, still 16% below the share price. The price needs either a lower discount rate than any in this table or growth faster than P&G has managed: net sales grew 2.1% a year from fiscal 2022 to fiscal 2026, from $80.2bn to $87.0bn.
Risks to the Procter & Gamble investment case
The risks cut both ways. On the upside for the shares:
- A lower cost of capital. P&G is one of the most defensive large companies in the world, with decades of dividend increases. Many investors treat it as a bond substitute, and if they accept a 6% return the price can stay well above our value.
- Volume-led growth. Organic sales grew 4% in the first quarter, above the 1-3% guidance. If volume keeps growing at about 2% while productivity savings return to the margin, our 3% revenue growth and 23% margin are too low.
- Commodity relief. The $1.4bn commodity headwind is the largest single item in the fiscal 2027 outlook. If raw material and energy costs ease, margins could recover quickly.
On the downside:
- Margin pressure. Gross margin fell 160 basis points and P&G is reinvesting its productivity savings. If competition forces more price cuts, as in North America Baby Care and Family Care, earnings could lag sales for longer.
- Market share losses in Skin Care, Oral Care and Family Care, each down 0.5-0.6 points, show competitors and private label are active in parts of the portfolio.
- Higher interest costs. P&G is borrowing at 5.1-5.9% for new long-term notes and expects net interest to cost an extra $300m after tax in fiscal 2027.
- Valuation. At 23 times core earnings for growth guided at 0-3%, the shares have little room for disappointment.
FAQ
What is QSILabs' value for Procter & Gamble stock after Q3 2026 earnings?
QSILabs values The Procter & Gamble Company (PG) at $97.18 per share as of results for the quarter ended 30 September 2026, based on a discounted cash flow model with an 8.16% cost of capital and 2.5% terminal growth. The shares closed at $161.57 on 30 October 2026, about 66% above that value. Our sensitivity range is roughly $81-120 a share.
Is P&G stock a buy after its Q3 2026 earnings?
On our valuation, P&G stock is expensive: the $161.57 price sits above our whole DCF range of about $81-120. The 25 analysts in the S&P Global consensus disagree, rating PG a Buy with an average target of $173.65. This is analysis, not investment advice.
How much did P&G earn in Q3 2026?
P&G earned $4.73bn, or $1.97 a diluted share, in the quarter ended 30 September 2026, against $4.75bn, or $1.95, a year earlier. Core EPS was $2.00, up 1%. Net sales were $23.3bn, up 4%, and organic sales also rose 4%.
Why is P&G's Q3 2026 quarter called the first quarter of fiscal 2027?
P&G's fiscal year ends on 30 June, so its fiscal 2027 runs from July 2026 to June 2027. The July-September 2026 quarter is therefore P&G's first quarter of fiscal 2027, but it covers the same months as other companies' third quarter of 2026, which is why we call it Q3 2026.
Why did P&G's margins fall in Q3 2026?
P&G's gross margin fell 160 basis points to 49.8% because higher commodity costs and product reinvestment each cost 140 basis points of core gross margin, and mix cost 50. Productivity savings of 120 basis points, tariff relief of 50 and pricing of 20 only partly offset them. Operating margin fell to 25.5% from 26.2%.
What is P&G's fiscal 2027 guidance?
P&G expects fiscal 2027 organic sales growth of 1-3%, all-in sales growth of 2-4% including Thorne, and core EPS of $6.89-7.11, a midpoint of $7.00. It expects free cash flow productivity of 85-90%, more than $10bn of dividends and about $5bn of share repurchases. It kept this guidance on 22 October 2026.
What did P&G pay for Thorne?
P&G paid $3.9bn in cash for Thorne, a premium vitamins, minerals and supplements brand that sells mainly in North America. The deal closed on 1 October 2026, and Thorne will be reported in the Health Care segment from the October-December 2026 quarter. P&G says its results are not material to the company.
What is P&G's dividend yield?
P&G pays a quarterly dividend of $1.0885 a share, or about $4.35 a year, a yield of about 2.7% at the 30 October 2026 price of $161.57. The dividend is 3% higher than a year earlier, and P&G expects to pay more than $10bn of dividends in fiscal 2027.
Sources
- The Procter & Gamble Company, Form 10-Q for the quarter ended 30 Sep 2026 (filed 22 Oct 2026; accession 0000080424-26-000256) www.sec.gov
- The Procter & Gamble Company, fiscal 2027 first-quarter earnings release (Form 8-K, Exhibit 99.1, 22 Oct 2026; accession 0000080424-26-000250) www.sec.gov
- The Procter & Gamble Company, Form 8-K on the issue of $4.0bn of notes (30 Oct 2026; accession 0001628280-26-068591) www.sec.gov
- The Procter & Gamble Company, Form 8-K on the issue of floating rate notes due 2076 (2 Nov 2026; accession 0001628280-26-068909) www.sec.gov
- The Procter & Gamble Company, Form 8-K on the 2026 annual meeting vote (16 Oct 2026; accession 0000080424-26-000245) www.sec.gov
- SEC EDGAR XBRL company facts for The Procter & Gamble Company (CIK 80424): 10-K net sales, operating income, cash flow and EPS, fiscal 2022-2026 data.sec.gov
- StockAnalysis: Procter & Gamble forecast and analyst ratings, S&P Global data (accessed 2 Nov 2026) stockanalysis.com
- Yahoo Finance chart data: PG closing prices and dividends (November 2025 to November 2026) query1.finance.yahoo.com
- Damodaran Online: cost of capital by industry (Household Products) pages.stern.nyu.edu
- QSILabs Procter & Gamble discounted cash flow model (internal; price as of 30 Oct 2026)
Disclaimer
This article is for information only and is not investment advice or a recommendation to buy or sell any security. QSILabs estimates are opinions based on public information and our own model, and they may be wrong. Figures are as of the dates stated. Do your own research or consult a licensed adviser before investing.
More from QSI Labs
Related analysis: Coca-Cola stock Q3 2026: volume and the Africa bottling exit, Costco stock Q3 2026, Johnson & Johnson stock Q3 2026 and AbbVie stock Q3 2026.
Read our white paper, QSI Labs: An AI-Native Trading Firm Built on a Training Loop (October 2026), available on request, or browse the research index.