Research / Earnings and valuation
Fortinet Stock Q3 2026:Billings, Service Revenue and the Share Price Drop
As of: Figures are as of Fortinet, Inc.'s third-quarter 2026 results (the quarter ended 30 September 2026, reported 28 October 2026 in a Form 8-K) and its Form 10-Q for that quarter, dated 29 October 2026. Fortinet's fiscal year is the calendar year, so its Q3 2026 covers July to September 2026. The share price used in our valuation is the Nasdaq close of FTNT on 2 November 2026, $126.21; analyst data were accessed on 2 November 2026. Published 2 November 2026.
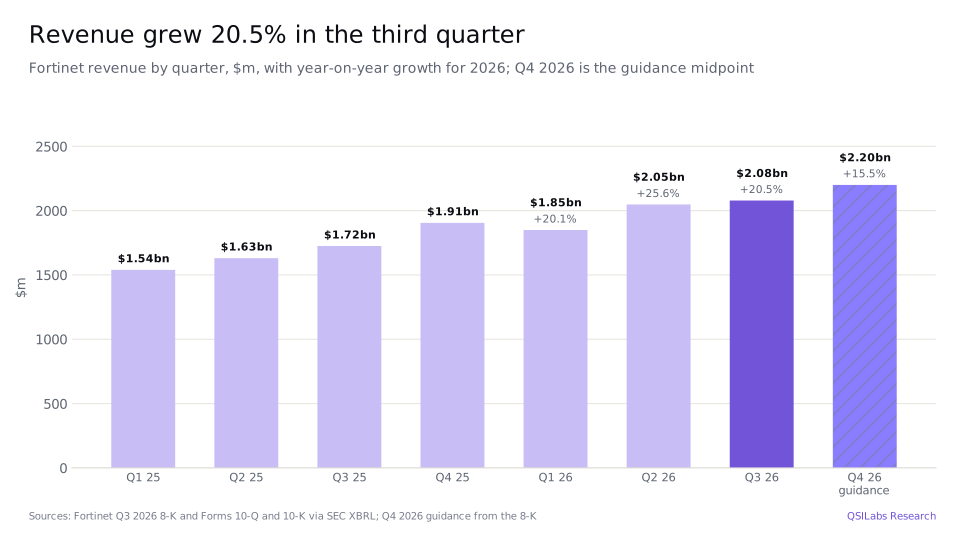
The short answer. Fortinet stock Q3 2026 comes down to a quarter that beat on almost every line but disappointed on the one investors watch most closely, service revenue. In the three months to 30 September 2026 revenue rose 20.5% to $2.08bn, product revenue 36.8% to $765m and billings 29.2% to $2.34bn. Service revenue grew 12.7% to $1.31bn, and Fortinet cut its 2026 service revenue outlook to $5.15bn to $5.17bn from $5.18bn to $5.22bn. GAAP operating income rose 28.7% to $704m, a 33.9% margin, and free cash flow was $865m. The shares fell 20.1% the next day and closed at $126.21 on 2 November 2026, 27.5% below their pre-results close. Our discounted cash flow model values the shares at $52.89, well under half the price; below we show which assumptions drive that gap and how far each one moves it.
Key takeaways
- Revenue and billings beat. Revenue rose 20.5% to $2,078.4m and billings, revenue plus the change in deferred revenue, rose 29.2% to $2,336.3m. Fortinet raised its 2026 revenue outlook to $8.125bn to $8.215bn, about 20% growth.
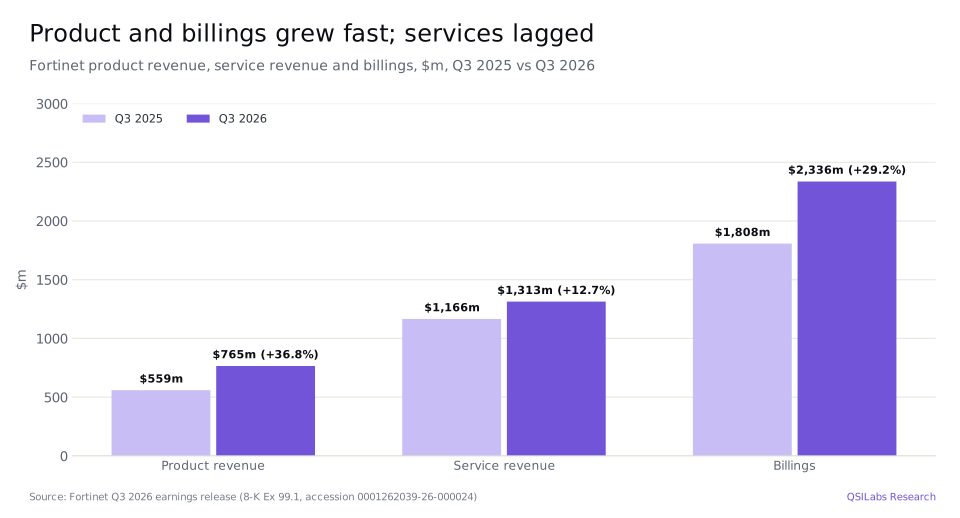
- Service revenue lagged. Service revenue, mostly security subscriptions and support, grew 12.7% to $1,313.4m. Fortinet lowered its 2026 service revenue range to $5.15bn to $5.17bn, which it said was a timing issue caused by large deals with services that start in stages.
- Product growth slowed from the first half. Product revenue, mainly FortiGate firewalls, rose 36.8% to $765.0m. Investors had expected growth of about 50%, according to a Yahoo Finance report.
- Margins rose. GAAP operating margin rose to 33.9% from 31.7%, and the non-GAAP operating margin to 38.2%, which chief financial officer Christiane Ohlgart called "a third quarter record".
- Cash flow is strong. Free cash flow rose 52.4% to $864.8m and was $2.84bn in the first nine months. Fortinet ended September with $5.32bn of cash and investments and $497m of debt.
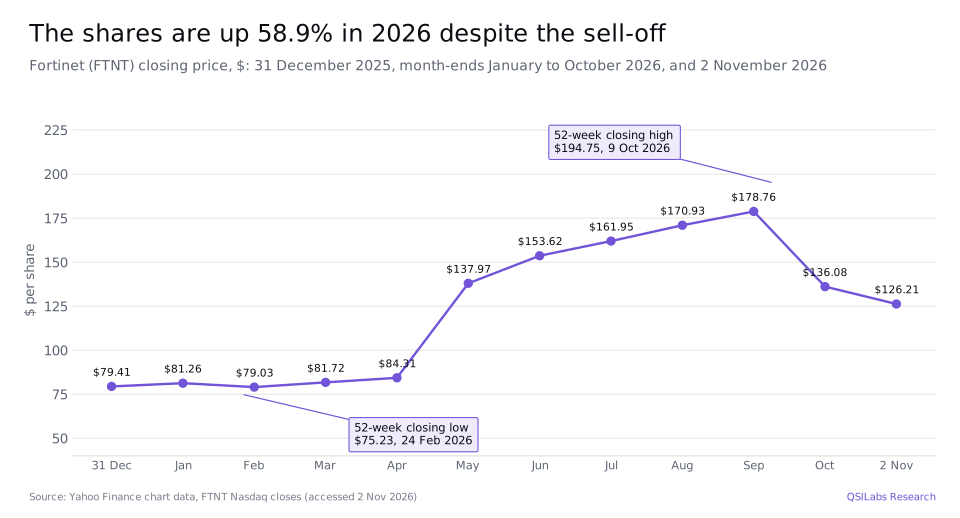
- The shares gave back much of their 2026 rally. FTNT closed at $194.75 on 9 October and $126.21 on 2 November, still 58.9% above the end of 2025.
- QSILabs value: $52.89 a share, against a $126.21 close on 2 November 2026. A two-stage cross-check gives $54.05; analysts' average target is $145.96 and their lowest $110.
- What to watch. Whether service revenue growth picks up in 2027 as Fortinet expects, how product sales hold up against a strong 2026, component costs and lead times, and the take-up of new AI security and SASE services.
Key numbers from Fortinet's Q3 2026 earnings
| Measure | Q3 2026 | Q3 2025 | Change |
|---|---|---|---|
| Total revenue | $2,078.4m | $1,724.9m | +20.5% |
| Product revenue | $765.0m | $559.3m | +36.8% |
| Service revenue | $1,313.4m | $1,165.6m | +12.7% |
| Billings | $2,336.3m | $1,807.7m | +29.2% |
| GAAP gross margin | 79.0% | 80.8% | -1.8 points |
| GAAP operating income | $704.3m | $547.3m | +28.7% |
| GAAP operating margin | 33.9% | 31.7% | +2.2 points |
| Non-GAAP operating margin | 38.2% | 36.9% | +1.3 points |
| Diluted earnings per share | $0.86 | $0.62 | +38.7% |
| Non-GAAP earnings per share | $0.91 | $0.74 | +23.0% |
| Net cash from operating activities | $946.0m | $655.2m | +44.4% |
| Free cash flow | $864.8m | $567.5m | +52.4% |
Source: Fortinet Q3 2026 earnings release (Form 8-K, Exhibit 99.1, 28 October 2026).
Fortinet Q3 2026 earnings: what happened
Fortinet reported third-quarter results on 28 October 2026. Revenue rose 20.5% to $2,078.4m from $1,724.9m. Product revenue, mostly FortiGate firewall appliances and other hardware, rose 36.8% to $765.0m, and service revenue, the security subscriptions and technical support customers pay for over the life of their contracts, rose 12.7% to $1,313.4m. For the first nine months revenue was $5,975.9m, up 22.1%.
Profit grew faster than revenue. GAAP operating income rose 28.7% to $704.3m, a margin of 33.9% against 31.7% a year earlier, and net income rose 34.1% to $635.5m, or $0.86 a diluted share. Excluding stock-based compensation of $82.0m and amortisation of acquired intangibles, non-GAAP operating income was $793.8m, a 38.2% margin. Ohlgart said it was "a third quarter record, up 130 basis points" and above the top of Fortinet's guidance. Non-GAAP earnings per share rose 23.0% to $0.91.
Gross margin slipped to 79.0% from 80.8%. Ohlgart said Fortinet had benefited in the first half from inventory bought at lower cost after it had already raised its prices, but that in the second half "the costs are creeping up", while service gross margin was "picking up nicely". Chief executive Ken Xie said price increases had added about 10% to the top line and had "probably stabilized, but not improved yet".
Founder, chairman and chief executive Ken Xie said: "We are very pleased with our excellent third quarter results, which reflect strong execution and broad-based demand across our entire portfolio, allowing us to raise our 2026 billings guidance for the third time this year."
- 24 Feb 2026FTNT closes at $75.23, its 52-week closing lowYahoo Finance
- Mar 2026$500m of 2026 senior notes repaid at maturityForm 10-Q
- May 2026Shares rise from $84.31 at the end of April to $137.97 at the end of MayYahoo Finance
- 9 Oct 2026FTNT closes at $194.75, its 52-week closing highYahoo Finance
- Oct 2026Board adds $1.23bn to the buyback programme and extends it to 28 February 2028Form 10-Q
- 28 Oct 2026Q3 results: revenue up 20.5%, billings up 29.2%; 2026 revenue outlook raised, service revenue outlook lowered8-K Ex 99.1; earnings call
- 29 Oct 2026FTNT falls 20.1% to $139.10Yahoo Finance
- 2 Nov 2026FTNT closes at $126.21, the price used in our valuationYahoo Finance
- 28 Feb 2028Current share buyback programme endsForm 10-Q
- 2031$500m of 2.2% senior notes matureForm 10-Q
Why did Fortinet stock fall after the results?
The shares fell 20.1% on 29 October, to $139.10 from $174.08, and kept falling to $126.21 on 2 November. Two things disappointed. First, Fortinet lowered its 2026 service revenue outlook to $5.15bn to $5.17bn from $5.18bn to $5.22bn, below the $5.2bn analysts expected, according to Bloomberg data reported by Yahoo Finance. Second, product revenue growth of 36.8% beat analysts' estimates but fell short of investor expectations of about 50%, Yahoo Finance reported, which raised questions about how long the current firewall replacement cycle will last. Fortinet said product growth was returning to more typical rates after strong first-half demand ahead of expected price increases.
Fortinet blamed the service shortfall on timing. Ohlgart said service revenue "faced some headwinds from winning new large enterprise customers with ramp service activations and large new expansion deals that also consolidated various existing service arrangements into enterprise agreements". In plain terms, big new customers bought equipment now and will start paying for some services later. She called it "really a timing issue" and said the first quarter of 2026 "marked the trough for our services revenue growth rate".
Not every analyst accepted that. Jefferies wrote that "the magnitude of the services miss due to [enterprise license agreements] with ramped service deals leads us to believe that 3Q also benefited from material pull fwd which may hinder growth, particularly in the middle of CY27". Bank of America cut its rating to Neutral with a $140 target, Mizuho cut its target to $118 from $160 and Piper Sandler to $140 from $175, according to Yahoo Finance. The same day ServiceNow fell nearly 27% on its own results, and other security stocks including CrowdStrike, Okta and Palo Alto Networks also declined.
How fast are Fortinet's billings and service revenue growing?
Billings, Fortinet's measure of what it invoiced in the quarter, rose 29.2% to $2,336.3m, well ahead of the 20.5% growth in revenue. The gap shows up on the balance sheet: deferred revenue, which is cash billed for services Fortinet has not yet delivered, rose to $7,934.4m at 30 September from $7,115.8m at the end of 2025. Ohlgart said service billings grew 26%, total deferred revenue 19% and short-term deferred revenue 14.5%, "our highest growth rate in 5 quarters".
That is why Fortinet expects service growth to recover. Ohlgart said: "As we look ahead to 2027, we expect our total billings and revenue growth to outpace the growth of our overall addressable market", and that "our 2027 service revenue is expected to grow at a higher rate compared to 2026". Asked about product growth next year, after a strong 2026, Xie said it was "3 months early to give the '27 guidance" but that Fortinet expects to grow faster than the market for SASE firewalls, which he put at 16% a year.
Fortinet calls its main products SASE firewalls, firewalls that also deliver secure access service edge features from the cloud. On the call it said SASE firewall billings rose 31%, operational technology billings, for factories and other industrial sites, nearly 40%, and AI-driven security operations billings 15%. The total value of deals above $1m rose 51%.
Industry forecasts point the same way, though more slowly. Gartner's September 2026 forecast, as summarised by Software Strategies Blog, puts worldwide information security spending at $247.5bn in 2026, up 12.7% in constant currency, and $372.8bn in 2030, a compound growth rate of 10.8% a year from 2025. Gartner raised its forecast for firewall equipment spending growth in 2027 to 13.4%, because many installed firewalls cannot run new post-quantum encryption and will need replacing.
Where does Fortinet make its money?
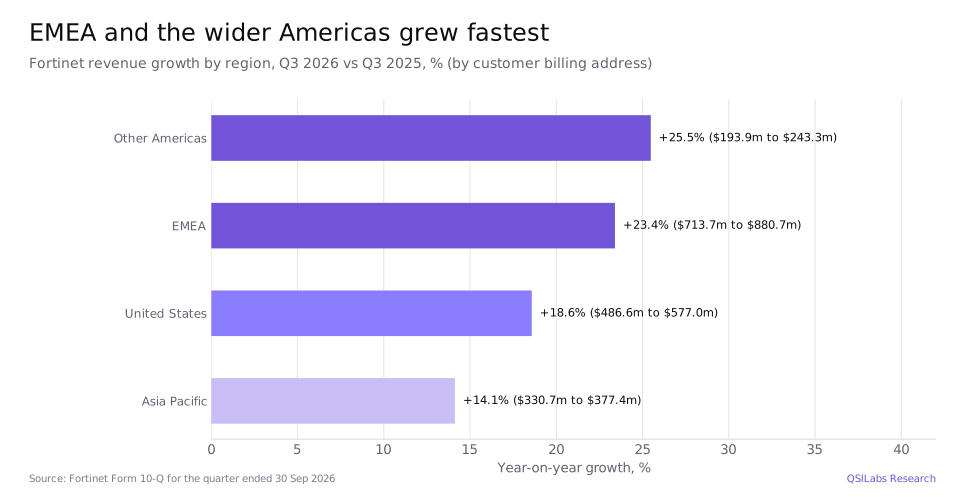
Fortinet sells mostly through distributors and resellers, and three distributors accounted for 27%, 14% and 12% of revenue in the third quarter. Most of its revenue comes from outside the United States. In the third quarter EMEA, Europe, the Middle East and Africa, grew 23.4% to $880.7m, the United States 18.6% to $577.0m, the rest of the Americas 25.5% to $243.3m and Asia Pacific 14.1% to $377.4m.
Over the first nine months EMEA was 42.5% of revenue, the United States 28.2%, the rest of the Americas 11.5% and Asia Pacific 17.9%. That mix matters for our cost of capital, because we weight the country risk premium by where Fortinet earns its revenue.
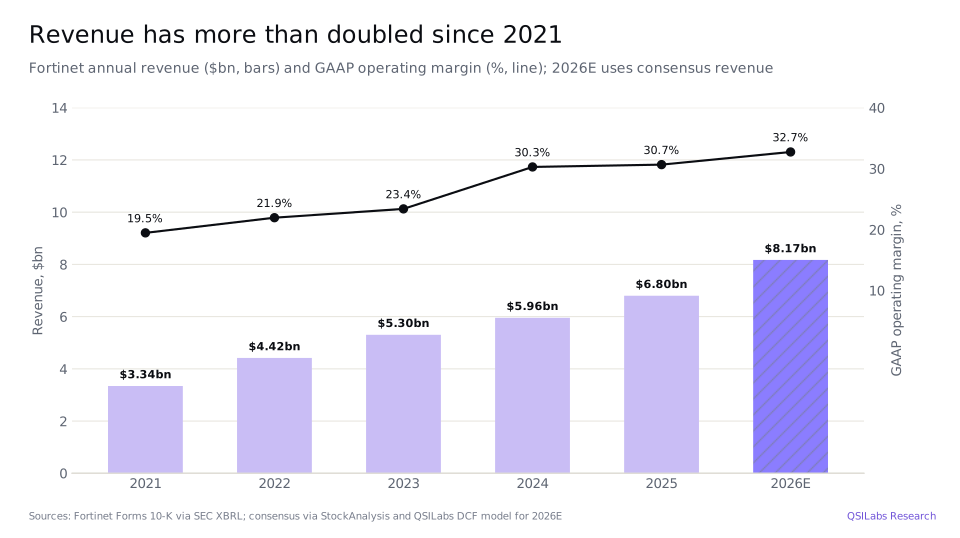
Over a longer period Fortinet has grown fast and become much more profitable. Annual revenue was $3.34bn in 2021, $4.42bn in 2022, $5.30bn in 2023, $5.96bn in 2024 and $6.80bn in 2025, and analysts' consensus, as compiled by StockAnalysis, is $8.17bn in 2026, up 20.2%. The GAAP operating margin rose from 19.5% in 2021 to 30.7% in 2025, and is 32.7% in our 2026 estimate.
How much cash does Fortinet generate?
Fortinet defines free cash flow as cash from operations less purchases of property and equipment and, this quarter, a $17.0m escrow receipt. It was $864.8m in the third quarter, up 52.4% from $567.5m, a margin of 41.6% of revenue. Operating cash flow was $946.0m and capital spending $64.2m. Adjusted free cash flow, which also adds back $47.4m of real estate purchases, was $912.2m, 43.9% of revenue. Over nine months operating cash flow was $3,066.7m, up 55.6%, helped by an $817.8m rise in deferred revenue.
Fortinet uses that cash mainly to buy back shares. It repurchased 12.5m shares for $972.8m in the first nine months, at an average of $77.73, and repaid $500m of notes in March. In October the board added $1.23bn to the buyback programme and extended it to 28 February 2028, leaving about $2.0bn available. Fortinet does not pay a dividend.
At 30 September it held $3,750.6m of cash, $1,048.4m of short-term investments and $519.4m of long-term investments, $5,318.4m in total, against $497.1m of 2.2% notes due 2031. For 2026 Fortinet plans $390m to $420m of infrastructure investment, including $180m to $210m in the fourth quarter, and expects cash taxes of $400m to $450m.
How has FTNT stock performed in 2026?
Fortinet shares closed at $126.21 on 2 November 2026, up 58.9% from $79.41 at the end of 2025. They fell to a 52-week closing low of $75.23 on 24 February, jumped from $84.31 at the end of April to $137.97 at the end of May, and kept rising to a closing high of $194.75 on 9 October.
The results reversed much of that. The shares closed at $174.08 on 28 October, before the report, fell 20.1% to $139.10 on 29 October and closed at $136.08 on 30 October and $126.21 on 2 November, down 7.25% on the day.
Fortinet stock Q3 2026: is FTNT overvalued?
On our numbers, yes. Our discounted cash flow model values Fortinet at $52.89 a share, 0.42 times the $126.21 close on 2 November 2026. At that price the market value of the equity was about $93.7bn on 742.6m diluted shares, and the enterprise value, after deducting $4.82bn of net cash, about $88.9bn. That is 36.6 times our estimate of 2027 unlevered free cash flow, $2.43bn. The price is 35.5 times consensus 2026 non-GAAP earnings per share of $3.56 and 32.5 times the $3.88 expected for 2027.
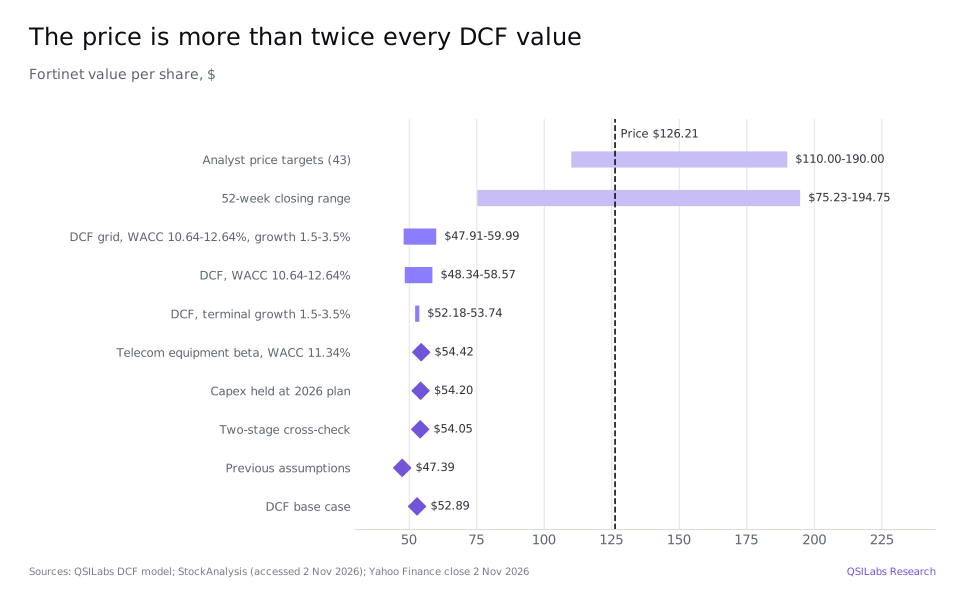
Because our value is less than half the price, we checked what drives it. There are four main reasons. First, growth: we take revenue growth from consensus, about 11.5% in 2027 and 11.3% in 2028, then to the industry's 10.8% and down to 2.5% by 2036, while the price implies growth that stays fast for much longer. Second, the cost of capital is 11.64%, because the risk-free rate is 5.12% and the industry beta we use is 1.303. Third, we use GAAP operating margins, which are after stock-based compensation, and let them rise only to 33.1%, the median of a group of mature security and internet software companies. Fourth, our long-run rule raises capital spending from 5.0% of revenue in 2026 to 7.4% by 2036. Even with the lowest cost of capital and highest terminal growth in our grid, 10.64% and 3.5%, the model gives $59.99, less than half the price.
Analysts are much closer to the price. The 43 analysts tracked by StockAnalysis rate Fortinet a Hold on average, with an average price target of $145.96, a median of $142 and a range from $110 to $190. In October 6 rated it a Strong Buy, 1 a Buy, 31 a Hold, 1 a Sell and 4 a Strong Sell.
Method
We forecast revenue and GAAP operating margin year by year to 2036, apply an 18% tax rate, Fortinet's guided non-GAAP tax rate for 2026, close to its 17% effective rate for the first nine months, and deduct capital spending and the change in working capital to reach unlevered free cash flow. We discount those cash flows at an 11.64% weighted average cost of capital. Equity is 99.5% of capital at a cost of 11.67%, from a 5.12% risk-free rate, a beta of 1.303 and an equity risk premium of 5.03%. The beta is Damodaran's January 2026 global unlevered beta for system and application software companies, 1.297, relevered at Fortinet's ratio of debt to equity, 0.5%. The equity risk premium weights Damodaran's country premiums by Fortinet's revenue: 39.6% from the Americas, 42.5% from EMEA and 17.9% from Asia Pacific. Debt is 0.5% of capital at a pre-tax cost of 6.46%, taxed at 25%. After 2036 we assume growth of 2.5% a year; that terminal value is 42.3% of our enterprise value of $34.45bn. Adding cash and investments of $5.32bn and deducting debt of $0.50bn gives equity value of $39.28bn, or $52.89 a share on 742.6m diluted shares. Fortinet has no convertible debt, preferred stock or material equity investments.
For 2026 we use consensus revenue of $8.17bn, the midpoint of Fortinet's guidance, and GAAP operating income of $2.67bn, a 32.74% margin based on that guidance: $1.97bn in the first nine months plus about $701m in the fourth quarter. For 2027 we use consensus revenue of $9.11bn, up 11.5%. Growth of 11.3% in 2028 matches the three-year consensus forecast of 14.24% a year from 2025 shown by StockAnalysis, and growth of 10.8% in 2029 and 2030 matches Gartner's forecast for security spending. Growth then fades in equal steps to 2.5% in 2036, when revenue reaches $17.59bn.
The operating margin is 32.11% in 2027, from consensus non-GAAP earnings per share of $3.88, grossed up at the 18% tax rate, less interest income and the third-quarter gap for stock-based compensation and amortisation. It rises in equal steps to 33.1% by 2031, the median of a peer group of Check Point, Gen Digital, VeriSign, Akamai and Fortinet itself; Fortinet has not published a long-term margin target. Depreciation and amortisation is about 2.0% of revenue. Capital spending is $405m in 2026, the midpoint of guidance, and then follows our long-run rule, rising to 7.4% of revenue by 2036. Working capital is negative, -34% of revenue, because customers pay for multi-year services in advance, so growth releases cash.
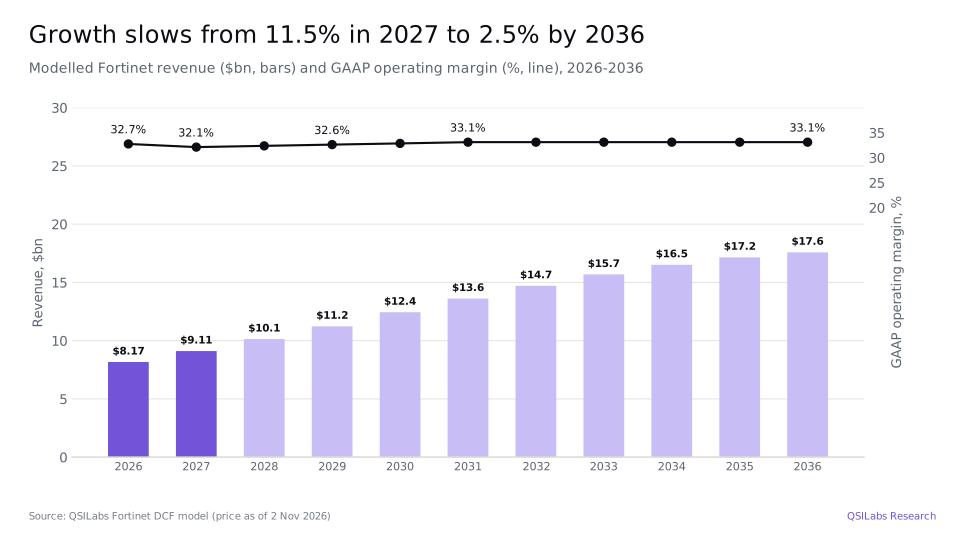
We forecast unlevered free cash flow of $2.42bn in 2026, $2.43bn in 2027, $2.69bn in 2028, $3.28bn in 2030 and $3.98bn in 2036; only the part of 2026 after 2 November is discounted. Our previous model, dated 28 October and priced at $174.08, gave $47.38. It assumed growth of 10.77% in 2027 fading in equal steps to 2.5%, an operating margin of 31.45% in 2027, a 21% tax rate with no company source and 2026 capital spending of $277m that was not tied to guidance. We have replaced those with the consensus, company guidance and industry forecast above. With the old assumptions at today's date and price the model gives $47.39.
How the number moves if you argue with us
The table shows our value per share at different costs of capital and terminal growth rates. Even at a 10.64% cost of capital and 3.5% terminal growth, the model gives $59.99, about 0.48 times the share price.
| Cost of capital | Growth 1.5% | Growth 2.0% | Growth 2.5% | Growth 3.0% | Growth 3.5% |
|---|---|---|---|---|---|
| 10.64% | $57.42 | $57.96 | $58.57 | $59.24 | $59.99 |
| 11.14% | $54.66 | $55.09 | $55.56 | $56.08 | $56.66 |
| 11.64% | $52.18 | $52.52 | $52.89 | $53.29 | $53.74 |
| 12.14% | $49.94 | $50.21 | $50.50 | $50.81 | $51.15 |
| 12.64% | $47.91 | $48.12 | $48.34 | $48.58 | $48.84 |
The industry we map Fortinet to matters a little. Fortinet earns most of its money from software subscriptions, but 36.8% of third-quarter revenue came from hardware, so we also ran the model with Damodaran's global telecom equipment beta, 1.239 unlevered. That lowers the cost of capital to 11.34% and gives $54.42.
Capital spending makes a small difference. Our long-run rule takes capital spending to 7.4% of revenue by 2036, above Fortinet's 5.1% average over the past 12 quarters and its 2026 plan of about 5.0%; holding it at the 2026 plan of 4.96% of revenue in every year gives $54.20. A two-stage version of the model, which extends the fade over more years, gives $54.05.
Fortinet's own five-year beta is 1.04, below the 1.303 we use, which would lower the cost of capital and raise the value. Debt is only 0.5% of capital, so borrowing plays almost no part in the result.
Our numbers and the market's can both be right only if Fortinet keeps growing well above 10% a year for much longer than consensus and Gartner's forecast imply, or reaches margins well above those of mature peers. Fortinet has done both before: revenue more than doubled from 2021 to 2025 and the margin rose by 11 points. But the share price already assumes much of that continues.
Risks to the Fortinet investment case
- Service revenue. Service growth of 12.7% is the slowest part of the business, and the 2026 outlook was cut. If large deals keep consolidating services into enterprise agreements, or fewer customers buy subscriptions with new hardware, growth may not recover in 2027 as Fortinet expects.
- A firewall cycle that fades. Product revenue rose 36.8% after a stronger first half, helped by price increases of about 10%. Jefferies thinks some demand was pulled forward, which could weigh on growth in mid-2027.
- Component costs. Fortinet said lead times for some components are getting longer and costs are rising, and gross margin fell to 79.0%. Ohlgart said "you can only increase the prices so much", so Fortinet balances price rises against market share.
- Competition. Fortinet competes with Palo Alto Networks, Cisco and cloud security companies in firewalls, SASE and security operations, and price matters in its markets.
- Reliance on distributors. Three distributors accounted for 53% of third-quarter revenue.
- Valuation risk. At 35.5 times 2026 earnings the shares need years of fast growth. Our value is $52.89, and even our most generous grid case is $59.99.
FAQ
What value does QSILabs put on Fortinet stock?
Our discounted cash flow model gives $52.89 a share, against a $126.21 close on 2 November 2026. Across costs of capital from 10.64% to 12.64% and terminal growth from 1.5% to 3.5% the value ranges from $47.91 to $59.99. A two-stage cross-check gives $54.05, and using a telecom equipment beta gives $54.42.
Should I buy Fortinet stock after the Q3 2026 results?
We do not give personal advice. On our numbers the shares trade well above the value of their cash flows, even after falling 27.5% since the results. Fortinet is growing fast and generates a lot of cash, but the price assumes that growth lasts much longer than consensus expects, so read the risks above before deciding.
How much revenue did Fortinet make last quarter?
Fortinet reported revenue of $2,078.4m for the third quarter of 2026, the three months to 30 September, up 20.5% from $1,724.9m. Product revenue was $765.0m and service revenue $1,313.4m. GAAP earnings per share were $0.86 and non-GAAP earnings per share $0.91.
What price target do analysts have for FTNT?
The 43 analysts tracked by StockAnalysis have an average target of $145.96, about 16% above the $126.21 close on 2 November 2026, with a median of $142, a low of $110 and a high of $190. Their consensus rating is Hold.
Does Fortinet have much debt?
Very little. At 30 September 2026 Fortinet had $497.1m of debt, its 2.2% notes due 2031, against $5,318.4m of cash and investments, so it had net cash of about $4.82bn. It repaid $500m of notes that matured in March 2026.
What did Fortinet change in its 2026 outlook?
Fortinet raised its 2026 revenue outlook to $8.125bn to $8.215bn and billings to $9.568bn to $9.718bn, and now expects non-GAAP earnings per share of $3.54 to $3.58. It lowered its service revenue outlook to $5.15bn to $5.17bn from $5.18bn to $5.22bn. For the fourth quarter it expects revenue of $2.155bn to $2.245bn.
What are Fortinet's billings?
Billings are revenue plus the change in deferred revenue, so they include amounts invoiced for services that Fortinet will recognise as revenue later. They rose 29.2% to $2,336.3m in the third quarter and Fortinet treats them as a guide to future revenue.
Does Fortinet pay a dividend?
No. Fortinet returns cash by buying back shares: $972.8m in the first nine months of 2026, and it had about $2.0bn of buyback authority left at 29 October 2026.
Who runs Fortinet?
Ken Xie is Fortinet's founder, chairman and chief executive. Christiane Ohlgart is chief financial officer and John Whittle is chief operating officer.
Sources
- Fortinet, Inc., third-quarter 2026 earnings release (Form 8-K, Exhibit 99.1, 28 Oct 2026; accession 0001262039-26-000024) www.sec.gov
- Fortinet, Inc., Form 10-Q for the quarter ended 30 Sep 2026 (dated 29 Oct 2026; accession 0001262039-26-000027) www.sec.gov
- SEC XBRL company facts for Fortinet, Inc. (CIK 1262039): annual and quarterly revenue, operating income and capital expenditure from Forms 10-K and 10-Q data.sec.gov
- Fortinet (FTNT) Q3 2026 earnings call transcript, 28 Oct 2026 (The Motley Fool; accessed 2 Nov 2026) www.fool.com
- Ines Ferré, "ServiceNow stock sinks in worst day ever, Fortinet shares drop as Q3 earnings reports send software sector lower", Yahoo Finance, 29 Oct 2026 finance.yahoo.com
- Fiona Craig, "Fortinet Shares Fall More Than 25% as Product Revenue Growth Slows to 37%", Yahoo Finance, 29 Oct 2026 finance.yahoo.com
- StockAnalysis: Fortinet forecast and analyst ratings, S&P Global data (accessed 2 Nov 2026) stockanalysis.com
- StockAnalysis: Fortinet statistics (accessed 2 Nov 2026) stockanalysis.com
- Louis Columbus, Software Strategies Blog: summary of Gartner's information security end-user spending forecast (Gartner G00862059, 24 Sep 2026) softwarestrategiesblog.com
- Yahoo Finance chart data: FTNT closing prices (November 2025 to November 2026) query1.finance.yahoo.com
- Damodaran Online: industry betas (global) and equity risk premiums, January 2026 pages.stern.nyu.edu
- QSILabs Fortinet discounted cash flow model (internal; price as of 2 Nov 2026)
Disclaimer
This article is for information only and is not investment advice, a recommendation or an offer to buy or sell any security. QSI Labs and its authors may hold positions in the securities discussed. Forecasts and valuations are estimates that depend on assumptions that may prove wrong. Figures are taken from company filings and third-party sources believed to be reliable, but we do not guarantee their accuracy. Do your own research or consult a licensed adviser before investing.
More from QSI Labs
Related analysis: CrowdStrike stock Q3 2026: ARR and Falcon Flex, Palo Alto Networks stock Q3 2026: NGS ARR and CyberArk, Cisco stock Q3 2026: AI networking orders and ServiceNow stock Q3 2026: AI and cRPO.
Read our white paper, QSI Labs: An AI-Native Trading Firm Built on a Training Loop (October 2026), available on request, or browse the research index.