Research / Earnings and valuation
Danaher Stock Q3 2026:Sales Up 8% as Masimo Lifts Diagnostics
As of: Figures are as of Danaher Corporation's results for the quarter ended 25 September 2026, reported 21 October 2026 in a Form 8-K and the Form 10-Q filed the same day, and the 21 October 2026 earnings call. Balance-sheet figures are from 25 September 2026. The share price used in our valuation is the NYSE close of DHR on 2 November 2026, $227.97; analyst data were accessed on 2 November 2026. Published 2 November 2026.
The short answer. Danaher stock Q3 2026 comes down to a quarter in which the life sciences and diagnostics group beat its own plan and raised its profit guidance while falling respiratory test sales held back growth. Sales for the three months to 25 September 2026 rose 8.3% to $6,554m, helped by the Masimo acquisition; core sales, which strip out acquisitions and currency, grew 3.0%, or 5.5% excluding respiratory testing. Adjusted EPS rose to $2.11 from $1.89 and free cash flow rose 19% to $1,632m. Danaher raised its 2026 adjusted EPS guidance to $8.57-8.62. Chief executive Julie Sawyer Montgomery spoke of "better-than-expected third quarter revenue, earnings and cash flow". Our discounted cash flow model values Danaher at $88.79 a share, well below the $227.97 close on 2 November 2026, mainly because we use a higher cost of capital than the stock's own history suggests and require heavier reinvestment.
Key takeaways
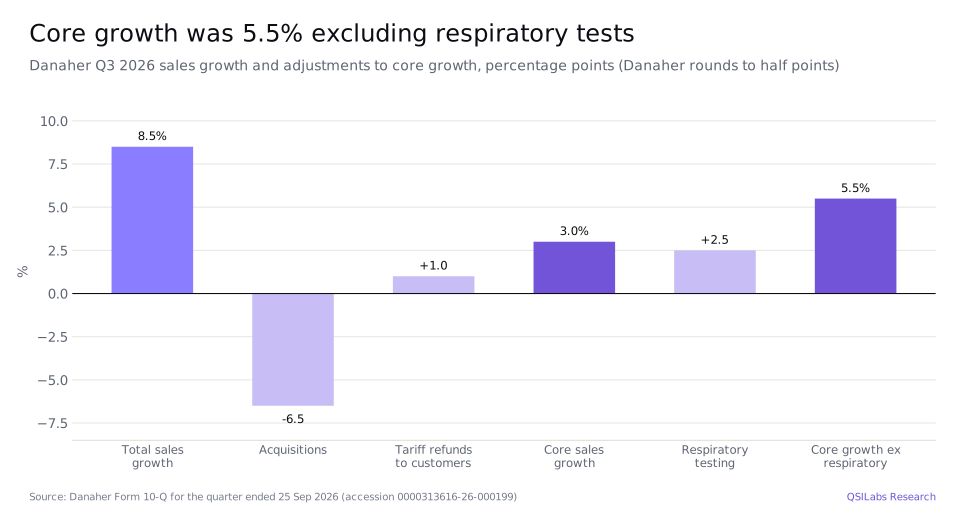
- Sales up 8.3%. Third-quarter sales were $6,554m, against $6,053m a year earlier. Acquisitions, mostly Masimo, added 6.5 points of growth, and tariff refunds to customers took off 1.0 point.
- Core growth 5.5% excluding respiratory. Including Cepheid's respiratory tests, which fell to about $350m from about $500m, core growth was 3.0%. Biotechnology grew 5.0%, Life Sciences 4.5% and Diagnostics 0.5%, or 7.0% excluding respiratory testing.
- Bioprocessing orders up mid-teens. Bioprocessing sales grew towards the upper end of mid-single digits, and management expects growth to improve in 2027.
- Higher adjusted margin. The adjusted operating margin rose 1.1 points to 29.0%. The GAAP margin was 19.0%, against 19.1%, after Masimo inventory and amortisation charges.
- Guidance raised. 2026 adjusted EPS guidance is now $8.57-8.62, up from $8.45-8.60. Management's starting point for 2027 is 4-5% core growth excluding respiratory testing.
- Two deals in 2026. Danaher paid about $9.8bn for Masimo in June and about $1.4bn for StatLab Medical Products on 28 September.
- Our value: $88.79 a share, against a $227.97 close on 2 November 2026. Our sensitivity grid runs from $74.98 to $109.48, and using Danaher's own beta of 0.80 gives $131.92. Analysts' average target is $259.9.
- What to watch. The flu season and respiratory test sales; academic and bioprocessing demand; how fast Masimo grows and how quickly its acquisition charges fade; and debt after two large deals.
Key numbers from Danaher's Q3 2026 earnings
| Metric | Q3 2026 | Q3 2025 | Change |
|---|---|---|---|
| Sales | $6,554m | $6,053m | +8.3% |
| Core sales growth | 3.0% | n/a | n/a |
| Core sales growth excluding respiratory testing | 5.5% | n/a | n/a |
| Gross profit | $3,837m | n/a | n/a |
| GAAP operating profit | $1,245m | $1,154m | +7.9% |
| GAAP operating margin | 19.0% | 19.1% | -0.1pt |
| Adjusted operating margin | 29.0% | 27.9% | +1.1pt |
| Net earnings from continuing operations | $1,207m | $908m | +32.9% |
| GAAP diluted EPS (continuing operations) | $1.71 | $1.27 | +34.6% |
| Adjusted diluted EPS | $2.11 | $1.89 | +11.6% |
| Operating cash flow | $1,886m | $1,662m | +13.5% |
| Free cash flow | $1,632m | $1,370m | +19.1% |
Core sales growth and adjusted figures are Danaher's non-GAAP measures. Adjusted figures exclude items such as amortization of acquisition-related intangible assets, acquisition-related inventory charges, impairments and special equity award compensation.
Danaher Q3 2026 earnings: what happened
Danaher reported sales of $6,554m for the quarter to 25 September 2026, 8.3% more than the $6,053m of a year earlier; Danaher's growth table, which rounds to half points, shows 8.5%. Acquisitions added 6.5 points, currency had no effect and tariff refunds to customers reduced sales growth by 1.0 point, leaving core growth of 3.0%. Lower respiratory testing took 2.5 points off, so core growth excluding respiratory testing was 5.5%.
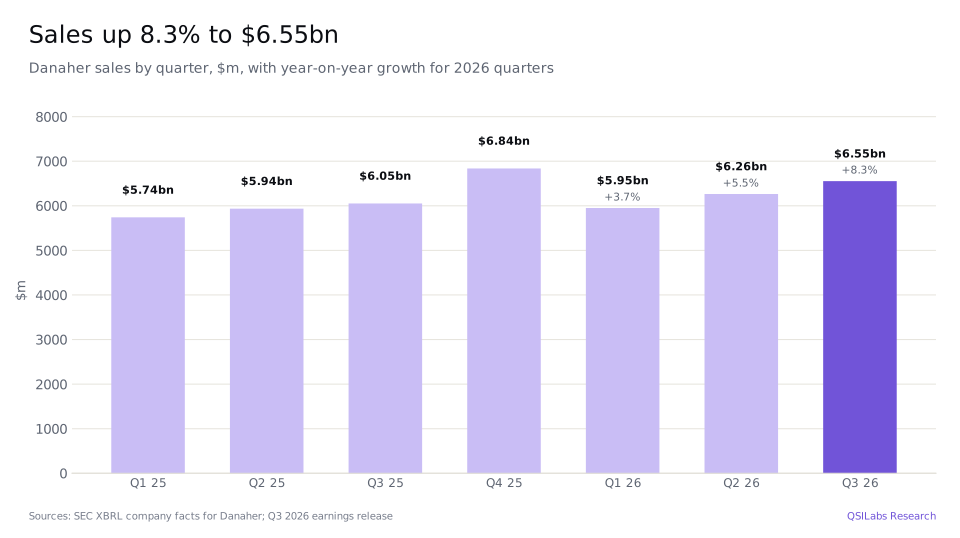
Gross profit was $3,837m, a margin of 58.5%. Selling, general and administrative expenses were $2,159m and research and development $433m. GAAP operating profit rose 7.9% to $1,245m. Interest expense was $135m and interest income $31m, for pre-tax earnings of $1,132m. Tax was a $75m benefit because of $263m of discrete tax benefits, so the effective rate was minus 6.6%, and net earnings from continuing operations rose 32.9% to $1,207m. Adjusted EPS was $2.11, which Danaher put at about 11.5% growth.
Over the first nine months of 2026 sales were $18,770m, up 5.9%, GAAP operating profit was $3,716m and adjusted EPS was $6.11, against $5.57. Danaher's sales were $23.89bn in 2023, $23.88bn in 2024 and $24.57bn in 2025, and consensus expects $26.26bn in 2026 and $28.28bn in 2027.
- 31 Dec 20252025 ends with sales of $24.57bn, up 2.9%; DHR closes at $228.92Form 10-K; Yahoo Finance
- 21 Jan 2026DHR closes at $242.05, its 52-week closing highYahoo Finance
- 15 May 2026DHR closes at $161.91, its 52-week closing lowYahoo Finance
- 10 Jun 2026Danaher completes the Masimo acquisition for about $9.8bn in cash, $180 a shareForm 10-Q
- 25 Sep 2026Q3 2026 ends: sales $6,554m, core growth excluding respiratory testing 5.5%8-K Ex 99.1
- 28 Sep 2026Danaher buys StatLab Medical Products for about $1.4bn, including assumed debtForm 10-Q
- 21 Oct 2026Results and call; DHR rises 4.3% to $233.868-K; call; Yahoo Finance
- 2 Nov 2026DHR closes at $227.97, the price used in our valuationYahoo Finance
- Q4 2026Core growth of about 3%, or 4-5% excluding respiratory; adjusted operating margin about 29.5%8-K Ex 99.1; earnings call
- 2027Management's starting point: 4-5% core growth excluding respiratory testingEarnings call
Which Danaher segments grew fastest?
On reported sales, Diagnostics grew fastest, by 17.0% to $2,882m, because it now includes Masimo. On core growth the order reverses: Biotechnology grew 5.0%, Life Sciences 4.5% and Diagnostics 0.5%.
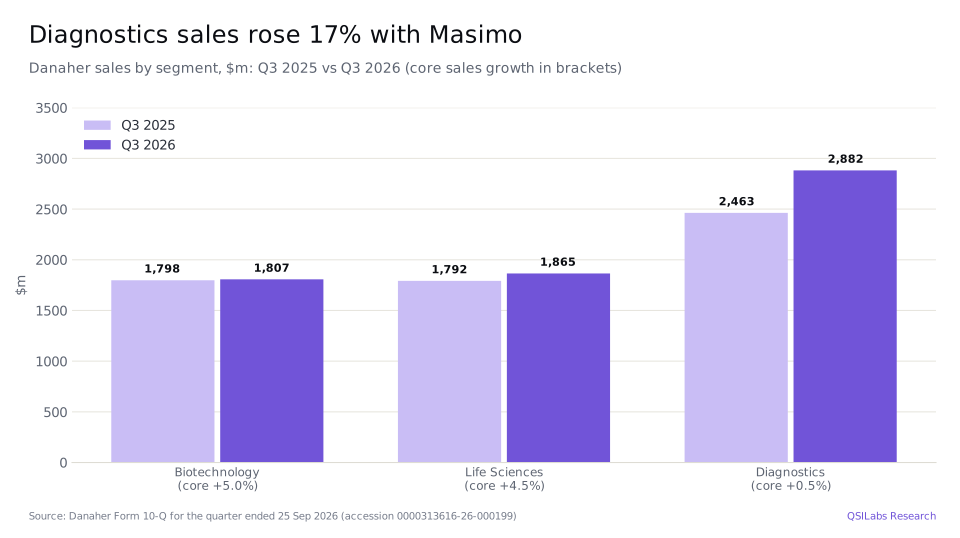
Biotechnology sales were $1,807m, up 0.5%: core growth of 5.0% was offset by tariff refunds to customers, which cut reported growth by 4 points, and by currency. Bioprocessing, mostly Cytiva, grew towards the upper end of mid-single digits, with consumables up mid-single digits and equipment up low single digits, while discovery and medical fell low single digits. Bioprocessing orders grew mid-teens, led by upstream consumables and resins. Chief financial officer Matt Gugino said "we would expect to see bioprocessing growth rates continue to improve in 2027" and that Danaher is confident the business can deliver "sustainable high single digit long-term revenue growth".
Life Sciences sales rose 4.1% to $1,865m. Pall's applied filtration business grew mid-single digits on aerospace and microelectronics, and the instruments businesses grew mid-single digits, led by SCIEX mass spectrometers such as the ZenoTOF 8600.
Diagnostics core sales grew 7.0% excluding respiratory testing. Cepheid's non-respiratory tests grew low double digits, led by group A strep, virology and sexual health, while respiratory sales fell to about $350m. Clinical diagnostics grew mid-single digits, and Gugino said new products such as the DxI 9000 analyser and easing China policy headwinds support Beckman Coulter's position.
By region, sales in high-growth markets rose 15%, with core growth of 10% and high-single-digit core growth in China; these markets were about 31% of third-quarter sales. Gugino said North America core sales were "down low single digits, primarily driven by lower respiratory revenue".
What did Masimo and StatLab add?
Danaher bought Masimo, a maker of noninvasive patient monitoring technologies, on 10 June 2026 for about $9.8bn in cash, or $180 a share. The 10-Q allocates $4.9bn of the price to goodwill and $5.0bn to intangible assets, including $3.4bn of developed technology. The third quarter was Masimo's first full quarter in Danaher, and its sales grew high single digits. Sawyer Montgomery said Masimo continued to track ahead of Danaher's initial expectations.
The acquisition charges are large. Amortization of intangible assets in Diagnostics rose to $133m from $48m, and a fair value adjustment to Masimo inventory cost 1.3 points of Danaher's operating margin. The 10-Q puts the dilutive effect of acquired businesses on the margin at a further 1.25 points.
On 28 September 2026 Danaher bought StatLab Medical Products, which makes pre-analytical consumables and equipment for pathology laboratories and joins Leica Biosystems, for about $1.4bn including assumed debt. StatLab had about $250m of sales in 2025 and will be reported in Diagnostics from the fourth quarter.
How profitable is Danaher?
On Danaher's adjusted measure, the operating margin was 29.0% in the third quarter, 1.1 points higher than a year earlier, which Gugino put down mainly to operational execution with "a modest benefit from tariff refunds received during the quarter". Danaher expects about 29.5% in the fourth quarter.
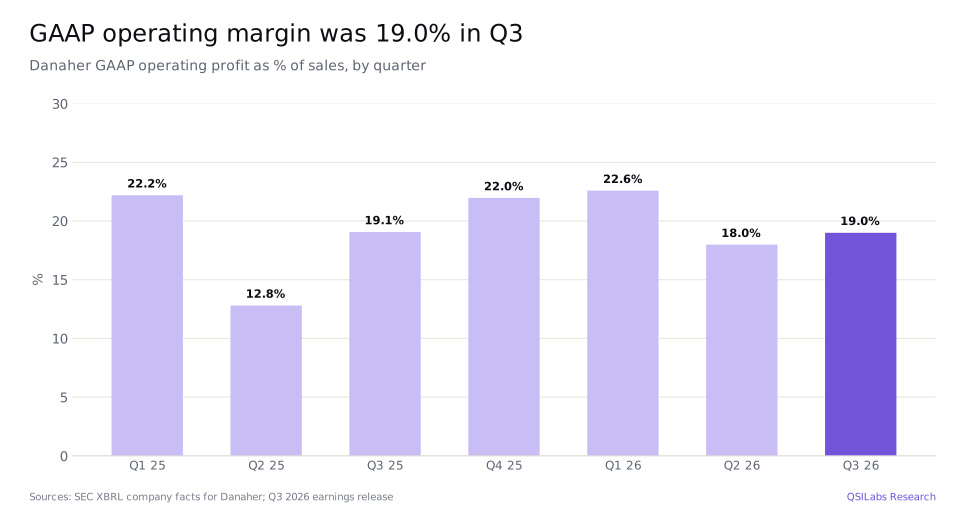
The GAAP margin moves more because of impairments and acquisition charges. It was 19.0% in the third quarter, against 19.1% a year earlier: Masimo's inventory adjustment, the dilution from acquired businesses and 0.2 points of compensation for new special long-term equity awards to founders and senior leaders pulled it down, while higher core sales, tariff refunds and the absence of the 2025 impairment charges lifted it. By segment, the Biotechnology margin rose to 26.4% from 19.6%, Life Sciences to 13.9% from 12.4%, and Diagnostics fell to 21.3% from 27.0%.
Danaher's outlook says fourth-quarter corporate expense of about $90m excludes about $200m of stock-based compensation for the special equity awards, including a $185m charge for awards that have been cancelled. It expects amortization of about $500m in the fourth quarter and about $1.9bn for 2026, and an effective tax rate of about 17.0%.
How does Danaher use its cash?
Free cash flow was $1,632m in the third quarter and $3,982m over nine months, 128% of net income according to Gugino. Over the nine months Danaher paid $790m of dividends, against $652m, and bought back $894m of shares, against $3,088m a year earlier, as it paid for Masimo. To fund the deal it borrowed $6,555m in longer-dated debt and a net $3,666m in short-term borrowings and repaid $1,434m.
At 25 September Danaher had cash of $5,682m and debt of $26,482m, including euro commercial paper, for net debt of $20.8bn; its $5bn credit facility was undrawn. The quarterly dividend is $0.40 a share, up from $0.32 in 2025, or $1.60 a year, a yield of about 0.70% at $227.97. Danaher had 703.5m shares outstanding on 15 October, and remaining performance obligations of about $7.4bn.
How has DHR stock performed?
Danaher closed at $227.97 on 2 November 2026, 0.4% below its $228.92 close at the end of 2025. Its 52-week closing high was $242.05 on 21 January 2026 and its low $161.91 on 15 May 2026, so the shares have recovered about 41% from the low. On results day, 21 October, they rose 4.3% to $233.86.
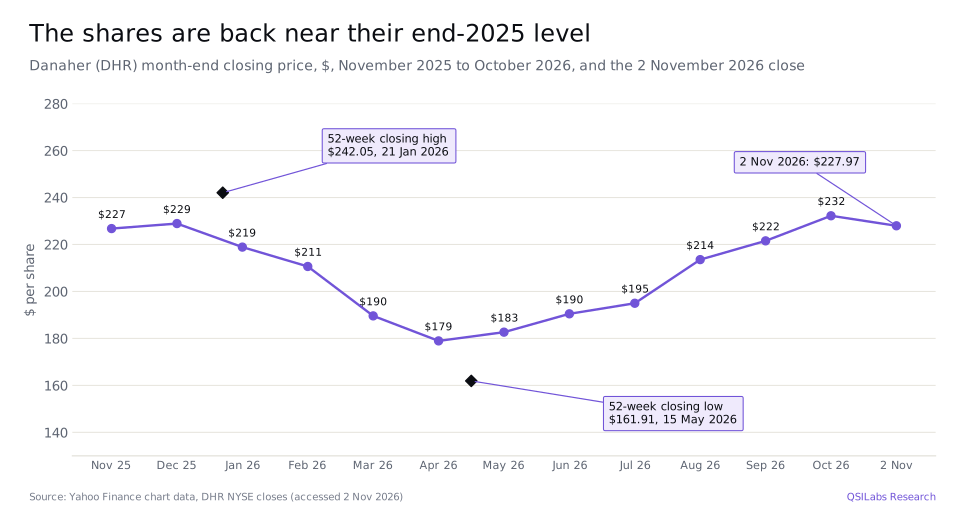
At $227.97 the market value is about $160.4bn on 703.5m shares. The shares trade at 26.5 times consensus 2026 adjusted EPS of $8.59 and 24.5 times 2027 EPS of $9.32.
Danaher stock Q3 2026: is DHR overvalued?
On our model, yes, by a wide margin. Our base case is $88.79 a share; the $227.97 close is 2.6 times that, and our value is 61% below the price. The 24 analysts tracked by S&P Global take the opposite view: their targets run from $220 to $310, with an average of $259.9 and a median of $260.
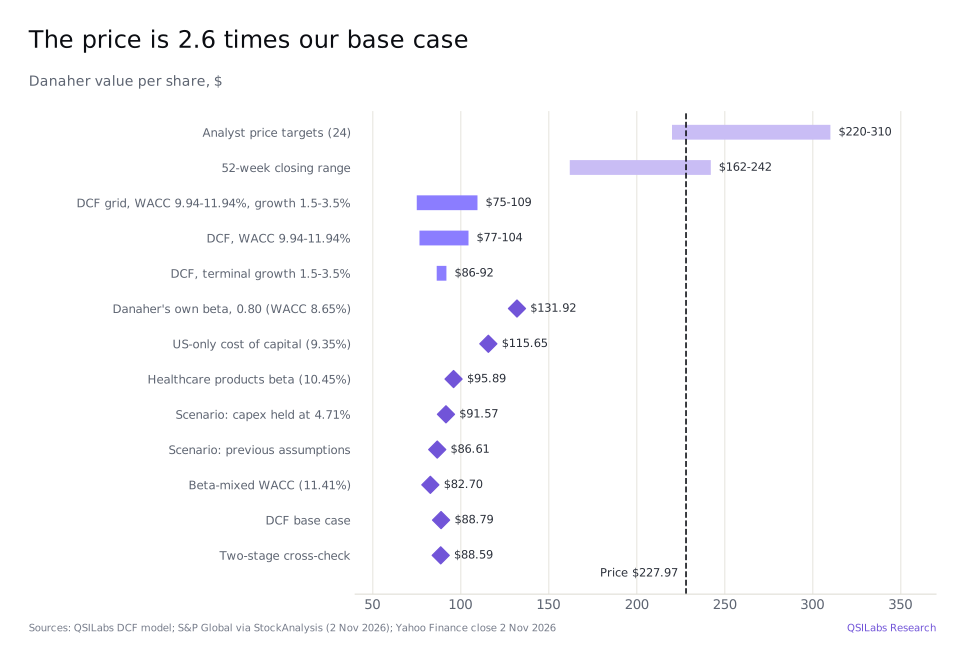
In October 17 analysts rated Danaher a Strong Buy, 3 a Buy and 4 a Hold. On 22 October UBS reiterated a $260 target, Goldman Sachs raised its target to $275 from $250, TD Cowen to $270 from $255, J.P. Morgan to $270 from $250 and Stifel to $260 from $220.
Three things explain most of the gap. First, the cost of capital: our beta of 1.31 comes from Damodaran's global industry data, while Danaher's own five-year beta is 0.80; with that beta the value is $131.92, still well below the price. Second, reinvestment: our method raises capital spending from 4.7% of revenue to 6.9% by 2035, the level needed to support 2.5% growth forever at a 15% return on new capital, which holds free cash flow growth to about 5% a year. Third, the terminal value: it is 7.6 times our 2035 EBITDA, while the market values Danaher at about 22 times trailing EBITDA. At $227.97 the market values the operations at about $181.9bn, 31 times our 2026 unlevered free cash flow of $5.78bn, which assumes faster or longer growth than we model.
Method
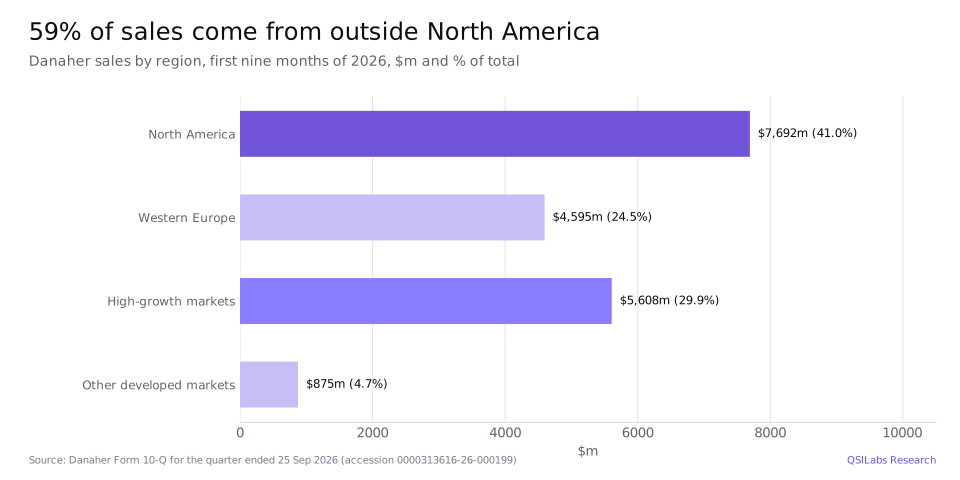
We forecast revenue and operating margin year by year to 2035, apply a 17.0% tax rate, Danaher's guided effective rate for 2026, and deduct capital spending and working capital to reach unlevered free cash flow. We discount those cash flows at a 10.94% weighted average cost of capital. The cost of equity is 11.94%: a 5.12% risk-free rate plus a beta of 1.31 times an equity risk premium of 5.20%. The beta is Damodaran's global unlevered beta of 1.168 for the healthcare information and technology industry, the industry Damodaran assigns Danaher to, relevered at Danaher's debt-to-equity ratio of 16.4%. The equity risk premium is weighted by where Danaher made its sales in the first nine months of 2026: 41.0% in North America, 24.5% in Western Europe, 4.7% in other developed markets and 29.9% in high-growth markets, of which we treat 10.7 points as China, its share of 2025 sales. Debt is 14.1% of capital at an after-tax cost of 4.85%. After 2035 we assume growth of 2.5% a year; that terminal value is 47.2% of our enterprise value of $84.66bn.
To reach equity value of $62.73bn we add cash of $5.68bn and about $0.60bn of cash generated between 25 September and 2 November, and deduct $26.48bn of debt, $12m of minority interests, $1.40bn for StatLab, which was bought after the balance-sheet date, the $0.28bn dividend that went ex on 30 September and about $0.04bn of after-tax interest. Divided by 706.5m diluted shares, that gives $88.79.
For 2026 and 2027 we use S&P Global consensus revenue of $26.26bn, up 6.9%, and $28.28bn, up 7.7%, which includes a full year of Masimo and StatLab. For 2028 we apply consensus three-year revenue growth of 7.10% a year from 2025, which gives $30.18bn. In 2029 and 2030 revenue grows 6.75%, the average of two market forecasts: 6.6% a year for life science instruments from 2026 to 2030, from The Business Research Company, and 6.9% a year for in vitro diagnostics from 2025 to 2030, from Frost & Sullivan. Growth then slows evenly to 2.5% in 2035, when revenue is $42.23bn.
The operating margin is Danaher's adjusted margin of 29.0%, consensus for 2026 and close to the 29.5% guided for the fourth quarter, held flat and reduced by acquisition-related amortization: about $1.9bn in 2026, $1.94bn a year from 2027 to 2029, including Masimo, and $1.74bn from 2030. That gives a GAAP margin of 19.9% in 2026, including the fourth-quarter equity award charge, 22.1% in 2027, 23.9% in 2030 and 24.9% in 2035. Capital spending is $1.13bn in 2026 and $1.33bn, or 4.71% of revenue, in 2027, then rises to 6.88% by 2035; Danaher spent 4.7% of sales in 2025.
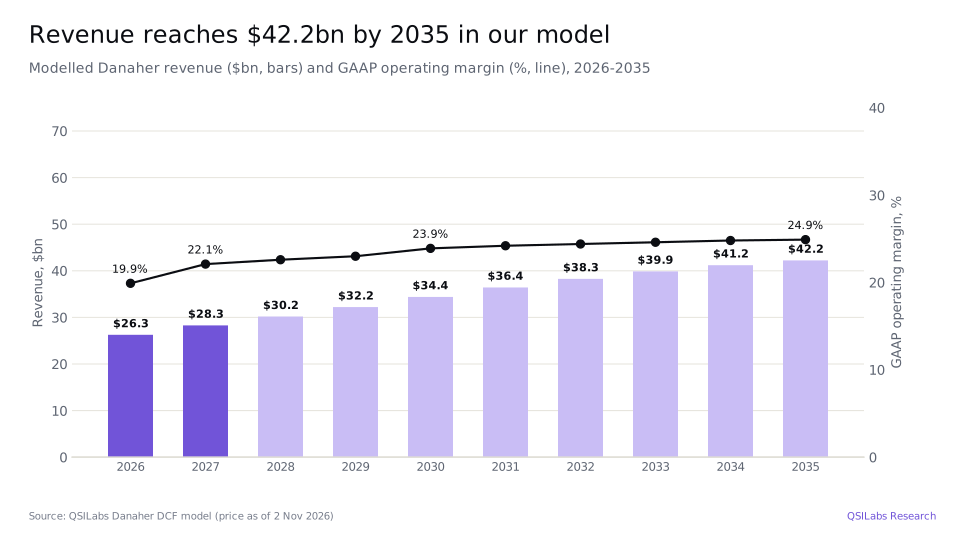
We forecast unlevered free cash flow of $5.78bn in 2026, $6.53bn in 2027 and $6.89bn in 2028, rising to $7.58bn in 2030 and $8.81bn in 2035. Our previous model, priced at the $233.86 close on 21 October, gave $114.19. It used growth rates without sources, from 8.5% in 2027 to 3.0% in 2035, a GAAP margin rising from 21.0% to 26.0%, a 19% tax rate and capital spending of $1.10bn and $1.25bn in 2026 and 2027. We have replaced those assumptions with the sourced paths above. Run with today's price, balance sheet and cost of capital, the old assumptions give $86.61, so most of the fall from $114.19 comes from the cost of capital and the balance sheet after the Masimo and StatLab deals rather than from the new forecast.
How the number moves if you argue with us
The table shows our value per share at different costs of capital and terminal growth rates. Even at a 9.94% cost of capital and 3.5% terminal growth, the value is $109.48, less than half the share price.
| Cost of capital | Growth 1.5% | Growth 2.0% | Growth 2.5% | Growth 3.0% | Growth 3.5% |
|---|---|---|---|---|---|
| 9.94% | $100.39 | $102.27 | $104.38 | $106.76 | $109.48 |
| 10.44% | $92.95 | $94.44 | $96.09 | $97.94 | $100.03 |
| 10.94% | $86.31 | $87.49 | $88.79 | $90.23 | $91.83 |
| 11.44% | $80.36 | $81.29 | $82.31 | $83.43 | $84.66 |
| 11.94% | $74.98 | $75.72 | $76.52 | $77.38 | $78.33 |
We also ran six scenarios through the model. Using Danaher's own five-year beta of 0.80, a cost of capital of 8.65%, gives $131.92. A cost of capital built only from Damodaran's US table, 9.35%, gives $115.65, and Damodaran's healthcare products industry beta, 10.45%, gives $95.89. Holding capital spending at 4.71% of revenue every year, rather than rising to 6.88%, gives $91.57. Our previous assumptions, with today's price, balance sheet and cost of capital, give $86.61, and a cost of capital built from separate betas for each region, 11.41%, gives $82.70. A two-stage version of the terminal value gives $88.59.
Risks to the Danaher investment case
- Respiratory testing. Respiratory sales fell to about $350m in the quarter and are expected to be about $1.5bn in 2026. Sawyer Montgomery said flu-season variability "can create a couple hundred million dollars of bookends" around that figure.
- Academic and pharma budgets. Sawyer Montgomery said "academic demand remained below historic levels", though it improved on the second quarter. Discovery and medical sales fell low single digits.
- Acquisition integration and charges. Masimo and StatLab cost about $11.2bn. Masimo's inventory adjustment and amortization lowered the Diagnostics margin to 21.3% from 27.0%, and the special equity awards will cost about $200m in the fourth quarter.
- Debt. Debt rose to $26.48bn at 25 September, including $4.7bn of euro commercial paper, and buybacks fell to $894m over nine months from $3,088m.
- Tariffs and China. Tariff refunds to customers cut Biotechnology's reported growth by 4 points in the quarter. China's healthcare policy changes weighed on Diagnostics; Gugino said the segment has moved beyond the most significant impacts.
- Upside risks. Mid-teens bioprocessing order growth, high-single-digit growth at Masimo and management's 4-5% core growth starting point for 2027 could lift results above our forecast, and a cost of capital closer to Danaher's own beta would raise our value.
FAQ
What value does QSILabs put on Danaher stock?
$88.79 a share in our base case, from a discounted cash flow model priced on 2 November 2026, when the shares closed at $227.97. Our sensitivity grid ranges from $74.98 to $109.48, and a two-stage cross-check gives $88.59. Our previous model, priced on 21 October, gave $114.19.
Is Danaher stock a buy after its Q3 2026 results?
The quarter beat Danaher's own expectations: core growth excluding respiratory testing was 5.5%, free cash flow rose 19% and guidance went up. On our model the shares trade well above our value, but 20 of 24 analysts rate them a Buy or Strong Buy, and the gap depends heavily on the cost of capital. This is not investment advice.
How much did Danaher sell in Q3 2026?
$6,554m in the quarter to 25 September 2026, up 8.3% from $6,053m a year earlier. Diagnostics provided $2,882m, Life Sciences $1,865m and Biotechnology $1,807m. Consensus expects $26.26bn for the full year.
What is core sales growth excluding respiratory testing?
It is Danaher's measure of underlying growth, excluding acquisitions, currency, tariff refunds to customers and the swings in Cepheid's respiratory test sales. It was 5.5% in the third quarter, against 3.0% for core growth including respiratory testing.
How is the Masimo deal going?
Masimo, bought for about $9.8bn in June 2026, grew sales high single digits in its first full quarter, and management said it is tracking ahead of expectations. It also raised Diagnostics amortization to $133m from $48m.
What dividend does Danaher pay?
$0.40 a share each quarter, or $1.60 a year, a yield of about 0.70% at $227.97. The quarterly dividend was $0.32 in 2025. Danaher also bought back $894m of shares in the first nine months of 2026.
What price target do analysts have for DHR?
The 24 analysts tracked by S&P Global have an average price target of $259.9, a median of $260, a low of $220 and a high of $310, according to StockAnalysis on 2 November 2026.
What did Danaher guide for 2026 and 2027?
For 2026, adjusted EPS of $8.57-8.62, up from $8.45-8.60, with fourth-quarter core growth of about 3%, or 4-5% excluding respiratory testing, and an adjusted operating margin of about 29.5%. For 2027, management called 4-5% core growth excluding respiratory testing "the right starting point".
Why is the QSILabs value so far below the share price?
Mainly the cost of capital and reinvestment. We use a beta of 1.31 from global industry data rather than Danaher's own 0.80, which gives a 10.94% cost of capital, and our method raises capital spending to 6.9% of revenue by 2035. With Danaher's own beta the value is $131.92.
What does Danaher do?
Danaher sells equipment, consumables, software and services to biopharma companies, research labs, hospitals and diagnostic labs through three segments: Biotechnology, including Cytiva's bioprocessing products; Life Sciences, including SCIEX, Beckman Coulter Life Sciences and Pall; and Diagnostics, including Cepheid, Beckman Coulter Diagnostics, Leica Biosystems and now Masimo.
Sources
- Danaher Corporation, third quarter 2026 earnings release (Form 8-K, Exhibit 99.1, 21 Oct 2026; accession 0000313616-26-000201) www.sec.gov
- Danaher Corporation, Form 10-Q for the quarter ended 25 Sep 2026 (accession 0000313616-26-000199) www.sec.gov
- Danaher Corporation, Form 10-K for 2025 (accession 0000313616-26-000062): sales by region, intangible amortization schedule and capital spending www.sec.gov
- SEC XBRL company facts for Danaher (CIK 313616): quarterly sales and operating profit, 2025-2026 data.sec.gov
- Danaher Q3 2026 earnings call transcript, 21 Oct 2026, via The Motley Fool (accessed 2 Nov 2026) www.fool.com
- StockAnalysis: Danaher forecast and analyst ratings, S&P Global data (accessed 2 Nov 2026) stockanalysis.com
- StockAnalysis: Danaher statistics (accessed 2 Nov 2026) stockanalysis.com
- The Business Research Company, Life Science Instrumentation Global Market Report 2026 www.thebusinessresearchcompany.com
- Frost & Sullivan, global in vitro diagnostics market forecast, industry overview in an HKEX listing document (2026) www1.hkexnews.hk
- Yahoo Finance chart data: DHR closing prices and dividends (November 2025 to November 2026) query1.finance.yahoo.com
- Damodaran Online: global industry betas, costs of capital and country equity risk premiums, January 2026 pages.stern.nyu.edu
- QSILabs Danaher discounted cash flow model (internal; price as of 2 Nov 2026)
Disclaimer
This article is for information only and is not investment advice, a recommendation or an offer to buy or sell any security. QSI Labs and its authors may hold positions in the securities discussed. Forecasts and valuations are estimates that depend on assumptions that may prove wrong. Figures are taken from company filings and third-party sources believed to be reliable, but we do not guarantee their accuracy. Do your own research or consult a licensed adviser before investing.
More from QSI Labs
Related analysis: Thermo Fisher stock Q3 2026: organic growth, Abbott stock Q3 2026: nutrition spin and Libre, Johnson & Johnson stock Q3 2026: talc and Tremfya and Eli Lilly stock Q3 2026: Mounjaro and Zepbound.
Read our white paper, QSI Labs: An AI-Native Trading Firm Built on a Training Loop (October 2026), available on request, or browse the research index.