Research / Earnings and valuation
Abbott Stock Q3 2026:Sales Rise 14.5% as Abbott Plans a Nutrition Spin-Off
As of: Figures are as of Abbott Laboratories' third-quarter 2026 results (the quarter ended 30 September 2026, reported 21 October 2026 in a Form 8-K) and its Form 10-Q for the quarter ended 30 June 2026, the latest balance sheet available when we wrote this. Abbott's fiscal year is the calendar year, so its Q3 2026 covers July to September 2026. The share price used in our valuation is the NYSE close of ABT on 2 November 2026, $110.16; analyst data were accessed on 2 November 2026. Published 2 November 2026.
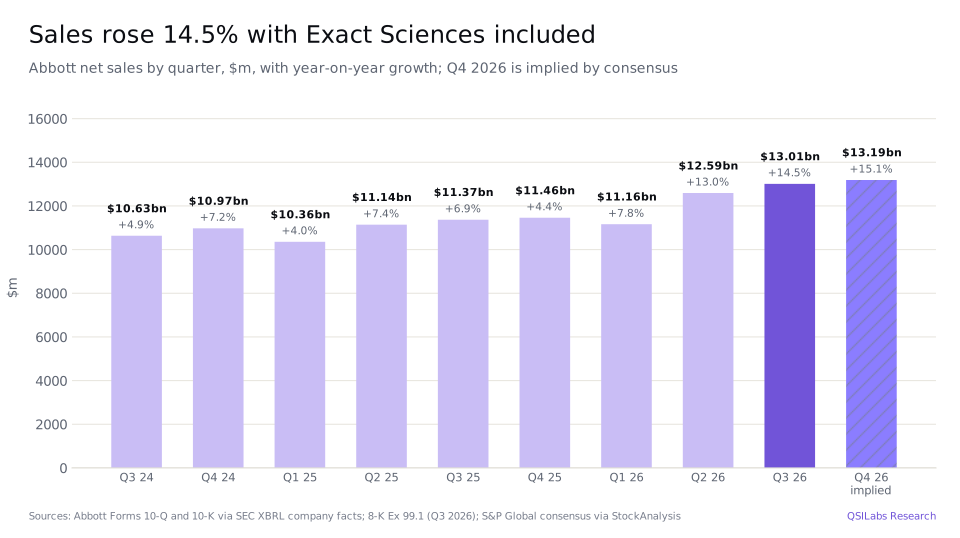
The short answer. Abbott stock Q3 2026 comes down to two pieces of news on the same day. Abbott reported sales of $13.01bn for the three months to 30 September 2026, up 14.5%, or 7.0% on a comparable basis that strips out the Exact Sciences acquisition and currency moves, and adjusted earnings per share of $1.42, up 9.2%. It also said it intends to separate its Nutrition business, with about $8.5bn of annual sales, into an independent listed company by the end of 2027. GAAP earnings per share fell to $0.53 from $0.94, because of amortisation from the Exact deal and about $670m of legal settlements. Our discounted cash flow model values the shares at $58.11, against a $110.16 close on 2 November 2026; that gap rests mostly on a 10.35% cost of capital, so we show below how far it moves when you change that and the other inputs.
Key takeaways
- Comparable growth picked up to 7.0%. Sales were $13,013m, up 14.5% reported. On a comparable basis growth was 7.0%, against 5.2% for the first nine months, and every segment grew.
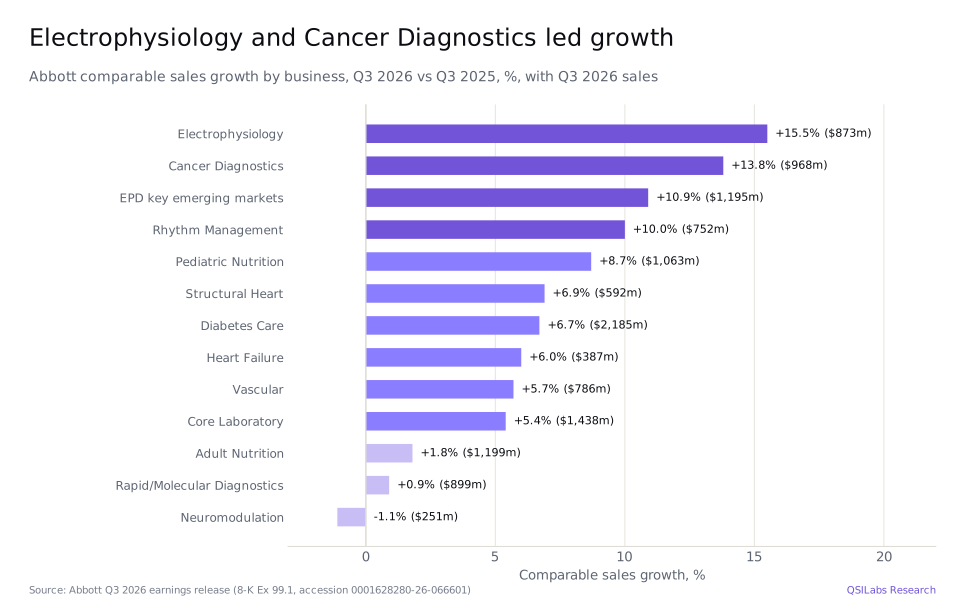
- Devices led. Medical Devices sales rose 7.8% on a comparable basis to $5,826m. Electrophysiology grew 15.5% and Rhythm Management 10.0%, while Diabetes Care grew 6.7%.
- Exact Sciences is now in Diagnostics. Cancer Diagnostics, the former Exact Sciences, had sales of $968m and comparable growth of 13.8%. Abbott completed the roughly $20.6bn acquisition on 23 March 2026.
- Adjusted EPS up 9.2%, GAAP EPS down 43.6%. Adjusted earnings per share were $1.42 and GAAP earnings per share $0.53. Amortisation of intangible assets doubled to $841m and the quarter included about $670m of legal settlements.
- Nutrition will be spun off. Abbott plans a tax-free distribution of the Nutrition business to its shareholders by the end of 2027. Without Nutrition, it says sales growth would be 50 to 100 basis points higher and operating margin about 100 basis points higher.
- Guidance tightened. Abbott expects 2026 adjusted EPS of $5.50 to $5.55, keeping the midpoint, and comparable sales growth of about 6.0%. It forecasts fourth-quarter adjusted EPS of $1.62 to $1.67.
- Our value: $58.11 a share, against a $110.16 close on 2 November 2026. A two-stage cross-check gives $57.58; with the 8.68% US industry cost of capital the model gives $78.57. Analysts' average target is $118.52.
- What to watch. Libre Duo's U.S. launch in December, pricing in continuous glucose monitors outside the U.S., the electrophysiology ramp, the 2027 guidance due in January and the terms of the Nutrition separation.
Key numbers from Abbott's Q3 2026 earnings
| Measure | Q3 2026 | Q3 2025 | Change |
|---|---|---|---|
| Net sales | $13,013m | $11,369m | +14.5% |
| Comparable sales growth | 7.0% | n/a | n/a |
| Cost of products sold, excluding amortisation | $5,628m | $5,075m | +10.9% |
| Amortisation of intangible assets | $841m | $420m | +100.2% |
| Research and development | $920m | $766m | +20.1% |
| Selling, general and administrative | $4,266m | $3,051m | +39.8% |
| Operating earnings | $1,358m | $2,057m | -34.0% |
| Net earnings | $920m | $1,644m | -44.1% |
| Diluted earnings per share | $0.53 | $0.94 | -43.6% |
| Adjusted diluted earnings per share | $1.42 | $1.30 | +9.2% |
Source: Abbott Q3 2026 earnings release (Form 8-K, Exhibit 99.1).
Abbott Q3 2026 earnings: what happened
Abbott reported third-quarter results on 21 October 2026. Net sales rose 14.5% to $13,013m from $11,369m. Comparable growth, which excludes the effect of Exact Sciences and of exchange rates, was 7.0%; currency reduced reported sales growth by 0.4 percentage points. For the first nine months, sales were $36,770m and comparable growth was 5.2%.
Chief executive Robert Ford said Abbott "delivered strong third-quarter results, reflecting balanced growth across our portfolio". Chief financial officer Philip Boudreau said adjusted earnings per share of $1.42 were in line with Abbott's guidance and the consensus estimate.
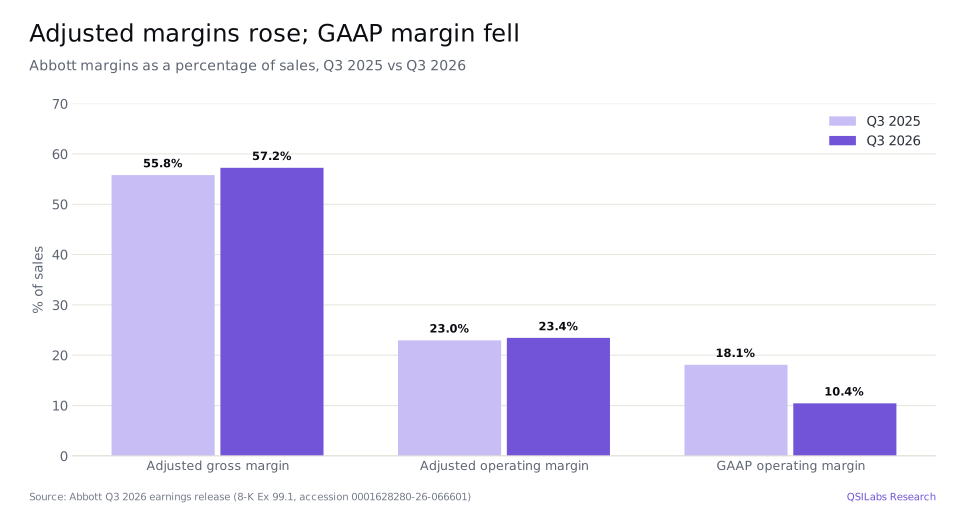
The adjusted gross margin was 57.2% of sales, up 140 basis points, which Boudreau put down to favourable business mix, the addition of Exact Sciences and continued operational improvements. Adjusted research and development spending was 6.9% of sales and adjusted selling, general and administrative expense 26.9%, leaving an adjusted operating margin of 23.4%, up 40 basis points.
- 14 Nov 2025ABT closes at $130.59, its 52-week closing highYahoo Finance
- 31 Dec 2025ABT ends 2025 at $125.29Yahoo Finance
- 23 Mar 2026Acquisition of Exact Sciences completed for about $20.6bn, funded mainly by $20.0bn of new debtForm 10-Q
- 11 May 2026ABT closes at $82.56, its 52-week closing lowYahoo Finance
- August 2026FDA approval for the Libre Duo glucose-ketone sensor; CE Mark for the Amulet 360 occluder8-K Ex 99.1
- September 2026FDA approval for the TactiFlex Duo ablation catheter; SimpleScreen CRC blood test launched8-K Ex 99.1
- 21 Oct 2026Q3 results and plan to separate Nutrition announced; ABT closes at $100.518-K; Yahoo Finance
- 2 Nov 2026ABT closes at $110.16, the price used in our valuationYahoo Finance
- December 2026Planned U.S. launch of Libre DuoQ3 2026 earnings call
- January 2027Abbott expects to give its 2027 guidanceQ3 2026 earnings call
- By end of 2027Separation of the Nutrition business expected to be completed8-K Ex 99.1
Why did GAAP earnings fall while adjusted EPS rose?
Because of costs Abbott excludes from its adjusted figures. These "specified items" came to $1,689m before tax in the third quarter, against $548m a year earlier. They included $841m of amortisation of intangible assets, double the $420m of a year earlier now that Exact Sciences' technology is on the balance sheet, about $670m of legal settlements and $178m of other costs linked to acquisitions and restructuring.
On a GAAP basis, operating earnings fell 34.0% to $1,358m, a margin of 10.4% against 18.1%. Net interest expense rose to $297m from $44m after Abbott issued $20.0bn of debt in March to pay for Exact Sciences. Net earnings fell 44.1% to $920m, or $0.53 a diluted share. Excluding specified items, net earnings rose 8.7% to $2,477m and earnings per share rose 9.2% to $1.42, helped by a lower share count of 1,738m against 1,749m.
The tax rate on earnings excluding specified items was 15.2% for the quarter and for the first nine months. The GAAP tax rate for the nine months was 30.4%, raised by about $95m of tax on prior-year positions and about $540m of adjustments to an earlier deferred tax benefit, according to the release.
How did Abbott's four businesses perform?
All four segments grew on a comparable basis, and Medical Devices, the largest, grew fastest.
| Segment | Q3 2026 sales | Reported growth | Comparable growth |
|---|---|---|---|
| Medical Devices | $5,826m | +6.9% | +7.8% |
| Diagnostics | $3,305m | +46.7% | +6.4% |
| Nutrition | $2,262m | +5.1% | +4.9% |
| Established Pharmaceuticals | $1,614m | +6.8% | +8.4% |
Source: Abbott Q3 2026 earnings release (Form 8-K, Exhibit 99.1).
Medical Devices. Electrophysiology sales rose 15.0% to $873m, or 15.5% on a comparable basis. Ford said U.S. growth was in the high teens and exceeded 20% excluding left atrial appendage devices, helped by the full U.S. launch of the Volt pulsed field ablation catheter. Abbott won FDA approval for its TactiFlex Duo catheter in September, earlier than Ford expected, and plans to launch Volt in Japan in the fourth quarter. Rhythm Management grew 10.0%. Diabetes Care sales were $2,185m, up 6.7% on a comparable basis, and continuous glucose monitor sales grew 7.7%. Neuromodulation fell 1.1%.
Diabetes growth is slowing. Ford said he expects it to be in the "low to mid-single" digits in the fourth quarter and for the next few quarters, because of "a harder challenge in penetrating the type 2 population" until Medicare reimbursement expands, and "a little bit more pricing pressure in the international markets". Abbott received FDA approval in August for Libre Duo, which it calls the world's first dual glucose-ketone biowearable sensor, and plans to launch it in the U.S. in December.
Diagnostics. Reported sales rose 46.7% to $3,305m because of Exact Sciences, whose sales now appear as Cancer Diagnostics: $968m, with comparable growth of 13.8%, driven by Cologuard. Abbott launched SimpleScreen CRC, a blood-based colorectal cancer screening test, in September. Core Laboratory sales grew 5.4% and Rapid and Molecular Diagnostics 0.9%. Ford said a cybersecurity event in July, after which some customers cut the connection to Abbott's systems for 7 to 10 days, "cost us about a point of growth" in Cancer Diagnostics.
Nutrition. Sales rose 4.9% on a comparable basis to $2,262m. Pediatric Nutrition grew 8.7%, and 11.0% in the U.S., where Ford said contract wins in the WIC programme had helped Abbott regain market leadership. Adult Nutrition grew 1.8%.
Established Pharmaceuticals. Sales of branded generic medicines, sold only outside the U.S., rose 8.4% on a comparable basis to $1,614m, with 10.9% growth in key emerging markets.
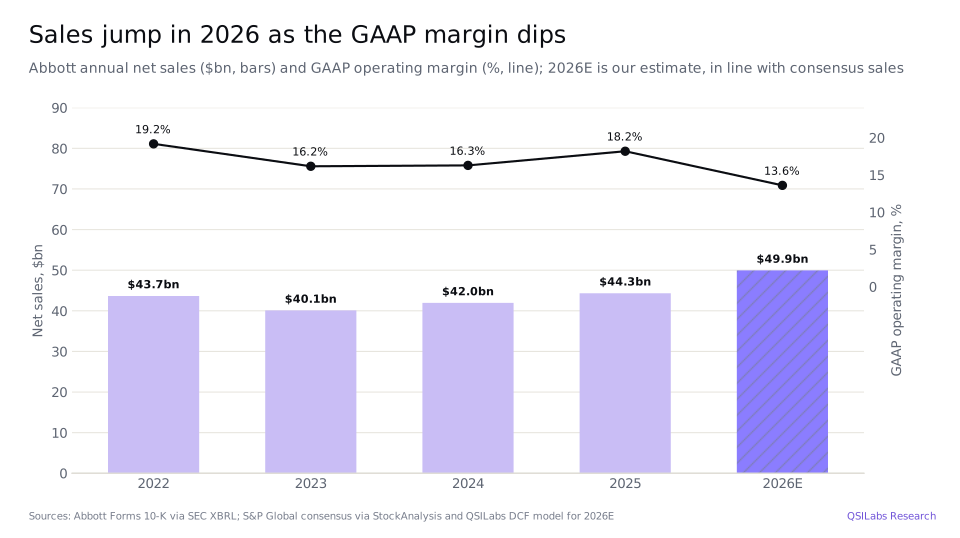
Over a longer period, sales fell to $40.1bn in 2023 as demand for COVID-19 tests faded, then rose to $42.0bn in 2024 and $44.3bn in 2025. We estimate $49.95bn for 2026, in line with the consensus of $49.96bn, including Exact Sciences from late March. The GAAP operating margin was 18.2% in 2025 and drops to about 13.6% in our 2026 estimate because of amortisation and specified items.
What does the Nutrition spin-off mean for Abbott?
Abbott plans to separate its Nutrition business, which sells Similac, PediaSure, Pedialyte, Glucerna and Ensure, through a tax-free distribution of shares to Abbott shareholders, completed by the end of 2027. The new company will have about $8.5bn of annual sales, 16,000 employees and 14 manufacturing sites, and Daniel Salvadori, who runs Established Pharmaceuticals and Nutrition, will be its chief executive. Ford said the business "will be better positioned as an independent company". Nutrition made up 17.4% of Abbott's third-quarter sales.
After the separation Abbott expects to have sales of about $42bn. Boudreau said that, excluding Nutrition, Abbott's sales growth would be 50 to 100 basis points higher, its gross margin more than 200 basis points higher and its operating margin about 100 basis points higher. The new company plans to raise debt and pass part of the proceeds to Abbott, and the two companies expect to pay dividends that together equal Abbott's dividend at the time. Separation costs will be excluded from adjusted earnings.
On the call an analyst asked where the liability for the NEC lawsuits would sit. Ford said Abbott would give details as the process continues and that resolving the litigation is not a prerequisite for the separation. Our model keeps Nutrition consolidated, because the terms, including the debt split, have not been set.
How much cash does Abbott generate?
Abbott's cash flow from operations was $9,566m in 2025 and capital spending $2,171m, leaving free cash flow of $7,395m, up from $6,351m in 2024 and $5,059m in 2023. In the first half of 2026 operating cash flow was $3,803m, including $856m of cash taxes, and capital spending was $896m.
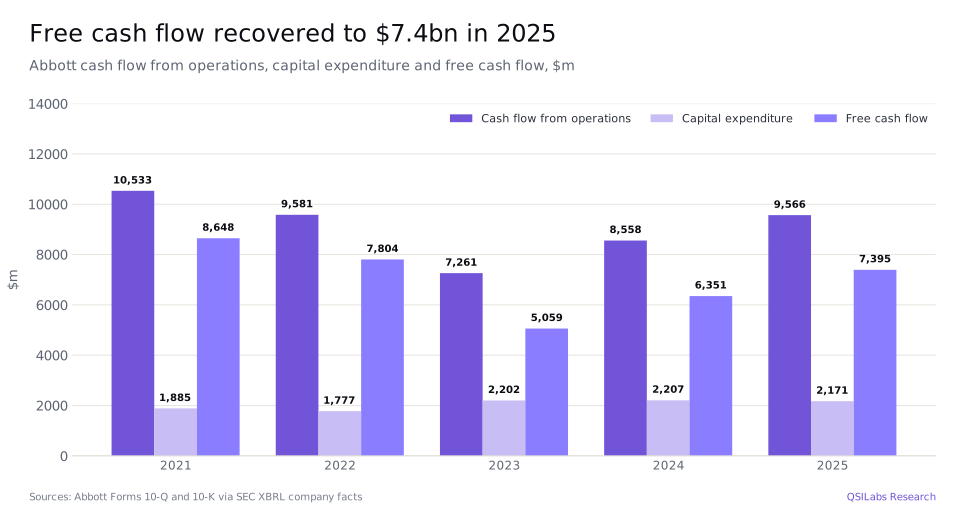
Abbott paid $4,116m of dividends in 2025 and pays $0.63 a share each quarter in 2026, or $2.52 a year. Debt was $32,608m at 30 June 2026, the latest balance sheet available, against cash of $5,603m; Ford said net debt is about two times EBITDA, which leaves room for small acquisitions or returning cash to shareholders.
How has ABT stock performed in 2026?
Poorly. ABT closed at $110.16 on 2 November 2026, down 12.1% from $125.29 at the end of 2025. The 52-week closing high was $130.59 on 14 November 2025 and the low $82.56 on 11 May 2026. The shares fell 1.9% to $100.51 on 21 October, the day of the results and the spin-off announcement, and have since risen 9.6%.
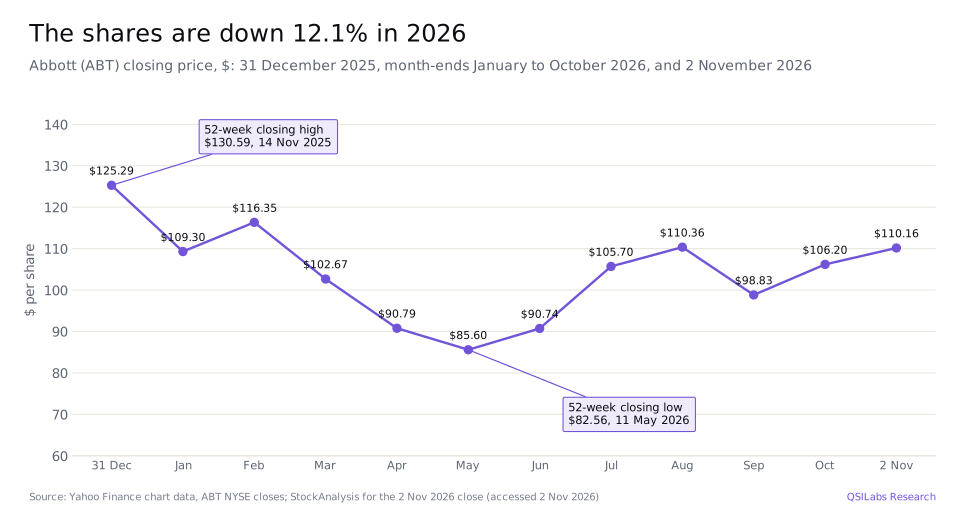
The 28 analysts compiled by StockAnalysis have an average price target of $118.52, a median of $120, a low of $100 and a high of $130, and their consensus rating is Buy. They expect adjusted earnings per share of $5.52 in 2026 and $5.94 in 2027, so the shares trade at about 20 times this year's expected earnings.
Abbott stock Q3 2026: is ABT overvalued?
On our numbers, yes. Our discounted cash flow model values Abbott at $58.11 a share, about half the $110.16 close on 2 November 2026. At that price the market value of the equity was about $191.5bn on 1,738m diluted shares, and the enterprise value, adding debt of $32.6bn and deducting cash of $5.6bn, about $218.5bn: 34 times our estimate of 2026 unlevered free cash flow, $6.42bn.
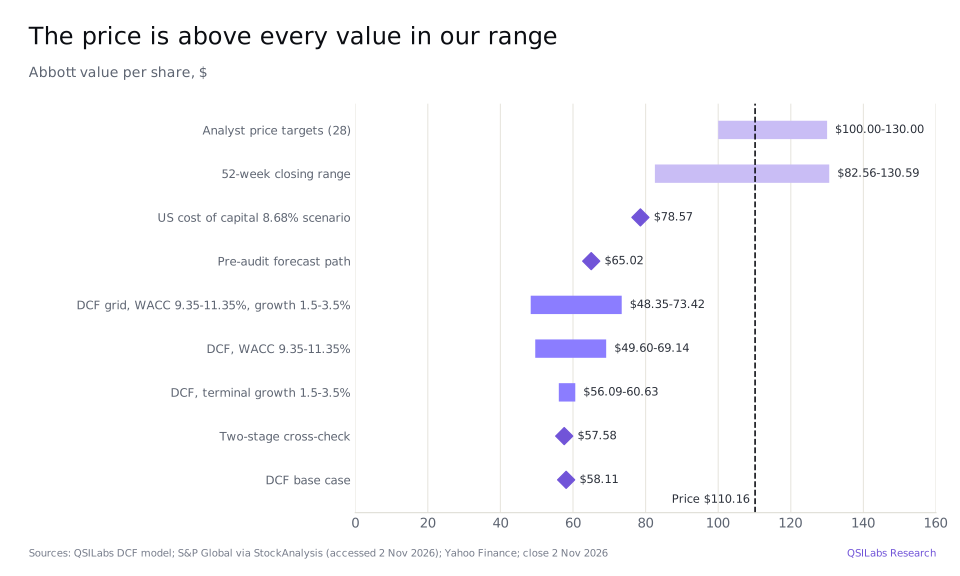
We discount forecast cash flows at a cost of capital of 10.35%. It uses a US 10-year Treasury yield of 5.12%, a beta of 1.21 and an equity risk premium of 5.11%. The beta is the global medical products industry's unlevered beta of 1.07 relevered at Abbott's debt-to-equity ratio of 0.17. The risk premium is the average of regional premiums weighted by where Abbott sells: the U.S. is 42.6% of sales, pro forma for Exact Sciences, so 57% comes from abroad. Debt is 14.6% of capital, at an after-tax cost of 4.85%. After 2035 we assume growth of 2.5% a year; that terminal value is 52.8% of our enterprise value of $129.1bn. Adding cash of $5.60bn, deducting debt of $32.61bn and $0.65bn of minority interests, and deducting $0.44bn for the two quarterly dividends and interest paid since 30 June less the cash generated over that period, gives equity value of $101.0bn, or $58.11 a share.
For 2026 we use consensus sales of $49.96bn, from S&P Global Market Intelligence data published by StockAnalysis, which implies fourth-quarter sales of about $13.19bn, up 15.1% with a full quarter of Exact Sciences. For 2027 we use consensus sales of $53.53bn, up 7.2%. For 2028 growth of 6.4% takes sales to $56.9bn, in line with the consensus three-year forecast of 8.7% annual growth from 2025. Growth is then 6.0% in 2029 and 2030, Frost & Sullivan's forecast of annual growth in the global medical device market from 2025 to 2030, and 5.7% in 2031, its forecast for 2031 to 2035, before fading to 3.0% in 2035 and 2.5% after. Abbott gives no long-term sales target.
The GAAP operating margin is 13.6% in 2026 and rises to 16.9% in 2027 and 20.6% by 2035. Most of the rise comes from amortisation of acquired intangibles, which Abbott's 10-Q estimates at about $2.6bn in 2026, falling to $1.5bn in 2030; segment margins stay at their first-half 2026 levels, except that Nutrition and Diagnostics return to their 2025 margins by 2029 and 2030, as Exact Sciences, which Ford said exited the quarter with an operating margin "in the high teens", grows into the segment. Tax is 15.2%, the nine-month rate excluding specified items. Capital spending is 5.1% of sales in 2026 and 2027, the average of 2024 and 2025, rising to 6.0% by 2035, the level our house rule sets so that long-run investment is consistent with 2.5% growth and a 15% return on new capital.
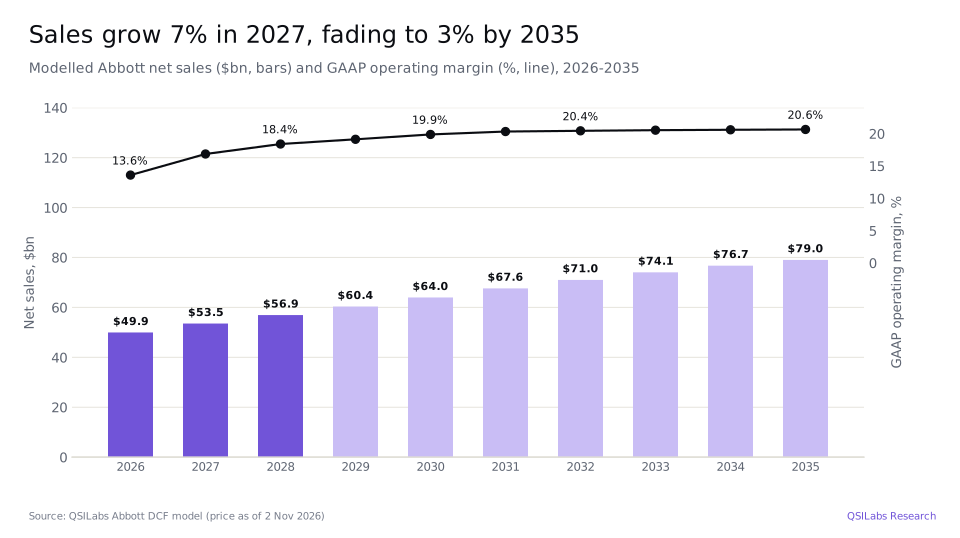
We forecast unlevered free cash flow of $6.42bn in 2026 and $8.23bn in 2027, rising to $10.14bn in 2030 and $12.53bn in 2035; only the part of 2026 after 2 November is discounted. Our previous model, dated 21 October and priced at $100.51, gave $87.45. It used the 8.68% cost of capital for US medical products companies, a 17% tax rate and growth of 8.2% in 2027 and 7.6% in 2028 without a cited source, and capital spending rising to 7.1% of sales. Run with the new cost of capital, that old forecast gives $65.02; our new forecast with the old 8.68% rate gives $78.57. Most of the fall is therefore the cost of capital, and the rest the sourced forecast.
How the number moves if you argue with us
The table shows our value per share at different costs of capital and terminal growth rates. Even at a 9.35% cost of capital and 3.5% terminal growth, the model gives $73.42, about two-thirds of the share price.
| Cost of capital | Growth 1.5% | Growth 2.0% | Growth 2.5% | Growth 3.0% | Growth 3.5% |
|---|---|---|---|---|---|
| 9.35% | $65.88 | $67.41 | $69.14 | $71.12 | $73.42 |
| 9.85% | $60.69 | $61.89 | $63.24 | $64.77 | $66.52 |
| 10.35% | $56.09 | $57.05 | $58.11 | $59.29 | $60.63 |
| 10.85% | $52.01 | $52.76 | $53.59 | $54.52 | $55.55 |
| 11.35% | $48.35 | $48.95 | $49.60 | $50.32 | $51.11 |
A two-stage version of the model, which adds a period after 2035 in which growth fades gradually to 2.5% and returns on new investment fall to 2 percentage points above the cost of capital, gives $57.58. Using regional cost of capital tables, each with its own industry beta, gives $58.16, almost the same as the base case.
Two checks point higher. The beta of 1.21 is far above Abbott's own five-year beta of 0.58, as reported by StockAnalysis, so the market has treated Abbott as much less risky than the average medical products company; a lower beta would mean a lower cost of capital and a higher value. And our terminal value is only 8.3 times final-year EBITDA, well below the multiple the market pays for Abbott today.
Our numbers and the market's can both be right only if Abbott keeps growing faster than the device market for much longer than we assume, lifts its margins well above our 20.6%, or if investors accept a much lower return than the cost of capital for medical products companies implies. Abbott's product pipeline and the planned exit from Nutrition both support the first two. We think the price already allows for most of that.
Risks to the Abbott investment case
- Diabetes pricing and competition. Continuous glucose monitors are Abbott's largest growth franchise. Ford expects diabetes growth in the low to mid-single digits for the next few quarters and price cuts in some international markets, where Abbott holds 50% to 70% market share.
- Execution in electrophysiology. Ford expects electrophysiology growth of about 20% in the fourth quarter. That depends on Volt, TactiFlex Duo and the Japanese launch winning share in pulsed field ablation.
- Exact Sciences. Abbott paid about $20.6bn and borrowed $20.0bn. Cancer Diagnostics grew 13.8%, but a cybersecurity event in July cost about a point of growth, and the deal has doubled amortisation and raised interest costs.
- The Nutrition separation. The split of debt, the dividend and any litigation liability have not been set, and separation costs will come on top of the roughly $670m of legal settlements in the third quarter.
- Currency. Abbott earns more than half its sales outside the U.S. and expects exchange rates to reduce fourth-quarter sales by about 1%.
- Valuation risk. Our value depends on a 10.35% cost of capital built on an industry beta well above Abbott's own; with the 8.68% US industry rate it rises to $78.57, and a lower rate still would raise it further.
FAQ
What value does QSILabs put on Abbott stock?
Our discounted cash flow model gives $58.11 a share, against a $110.16 close on 2 November 2026. Across costs of capital from 9.35% to 11.35% and terminal growth from 1.5% to 3.5% the value ranges from $48.35 to $73.42. A two-stage cross-check gives $57.58, and the model gives $78.57 with an 8.68% cost of capital.
Should I buy Abbott stock after the Q3 2026 results?
We do not give personal advice. On our numbers the shares trade well above the value of their cash flows, although the third quarter showed faster comparable growth and higher adjusted margins. Our value depends heavily on the cost of capital, and analysts are more positive, so read the sensitivity table and the risks above before deciding.
How much revenue did Abbott make in its latest quarter?
Abbott reported net sales of $13,013m for the third quarter of 2026, the three months to 30 September, up 14.5% from $11,369m and 7.0% on a comparable basis. Medical Devices contributed $5,826m, Diagnostics $3,305m, Nutrition $2,262m and Established Pharmaceuticals $1,614m. Net earnings were $920m, or $0.53 a diluted share.
What dividend does Abbott pay?
Abbott pays a quarterly dividend of $0.63 a share in 2026, or $2.52 a year. At the $110.16 close on 2 November 2026 that is a yield of about 2.3%. Abbott paid $4,116m of dividends in 2025, and it expects Abbott and the new Nutrition company together to pay the same dividend after the separation.
What price target do analysts have for ABT?
The 28 analysts compiled by StockAnalysis have an average target of $118.52, about 7.6% above the $110.16 close on 2 November 2026, with a median of $120, a low of $100 and a high of $130. Their consensus rating is Buy.
How much does Abbott owe?
Debt was $32,608m at 30 June 2026, $3,005m of it due within a year, against cash of $5,603m. Abbott issued $20.0bn of debt in March 2026 to pay for Exact Sciences, and Ford said net debt is about two times EBITDA.
When will the Nutrition company be separated?
Abbott expects to complete the separation by the end of 2027 through a distribution of shares to its shareholders that is intended to be tax-free for U.S. federal income tax purposes. It is subject to conditions including regulatory approvals, an effective Form 10 registration statement and final approval by Abbott's board.
What is Libre Duo?
Libre Duo is Abbott's sensor that measures both glucose and ketones, approved by the FDA in August 2026. Abbott says it helps detect rising ketone levels earlier, and it plans to launch the sensor in the U.S. in December 2026.
What guidance did Abbott give in October 2026?
Abbott expects 2026 adjusted earnings per share of $5.50 to $5.55, keeping the midpoint of its earlier range, and comparable sales growth of about 6.0%. For the fourth quarter it forecasts adjusted earnings per share of $1.62 to $1.67. It plans to give 2027 guidance in January.
Who runs Abbott?
Robert Ford is chairman and chief executive of Abbott, and Philip Boudreau is chief financial officer. Daniel Salvadori is to become chief executive of the new Nutrition company.
Sources
- Abbott Laboratories, third-quarter 2026 results (Form 8-K, Exhibit 99.1, 21 Oct 2026; accession 0001628280-26-066601) www.sec.gov
- Abbott Laboratories, announcement of the intended separation of the Nutrition business (Form 8-K, Exhibit 99.1, 21 Oct 2026; accession 0001104659-26-117587) www.sec.gov
- Abbott Laboratories, Form 10-Q for the quarter ended 30 Jun 2026 (accession 0001628280-26-050134) www.sec.gov
- Abbott Laboratories, Form 10-K for 2025 (accession 0001628280-26-010185) www.sec.gov
- SEC XBRL company facts for Abbott Laboratories (CIK 1800): quarterly and annual sales, operating earnings and cash flow from Forms 10-Q and 10-K data.sec.gov
- Abbott Q3 2026 earnings call transcript, 21 Oct 2026 (The Motley Fool; accessed 2 Nov 2026) www.fool.com
- StockAnalysis: Abbott forecast and analyst ratings, S&P Global data (accessed 2 Nov 2026) stockanalysis.com
- StockAnalysis: Abbott statistics (accessed 2 Nov 2026) stockanalysis.com
- Frost & Sullivan, global medical device market 2020-2035, as published in the Industry Overview of a listing document on HKEXnews (May 2026) www1.hkexnews.hk
- Technavio, Medical Devices Market Analysis 2025-2030 (summary page, accessed 2 Nov 2026) www.technavio.com
- Yahoo Finance chart data: ABT closing prices and dividends (November 2025 to November 2026) query1.finance.yahoo.com
- Damodaran Online: global industry betas and regional cost of capital tables (US, Europe, China, India, Japan and global), January 2026 pages.stern.nyu.edu
- QSILabs Abbott discounted cash flow model (internal; price as of 2 Nov 2026)
Disclaimer
This article is for information only and is not investment advice, a recommendation or an offer to buy or sell any security. QSI Labs and its authors may hold positions in the securities discussed. Forecasts and valuations are estimates that depend on assumptions that may prove wrong. Figures are taken from company filings and third-party sources believed to be reliable, but we do not guarantee their accuracy. Do your own research or consult a licensed adviser before investing.
More from QSI Labs
Related analysis: Johnson & Johnson stock Q3 2026: talc and Tremfya, Thermo Fisher stock Q3 2026: organic growth, AbbVie stock Q3 2026: Skyrizi and Rinvoq and Eli Lilly stock Q3 2026: Mounjaro and Zepbound.
Read our white paper, QSI Labs: An AI-Native Trading Firm Built on a Training Loop (October 2026), available on request, or browse the research index.