Research / Earnings and valuation
Bank of America Stock Q3 2026:NII Up 8% as a $1.2bn Penalty Hits Profit
As of: Figures are as of Bank of America's third-quarter 2026 results (the quarter ended 30 September 2026, reported 14 October 2026 in a Form 8-K) and its Form 10-Q for the quarter, filed 30 October 2026. Bank of America's fiscal year is the calendar year, so Q3 2026 is the July-September 2026 quarter. The share price is the NYSE close of BAC on 30 October 2026, $50.01; on 2 November 2026 it closed at $49.57. Published 2 November 2026.
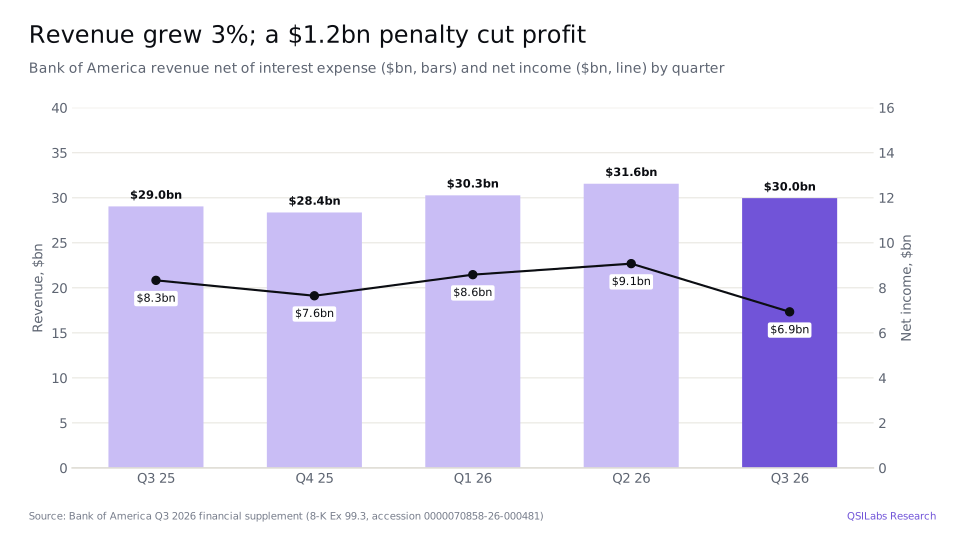
The short answer. Bank of America stock Q3 2026 comes down to a solid quarter hidden behind a one-off penalty. In the three months to 30 September 2026, Bank of America's revenue rose 3% to $30.0bn and net interest income rose 8% to $16.4bn, while net charge-offs fell to 0.44% of loans. Net income fell to $6.9bn, or $0.91 a share, from $8.3bn, because the bank booked a $1.2bn non-tax-deductible charge for civil money penalties tied to anti-money laundering and sanctions compliance. Excluding it, earnings per share were $1.08, up from $1.04. The bank returned $8.3bn to shareholders but its CET1 ratio slipped to 10.9%, 0.9 points above its regulatory minimum. Our excess-return model values Bank of America at $51.88 a share, against a $50.01 close on 30 October 2026, so we see the shares as about fairly priced.
Key takeaways
- Revenue up, profit down. Q3 2026 revenue net of interest expense was $29,958m, up 3.2% from $29,040m. Net income fell 17% to $6,933m and diluted EPS fell to $0.91 from $1.04 (8-K Ex 99.1).
- A $1.2bn penalty. The quarter includes a $1.2bn non-tax-deductible regulatory settlement charge, or $0.17 a share, after the OCC, FinCEN and OFAC announced resolutions on 13 October 2026. Adjusted EPS was $1.08 (8-K Ex 99.1; Form 10-Q).
- Net interest income up 8%. NII was $16,449m, up from $15,233m, and the net interest yield rose 15 basis points to 2.16%. Interest expense fell faster than interest income (8-K Ex 99.3).
- Clean credit. Net charge-offs were $1,349m, 0.44% of average loans, against $1,367m and 0.47% a year earlier. The provision for credit losses was $1,269m (8-K Ex 99.3).
- Capital is getting tighter. Bank of America bought back $6.0bn of stock in the quarter at an average of $62.15 a share. Its Standardized CET1 ratio fell to 10.9% from 11.6% a year earlier; the minimum is 10.0% (Form 10-Q).
- Our value: $51.88 a share, 3.7% above the $50.01 close on 30 October 2026. The average of 25 analyst targets is $62.61 (StockAnalysis, S&P Global data).
- What to watch. Q4 2026 results in January 2027, where consensus implies adjusted EPS of about $1.11, and whether buybacks slow as the CET1 ratio approaches its minimum.
Key numbers from Bank of America's Q3 2026 earnings
| Metric | Q3 2026 | Q3 2025 | Change |
|---|---|---|---|
| Revenue, net of interest expense | $29,958m | $29,040m | +3.2% |
| Net interest income | $16,449m | $15,233m | +8.0% |
| Noninterest income | $13,509m | $13,807m | -2.2% |
| Noninterest expense | $19,722m | $17,337m | +13.8% |
| Provision for credit losses | $1,269m | $1,295m | -2.0% |
| Net income | $6,933m | $8,332m | -16.8% |
| Diluted EPS | $0.91 | $1.04 | -12.5% |
| Adjusted EPS (excl. settlement charge) | $1.08 | $1.04 | +3.8% |
| Return on tangible common equity | 12.6% | 15.3% | -2.7 pts |
| Efficiency ratio | 65.8% | 59.7% | +6.1 pts |
| Net interest yield (FTE) | 2.16% | 2.01% | +0.15 pts |
| Net charge-off ratio | 0.44% | 0.47% | -0.03 pts |
| Standardized CET1 ratio | 10.9% | 11.6% | -0.7 pts |
| Tangible book value per share | $29.14 | $28.16 | +3.5% |
Bank of America Q3 2026 earnings: what happened
Bank of America reported its third-quarter 2026 results on 14 October 2026. Revenue net of interest expense was $29,958m, against $29,040m a year earlier and $31,558m in the second quarter. Net interest income, the difference between what the bank earns on loans and securities and what it pays on deposits and debt, was $16,449m, 8% higher. Noninterest income, mainly fees and trading, was $13,509m, 2% lower, because market making revenue fell to $2,360m from $3,203m and investment banking fees fell 11% to $1,799m. Asset management fees rose 17% to $4,630m on higher markets and inflows (8-K Ex 99.3).
Costs rose much faster. Noninterest expense was $19,722m, up $2.4bn, and the efficiency ratio, expenses as a share of revenue, rose to 66% from 60%. Half of the increase is the $1.2bn settlement charge. The rest came from revenue-related pay, technology and marketing. Excluding the charge, expense was $18.5bn, up 7%, and the efficiency ratio was 62% (8-K Ex 99.1; Form 10-Q).
Pre-tax income was $8,967m, down from $10,408m. Because the penalty is not tax-deductible, the effective tax rate rose to 22.7% from 19.9%, and net income fell 17% to $6,933m. After $392m of preferred dividends, net income to common shareholders was $6,541m. Diluted EPS of $0.91 fell less than profit because the average diluted share count was 7,222m, 5.3% lower than a year earlier. Excluding the charge, net income was $8.1bn and EPS was $1.08 (8-K Ex 99.1).
The first nine months look better than the quarter. Revenue was $91,788m, up 8.3%; net interest income was $48,191m, up 8.7%; and net income was $24,591m, up 7.6%. Diluted EPS was $3.23, against $2.84 in the first nine months of 2025, a rise of 14% (8-K Ex 99.3).
- 30 Jun 2026Q2 2026 ends: net income $9.1bn, diluted EPS $1.21, Standardized CET1 ratio 11.2%8-K Ex 99.3
- 12 Aug 2026BAC closes at $64.81, its highest close of the past yearYahoo Finance
- 30 Sep 2026Q3 2026 ends; BAC closes at $54.43. $11.0bn of the $40bn buyback authorization remainsYahoo Finance; Form 10-Q
- 13 Oct 2026The OCC, FinCEN and OFAC announce resolutions of Bank Secrecy Act, anti-money laundering and sanctions compliance matters. BAC closes at $53.96Form 10-Q; Yahoo Finance
- 14 Oct 2026Q3 results: EPS $0.91, or $1.08 before a $1.2bn settlement charge; NII up 8%. BAC closes at $51.39, down 4.8%8-K Ex 99.1; Yahoo Finance
- 21 Oct 2026Jim Fitterling and Bill Thomas join the board8-K, 21 Oct 2026
- 23 Oct 2026Sale of 2,000,000 depositary shares of 7.200% Series WW preferred stock, about $2bn8-K, 23 Oct 2026
- 30 Oct 2026Q3 2026 Form 10-Q filed; BAC closes at $50.01, the price used in our valuationSEC EDGAR; Yahoo Finance
- 2 Nov 2026BAC closes at $49.57Yahoo Finance
What was Bank of America's $1.2bn regulatory charge?
On 13 October 2026, the Office of the Comptroller of the Currency (OCC), the Financial Crimes Enforcement Network (FinCEN) and the Treasury's Office of Foreign Assets Control (OFAC) announced resolutions related to parts of Bank of America's Bank Secrecy Act, anti-money laundering and economic sanctions compliance programmes. They comprise consent orders with the OCC and FinCEN and a settlement agreement with OFAC. Bank of America accrued $1.2bn for the civil money penalties in the third quarter, and the charge is not deductible for tax (Form 10-Q).
The money is a one-off, but the work is not. FinCEN's order and an earlier OCC consent order from December 2024 require remedial actions, including independent consultants to review historical transactions, customer due diligence, foreign correspondent account due diligence and data governance. Bank of America says it has completed significant steps to meet the December 2024 order and has added staff and technology since late 2023 (Form 10-Q). That spending is already in the cost base, so we do not add a separate charge for it in our forecasts. The 10-Q also lists the October 2026 consent orders among its risk factors, which means further costs or restrictions cannot be ruled out.
The market took the news badly. BAC closed at $53.96 on 13 October and fell 4.8% to $51.39 on 14 October, the day of the results (Yahoo Finance). It had already fallen from $64.81 on 12 August, its highest close of the past year, to $54.43 at the end of September.
Why is Bank of America's net interest income rising?
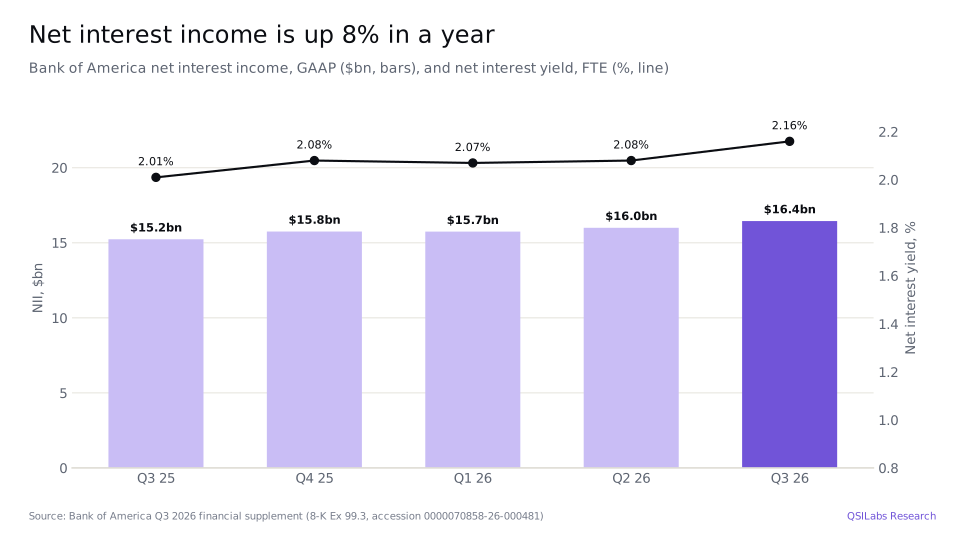
Net interest income has risen for most of the past year, to $16,449m in Q3 2026, or $16.6bn on a fully taxable-equivalent basis. Bank of America attributes the 8% increase to higher loan and deposit balances, more NII from Global Markets activity and the repricing of fixed-rate assets (8-K Ex 99.1). The last point matters most. Bank of America holds a large portfolio of fixed-rate bonds, including $496bn held to maturity at amortised cost, much of it bought when interest rates were low (8-K Ex 99.3). As those bonds mature, the cash is reinvested at higher yields or lent out.
The income statement shows how this works. Total interest income actually fell 3% from a year earlier, to $34,257m, but interest expense fell 12%, to $17,808m. The bank paid $7,605m of interest on deposits, against $8,932m a year earlier, and $6,331m on short-term borrowings, against $7,172m (8-K Ex 99.3). Debt securities on the balance sheet fell to $842bn from $936bn as bonds matured, while loans grew. That mix shift, from bonds to loans and from expensive to cheaper funding, raised the net interest yield to 2.16% from 2.01%.
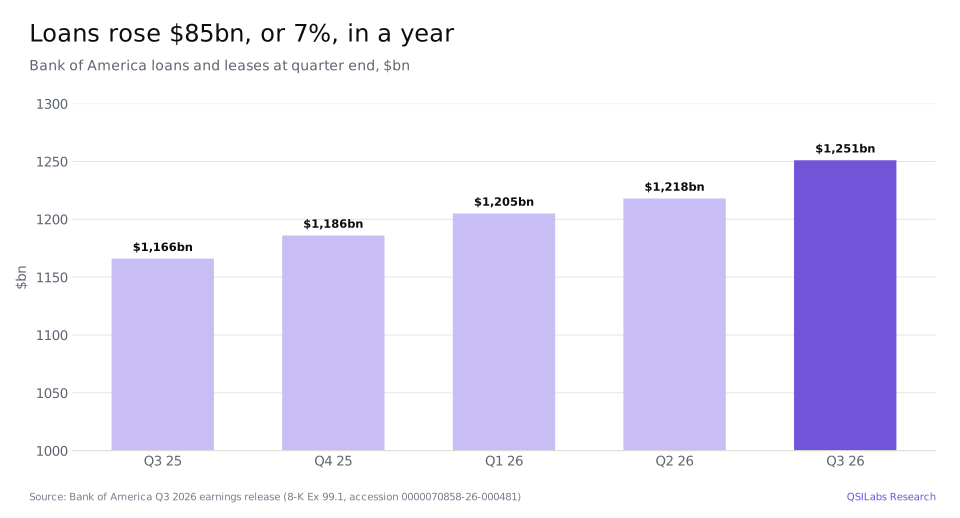
Loans are the other driver. Average loans and leases were $1.23 trillion in Q3, up 6%, the tenth consecutive quarter of sequential growth, with growth in every business segment. Period-end loans reached $1,251bn, up 7.3%. Average deposits were $2.02 trillion, up 2% (8-K Ex 99.1). Deposits grow more slowly than loans, which is why loans are a rising share of the balance sheet.
Net interest income is about 55% of Bank of America's revenue, so it drives the earnings forecasts we use. Consensus revenue for 2026 is $122.6bn, up 8.4%, and for 2027 $130.2bn, up 6.2% (StockAnalysis, S&P Global data). Those growth rates assume NII keeps rising as bonds reprice and loans grow.
How did Bank of America's business segments perform?
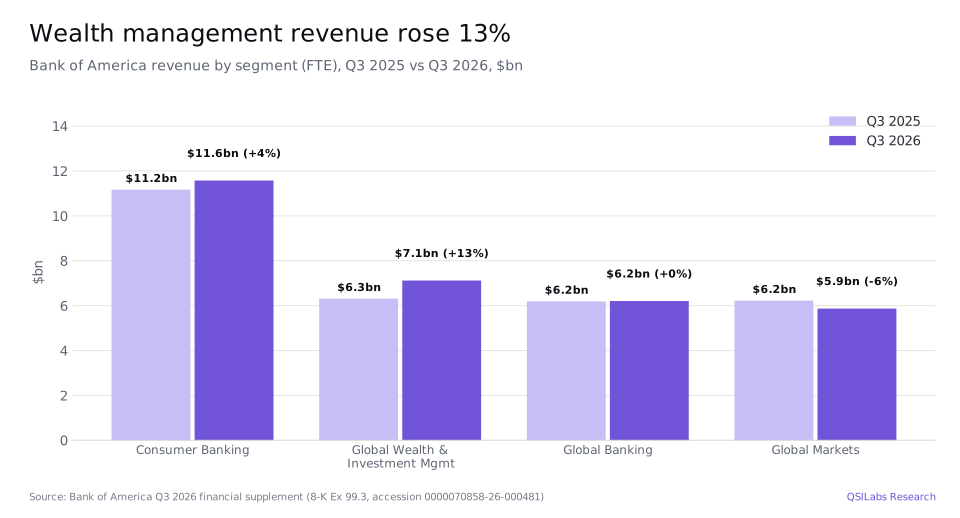
Consumer Banking. Revenue rose 4% to $11,572m and net income was $3,521m, against $3,437m. Average deposits were $949bn and average card loans $106bn, up 5%. Combined credit and debit card spending rose 8% to $266bn and the bank added more than 200,000 net new consumer checking accounts. The segment's return on allocated capital was 31% (8-K Ex 99.1 and 99.3).
Global Wealth & Investment Management (GWIM). Revenue rose 13% to $7,118m and net income rose to $1,540m from $1,265m. Asset management fees rose 16% to $4.5bn on higher market values and strong flows. Client balances reached $5.1 trillion, up 9%, and average loans rose 13% to $279bn (8-K Ex 99.1).
Global Banking. Revenue was flat at $6,205m and net income was $1,990m, against $2,085m. Investment banking fees across the company fell 11% to $1.8bn, but average loans rose 8% to $419bn and average deposits 6% to $669bn (8-K Ex 99.1).
Global Markets. Revenue fell 6% to $5,867m and net income fell to $1,235m from $1,648m. Sales and trading revenue was $5.1bn, down 5%: fixed income, currencies and commodities fell 17% to $2.6bn, while equities rose 11% to $2.5bn (8-K Ex 99.1).
All Other. The corporate segment lost $1,353m, against $103m a year earlier, because it carries the settlement charge (8-K Ex 99.3).
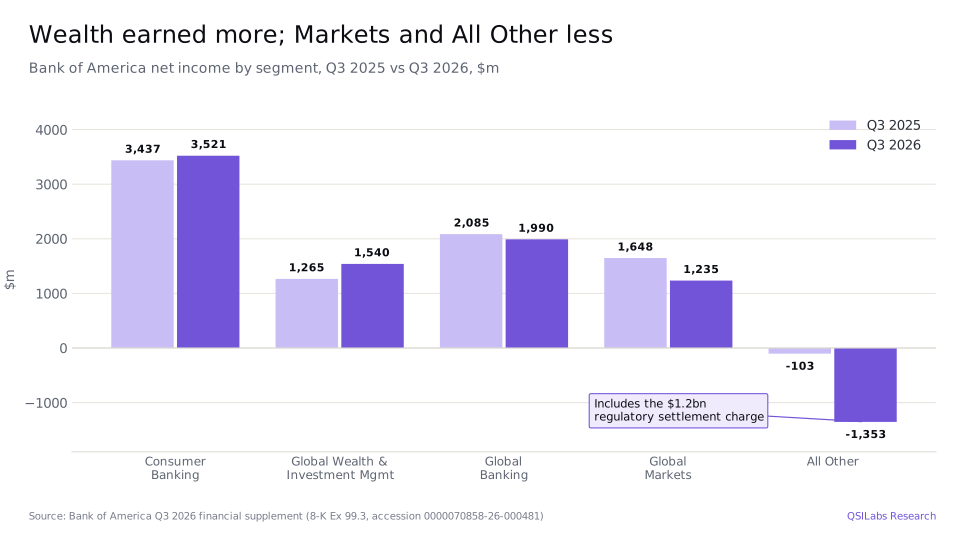
The pattern is clear. The steady businesses, consumer deposits and cards, wealth management and corporate lending, kept growing. The cyclical ones, trading and investment banking, had a weaker quarter than in 2025 and than in Q2 2026, when sales and trading revenue was $7.1bn. Sales and trading was 17% of Bank of America's revenue in the quarter, so a slow trading quarter dents profit without changing the picture. For comparison, see our JPMorgan stock Q3 2026 analysis, where markets revenue rose 15%.
Is Bank of America's credit quality getting worse?
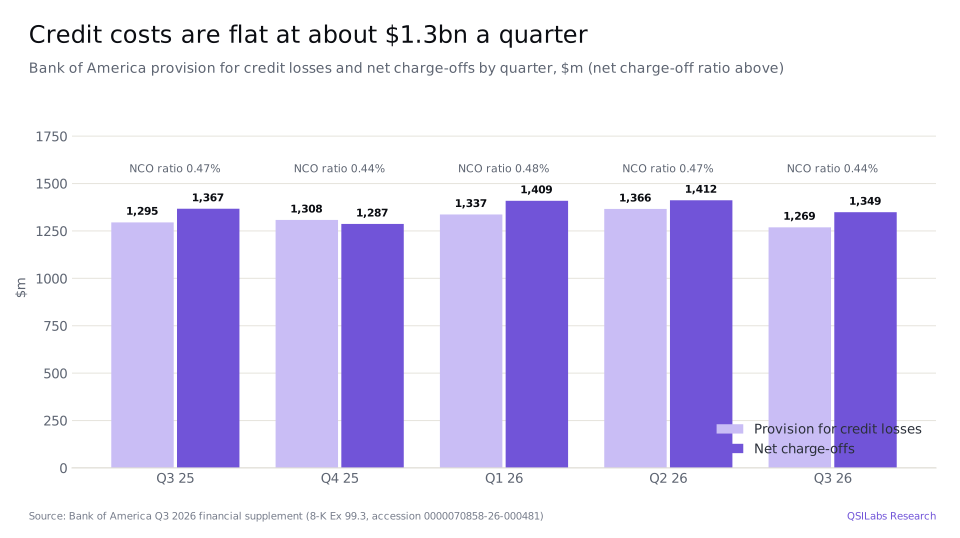
No. Net charge-offs, loans written off net of recoveries, were $1,349m in Q3 2026, down from $1,367m a year earlier and $1,412m in Q2. That is 0.44% of average loans, against 0.47%. The provision for credit losses was $1,269m, slightly below net charge-offs, so the bank released a small amount of reserves. The allowance for loan and lease losses was $13.0bn at 30 September, against $13.3bn a year earlier, while loans grew by $85bn (8-K Ex 99.3).
Credit card losses are the largest part of the total. Consumer Banking's provision was $1,045m, most of the company total. The card loss rate was 3.22% in the quarter (8-K Ex 99.3). That is normal for a large US card book, and well below the levels of a recession. A downturn would lift card and commercial losses, but at 0.44% Bank of America's loss rate gives it a lot of room before credit becomes a serious drag on profit.
Can Bank of America keep buying back $6bn of stock a quarter?
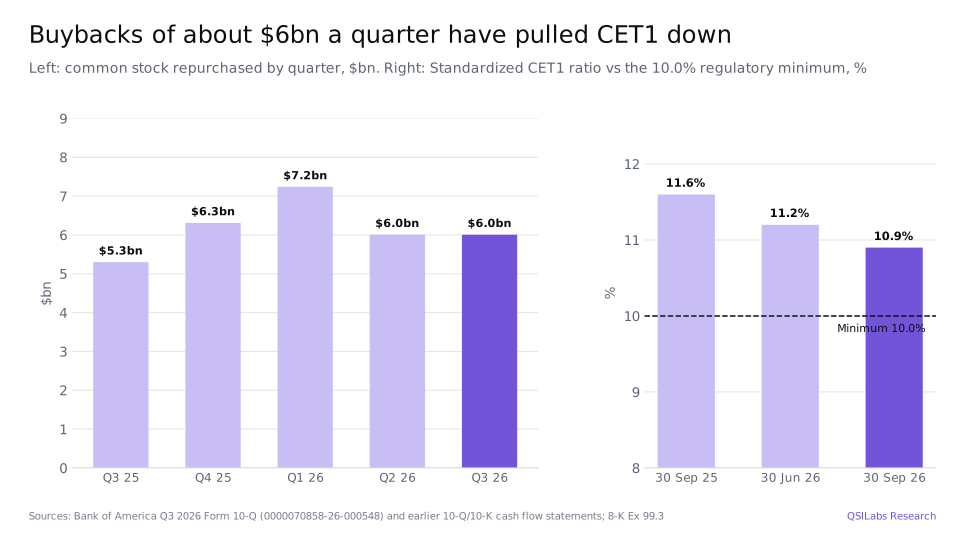
Bank of America returned $8.3bn to shareholders in Q3 2026: $2.2bn of common dividends and $6.0bn of buybacks. It repurchased about 97m shares at an average of $62.15, under a $40bn programme authorised in July 2025, with $11.0bn of the authorisation left at 30 September (Form 10-Q). The quarterly dividend was raised to $0.32 from $0.28 in the third quarter; the next payment is on 24 December 2026 to shareholders of record on 4 December.
The buybacks have been expensive for capital. Common equity tier 1 (CET1) capital fell to $198.4bn at 30 September from $202.9bn a year earlier, while risk-weighted assets rose 4% to $1,824bn as loans grew. The Standardized CET1 ratio fell to 10.9% from 11.6%, and from 11.2% at 30 June. Bank of America's regulatory minimum is 10.0%: a 4.5% base, a 3.0% surcharge for global systemically important banks and a 2.5% stress capital buffer (Form 10-Q). That leaves about $16bn of capital above the minimum, at 0.9 points of risk-weighted assets.
The buyback timing also cost money. The bank paid an average of $62.15 a share in Q3; at the 30 October close of $50.01, those shares are worth about 20% less. Buying back stock adds value only when the price is below what the shares are worth, and on our numbers $62 was above that.
On 23 October, Bank of America sold 2,000,000 depositary shares of 7.200% Series WW preferred stock, worth about $2bn (8-K). Preferred stock counts as tier 1 capital but not CET1, so it supports the tier 1 and leverage ratios rather than the CET1 ratio. We expect Bank of America to keep returning most of its earnings, but the pace of buybacks will probably follow earnings rather than exceed them until the CET1 ratio rebuilds.
Bank of America stock Q3 2026: is BAC undervalued?
Only slightly, on our numbers. Our excess-return model values Bank of America at $51.88 a share, 3.7% above the $50.01 close on 30 October 2026. At $50.01 the stock was down 9.1% from $55.00 at the end of 2025 and 6.6% from $53.56 a year earlier (3 November 2025). It had traded between $46.72 (13 March 2026) and $64.81 (12 August 2026) over the past year. At $50.01, Bank of America's market value is about $345bn, based on 6,900m common shares outstanding on 29 October (Form 10-Q).
We value Bank of America the way most analysts value banks. A bank's equity is worth its book value plus the present value of the profit it earns above its cost of equity, the "excess return". If a bank earns exactly its cost of equity, it is worth book value; if it earns more, it is worth more. Our value is $271.8bn of common book equity at 30 September, plus $64.1bn of present value of excess returns from Q4 2026 to 2033, plus $32.1bn of terminal value. That gives $368.0bn of equity, or $51.88 for each of 7,092m diluted shares, 1.32 times the $39.26 book value per share.
Method
The cost of equity is 8.35%. It combines a 5.12% 10-year US Treasury yield (20 October 2026), the 0.70 beta that Aswath Damodaran publishes for global money-center banks (January 2026) and an equity risk premium of 4.64%, a revenue-weighted mix of the US, global and emerging-market premiums. About 86% of Bank of America's revenue comes from the US (10-K 2025).
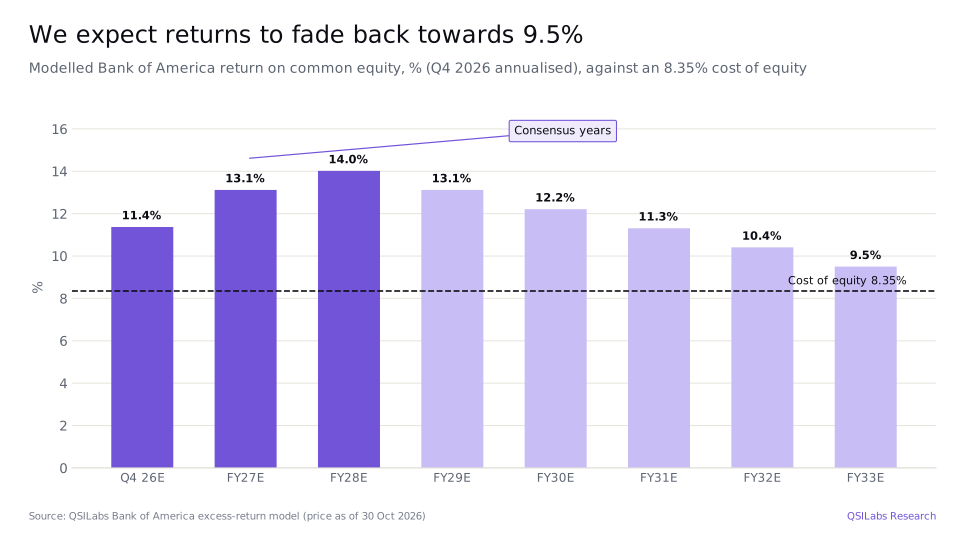
Net income to common shareholders for 2026 is $31.2bn: the $23.4bn earned in the first nine months plus $7.8bn in Q4, based on consensus 2026 adjusted EPS of $4.51 (StockAnalysis, S&P Global data). That consensus implies about $1.11 of adjusted EPS in Q4, after $3.40 in the first nine months excluding the charge. For 2027 we use consensus EPS of $5.19, or $35.8bn, and for 2028 $5.82, or $39.4bn. Those imply a return on equity of 13.1% in 2027 and 14.0% in 2028, well above the 8.35% cost of equity.
After 2028 we fade the return on equity over five years to 9.5% by 2033. That is Bank of America's own mid-cycle return, the total of its net income to common shareholders over 2016-2019 and 2022-2025 divided by its average common equity. We leave out 2020 and 2021 because pandemic reserve builds and releases distort them. Bank of America earned between 6.8% (2016) and 11.0% (2018) in those years, and 10.6% in 2025. We assume the bank pays out what it does not need to grow, at 2.5% a year in the long run. On those assumptions the terminal value is only 8.7% of the total, because the long-run return of 9.5% is close to the 8.35% cost of equity.
What would you have to believe to pay $50.01?
The share price and our value are close, so the debate is mostly about the long-run return on equity. At $50.01, the market is using a cost of equity of about 8.6% on our cash flows, close to our 8.35%. On consensus earnings, the shares trade at 11.1 times 2026 adjusted EPS of $4.51, 9.6 times 2027 EPS of $5.19, 1.27 times book value and 1.72 times tangible book value of $29.14.
The value is sensitive to the assumptions that matter:
| Change to our base case | Value per share |
|---|---|
| Base case: cost of equity 8.35%, long-run ROE 9.5% | $51.88 |
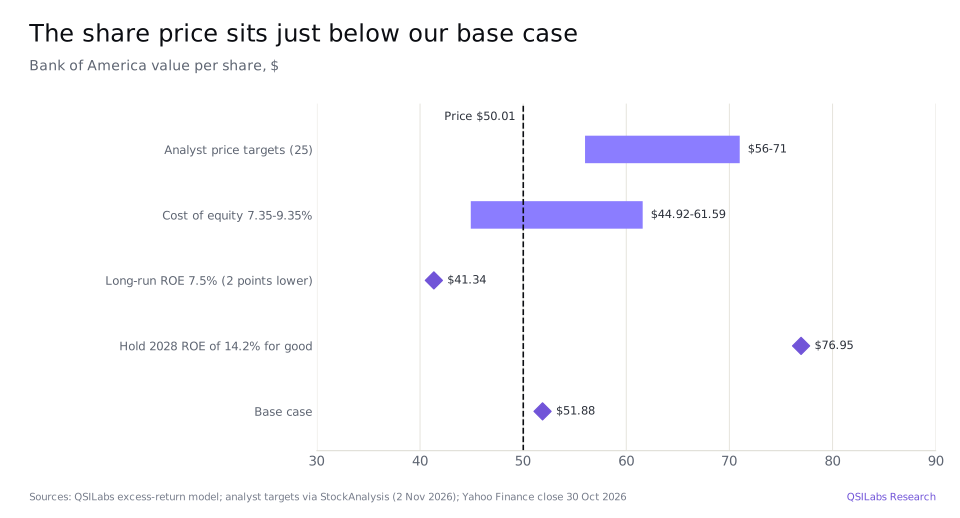
| Cost of equity 1 point lower (7.35%) | $61.59 |
| Cost of equity 1 point higher (9.35%) | $44.92 |
| Long-run ROE 2 points lower (7.5%) | $41.34 |
| Hold the 2028 consensus ROE of 14.2% for good | $76.95 |
| Simple average of yearly mid-cycle ROEs (9.47%) | $51.73 |
| Buybacks and dividends at the given payout ratios, then a glide to the sustainable level | $51.62 |
The bull case is that Bank of America's return on equity stays near the 13-14% consensus implies for 2027 and 2028 rather than falling back. If the 14.2% return in 2028 could be held for good, the value would be $76.95, well above the price. Higher rates on reinvested bonds, a larger wealth business and the scale benefits of a $3.4 trillion balance sheet argue for that. The bear case is that the bank's history is a better guide: across eight normal years it earned a 9.5% return, barely above its cost of equity, and a return 2 points lower would put the value at $41.34.
The analyst consensus is more bullish than we are. The 25 analysts tracked by S&P Global rate Bank of America a Strong Buy, with an average 12-month price target of $62.61, a low of $56 and a high of $71 (StockAnalysis, 2 November 2026). Every target is above the current share price. Our base case is lower because we do not assume returns stay at consensus levels after 2028.
Risks to the Bank of America investment case
- Regulatory remediation. The October 2026 consent orders require independent reviews and fixes to anti-money laundering programmes. Further penalties, restrictions on growth or higher compliance spending would reduce returns.
- Interest rates. Repricing fixed-rate bonds is the main source of NII growth. Lower long-term rates would slow it; rapid increases in deposit costs would offset it.
- Capital. With a CET1 ratio of 10.9% against a 10.0% minimum, there is little room for a higher stress capital buffer or tougher Basel III rules without cutting buybacks.
- Credit. A recession would raise card and commercial real estate losses from a low 0.44% loss rate.
- Markets revenue. Trading and investment banking fees are cyclical; Q3 2026 FICC revenue fell 17%.
- Expenses. Bank of America is investing in technology, branches and AI tools used by more than 200,000 employees. If revenue growth slows, costs could rise faster than income again.
- Upside risk. If the return on equity stays near consensus levels of 13-14% instead of fading to 9.5%, our value would be well above the share price.
FAQ
What is Bank of America stock worth after Q3 2026?
Our excess-return model values Bank of America (BAC) at $51.88 a share, 3.7% above the $50.01 close on 30 October 2026. It uses an 8.35% cost of equity and assumes the return on equity fades from consensus levels of 13-14% in 2027 and 2028 to the bank's 9.5% mid-cycle level by 2033. A one-point change in the cost of equity gives $44.92 to $61.59.
What were Bank of America's Q3 2026 earnings?
Bank of America reported Q3 2026 net income of $6.9bn, or $0.91 a diluted share, against $8.3bn and $1.04 a year earlier. Excluding a $1.2bn regulatory settlement charge, net income was $8.1bn and EPS $1.08. Revenue rose 3% to $30.0bn and net interest income 8% to $16.4bn. The results were released on 14 October 2026.
Why did Bank of America take a $1.2bn charge in Q3 2026?
The charge accrues civil money penalties after the OCC, FinCEN and OFAC announced resolutions on 13 October 2026 related to Bank of America's Bank Secrecy Act, anti-money laundering and sanctions compliance programmes. It is not tax-deductible and reduced EPS by $0.17. The consent orders also require remediation work, including independent reviews.
Why is Bank of America's net interest income going up?
Bank of America's NII rose 8% to $16.4bn in Q3 2026 because loans and deposits grew, Global Markets earned more interest, and low-yielding fixed-rate bonds bought when rates were low are maturing and being reinvested at higher rates. Interest expense fell 12% while interest income fell 3%, and the net interest yield rose to 2.16% from 2.01%.
What is Bank of America's CET1 ratio?
Bank of America's Standardized CET1 ratio was 10.9% at 30 September 2026, down from 11.2% at 30 June and 11.6% a year earlier, on $198.4bn of CET1 capital. Its regulatory minimum is 10.0%, including a 3.0% G-SIB surcharge and a 2.5% stress capital buffer. The Advanced approaches ratio was 12.0%.
Is Bank of America stock a buy at $50?
On our numbers the shares are about fairly priced: our value of $51.88 is 3.7% above the $50.01 close. Analysts are more positive, with an average target of $62.61 and a Strong Buy rating. At $50.01 the stock trades at 11.1 times 2026 consensus EPS and 1.72 times tangible book value. This is analysis, not investment advice.
What is Bank of America's dividend?
Bank of America pays $0.32 a share each quarter, raised from $0.28 in the third quarter of 2026, or $1.28 a year. That is a yield of about 2.6% at the 30 October 2026 price. The next dividend is payable on 24 December 2026 to shareholders of record on 4 December.
When does Bank of America report Q4 2026 earnings?
Bank of America normally reports fourth-quarter results in mid-January, so Q4 and full-year 2026 results are expected in mid-January 2027. Consensus 2026 adjusted EPS of $4.51 implies about $1.11 in the fourth quarter.
Sources
- Bank of America, third quarter 2026 earnings release (Form 8-K, Exhibit 99.1, 14 Oct 2026; accession 0000070858-26-000481) www.sec.gov
- Bank of America, third quarter 2026 financial supplement (Form 8-K, Exhibit 99.3, 14 Oct 2026; accession 0000070858-26-000481) www.sec.gov
- Bank of America, Form 10-Q for the quarter ended 30 Sep 2026 (filed 30 Oct 2026; accession 0000070858-26-000548) www.sec.gov
- Bank of America, Form 8-K dated 21 Oct 2026, Exhibit 99.1: board appointments (accession 0000070858-26-000494) www.sec.gov
- Bank of America, Form 8-K dated 23 Oct 2026: 7.200% Fixed-Rate Reset Non-Cumulative Preferred Stock, Series WW (accession 0001193125-26-430566) www.sec.gov
- SEC XBRL company facts for Bank of America (CIK 70858): annual net income to common shareholders and equity from Forms 10-K, quarterly buybacks from Forms 10-Q data.sec.gov
- StockAnalysis: Bank of America forecast and analyst ratings, S&P Global data (page updated and accessed 2 Nov 2026) stockanalysis.com
- StockAnalysis: Bank of America statistics (accessed 2 Nov 2026) stockanalysis.com
- Yahoo Finance chart data: BAC closing prices and dividends (November 2025 to November 2026) query1.finance.yahoo.com
- Damodaran Online: betas by industry, global (January 2026 update) pages.stern.nyu.edu
- US Treasury: daily par yield curve rates (10-year yield 5.12% on 20 Oct 2026) home.treasury.gov
- QSILabs Bank of America excess-return model (internal; price as of 30 Oct 2026)
Disclaimer
This article is for information only and is not investment advice, a recommendation or an offer to buy or sell any security. QSI Labs and its authors may hold positions in the securities discussed. Forecasts and valuations are estimates that depend on assumptions that may prove wrong. Figures are taken from company filings and third-party sources believed to be reliable, but we do not guarantee their accuracy. Do your own research or consult a licensed adviser before investing.
More from QSI Labs
Related analysis: JPMorgan stock Q3 2026: NII, buybacks and capital, Visa stock Q3 2026: cross-border growth, Mastercard stock Q3 2026: services and stablecoins and UnitedHealth stock Q3 2026.
Read our white paper, QSI Labs: An AI-Native Trading Firm Built on a Training Loop (October 2026), available on request, or browse the research index.