Research / Earnings and valuation
Amphenol Stock Q3 2026:Sales Up 65% on AI Datacom Demand
As of: Figures are as of Amphenol Corporation's results for the quarter ended 30 September 2026, reported 28 October 2026 in a Form 8-K, and its Form 10-Q for that quarter, filed 30 October 2026. Amphenol's fiscal year is the calendar year. The share price used in our valuation is the NYSE close of APH on 2 November 2026, $79.84; analyst data were accessed on 2 November 2026. Published 2 November 2026.
The short answer. Amphenol stock Q3 2026 comes down to a quarter in which demand for the connectors and cables inside AI data centres kept rising faster than the company expected. Sales for the three months to 30 September 2026 rose 65.1% to $10.23bn, 37% of it organic growth and the rest from acquisitions led by CommScope's connectivity business. Amphenol reported what it called "record third quarter 2026 results", with orders of $12.17bn, a book-to-bill ratio of 1.19, and GAAP operating margin of 29.5%. It guided fourth-quarter sales to $10.3bn to $10.5bn. Our discounted cash flow model values Amphenol at $44.58 a share, about 44% below the $79.84 close on 2 November 2026. The share price assumes faster growth for longer, or a lower cost of capital, than our model, which follows consensus to 2028 and then slows growth to 2.5% by 2035.
Key takeaways
- Sales up 65.1%. Third-quarter sales were $10,229.7m, against $6,194.4m a year earlier and $8,758.1m in the June quarter. Organic growth was 37% and acquisitions added 28 points.
- AI drives IT datacom. IT datacom was 48% of sales and grew 100% in US dollars and 77% organically. Chief executive Adam Norwitt said AI now represents about three-quarters of Amphenol's IT datacom sales.
- Orders ahead of sales. Orders were $12.17bn, up 99% on a year earlier and 13% on the June quarter, a book-to-bill ratio of 1.19. Amphenol said they were record orders.
- Margins rose. GAAP operating margin was 29.5%, against 27.5% a year earlier, and adjusted operating margin 29.7%. GAAP diluted EPS rose 61% to $0.79 and adjusted EPS 74% to $0.80.
- Guidance. Amphenol expects fourth-quarter sales of $10.3bn to $10.5bn, 60% to 63% above a year earlier, and full-year 2026 sales of $36.9bn to $37.1bn, with adjusted EPS of $2.82 to $2.84.
- More cash for shareholders. Free cash flow was $1.62bn. The board raised the quarterly dividend 20% to $0.15 and approved a new three-year, $4bn share repurchase programme from 1 January 2027.
- Our value: $44.58 a share, against a $79.84 close on 2 November 2026. A two-stage cross-check gives $46.15, and the highest value in our sensitivity grid is $51.43. Analysts' average target is $106.97.
- What to watch. Whether AI orders keep running ahead of sales, the decline in communications networks sales, the integration of CommScope and four smaller deals, and a 27.0% adjusted tax rate that Amphenol raised after tax rulings in China.
Key numbers from Amphenol's Q3 2026 earnings
| Metric | Q3 2026 | Q3 2025 | Change |
|---|---|---|---|
| Net sales | $10,229.7m | $6,194.4m | +65.1% |
| Gross profit | $4,016.2m | $2,359.3m | +70.2% |
| Gross margin | 39.3% | 38.1% | +1.2pt |
| GAAP operating income | $3,020.8m | $1,702.3m | +77.5% |
| GAAP operating margin | 29.5% | 27.5% | +2.0pt |
| Adjusted operating margin | 29.7% | 27.5% | +0.2pt |
| Net income attributable to Amphenol | $2,034.3m | $1,245.7m | +63.3% |
| GAAP diluted EPS | $0.79 | $0.49 | +61% |
| Adjusted diluted EPS | $0.80 | $0.46 | +74% |
| Operating cash flow | $2,078.5m | $1,470.8m | +41.3% |
| Free cash flow | $1,622.7m | $1,215.5m | +33.5% |
| Share repurchases | $244.7m | $152.9m | +60.0% |
Free cash flow is operating cash flow less capital spending plus proceeds from asset disposals, Amphenol's definition. Per-share figures reflect the two-for-one stock split that took effect on 3 September 2026. The prior-year buyback figure is from SEC XBRL data.
Amphenol Q3 2026 earnings: what happened
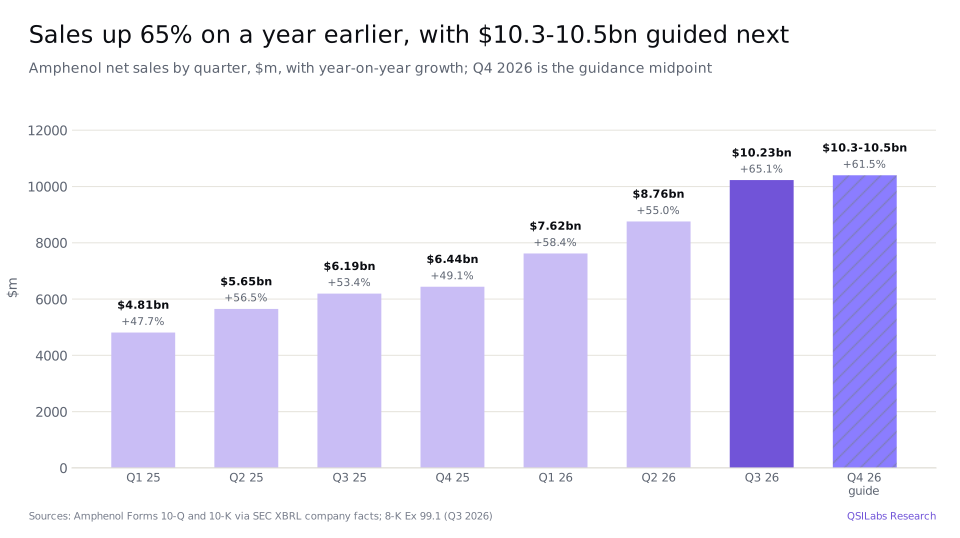
Amphenol reported net sales of $10,229.7m for the quarter to 30 September 2026, 65.1% more than the $6,194.4m of a year earlier and 16.8% more than the $8,758.1m of the June quarter. Norwitt said sales and adjusted EPS were both records and exceeded "the high end of our guidance". Of the 65% growth, 37 points were organic, from higher volumes and prices, and 28 points came from acquisitions; currency had no net effect.
The largest acquisition is the Connectivity and Cable Solutions business of Vistance Networks, formerly CommScope Holding Company, which Amphenol calls CommScope. It contributed sales of $3,683.3m in 2026 up to 30 September, according to the 10-Q, and Amphenol now expects full-year CommScope sales of $5.1bn, above its earlier $4.6bn, and $0.18 of adjusted EPS accretion. In the first nine months of 2026 Amphenol spent $11,055.8m, net of cash acquired, on four acquisitions, and in the third quarter it closed Empire Electronics, an automotive interconnect maker with expected 2026 sales of about $320m.
Gross profit rose 70.2% to $4,016.2m, a gross margin of 39.3% against 38.1% a year earlier. Selling, general and administrative expenses rose 49.1% to $979.9m, and GAAP operating income rose 77.5% to $3,020.8m. Interest expense rose to $212.3m from $80.7m because of the debt raised for the acquisitions. Tax was $774.5m on pre-tax income of $2,829.2m, a GAAP rate of 27.4%, and net income attributable to Amphenol rose 63.3% to $2,034.3m. GAAP diluted EPS was $0.79, and adjusted EPS, which excludes acquisition costs, excess stock-compensation tax benefits and discrete tax items, was $0.80.
- 31 Dec 20252025 ends with sales of $23.09bn, up 51.7%, and a GAAP operating margin of 25.4%; APH closes at $67.57 (split-adjusted)SEC XBRL; Yahoo Finance
- 11 Feb 2026Dell'Oro says data centre capital spending is expected to approach $1 trillion in 2026Dell'Oro Group
- 30 Mar 2026APH closes at $59.58, its 52-week closing lowYahoo Finance
- 6 Aug 2026Board approves a two-for-one stock split8-K
- 18 Aug 2026Dell'Oro forecasts data centre capital spending above $3 trillion by 2030Dell'Oro Group
- 3 Sep 2026Shares begin trading on a split-adjusted basis; Empire Electronics acquisition closed at the start of September8-K Ex 99.1
- 30 Sep 2026Q3 2026 ends: sales $10,229.7m, up 65.1%; orders $12.17bn8-K Ex 99.1; call
- 6 Oct 2026APH closes at $88.62, its 52-week closing highYahoo Finance
- 13 Oct 2026Bishop & Associates says the connector industry is entering one of its strongest growth cycles in decadesBishop & Associates
- 28 Oct 2026Results and call: 20% dividend increase, new $4bn buyback, Q4 sales guidance of $10.3bn to $10.5bn; APH closes at $80.968-K; call; Yahoo
- 30 Oct 2026Form 10-Q filed; APH closes at $79.30Form 10-Q; Yahoo Finance
- 2 Nov 2026APH closes at $79.84, the price used in our valuationYahoo Finance
- Q4 2026AdvancedPCB and Humanetics Sensors acquisitions expected to close8-K Ex 99.1
- Jan 2027New $4bn buyback starts on 1 January; first $0.15 dividend paid on 13 January; Dexgreen expected to close in Q1 20278-K Ex 99.1
Which Amphenol segments grew fastest?
Communications Solutions, which makes the high-speed, power and fibre optic interconnect products used in data centres and networks and which now includes CommScope, almost doubled its sales: they rose 98.9% to $6,583.0m, 64% of the total, with organic growth of 51%. Its segment operating income rose 101.6% to $2,180.4m, a margin of 33.1% against 32.7% a year earlier.
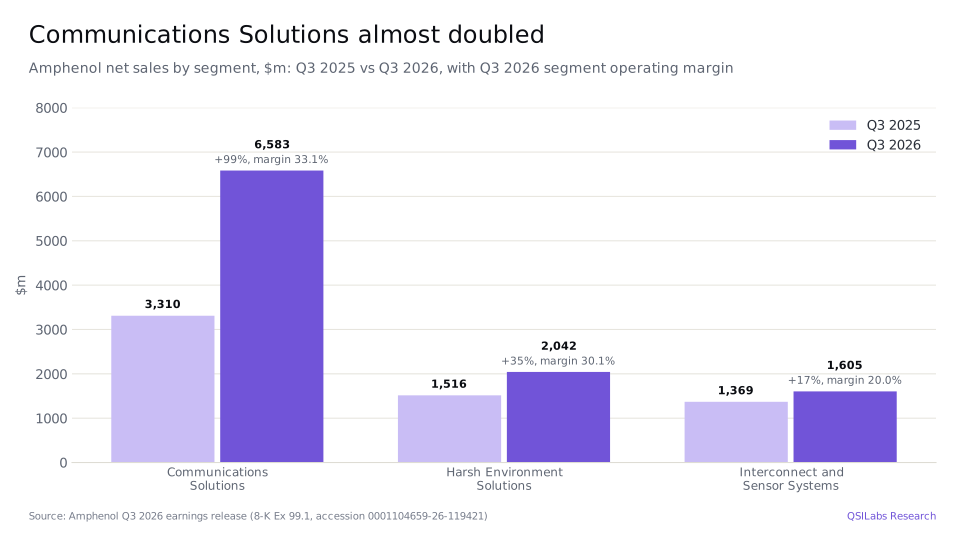
Harsh Environment Solutions, which sells ruggedised connectors and cables for defence, commercial aircraft and industrial equipment, grew 34.7% to $2,042.1m, 29% organically, and its margin rose to 30.1% from 27.1%. Interconnect and Sensor Systems, which serves mainly the automotive and industrial markets, grew 17.2% to $1,604.6m, 11% organically, with an unchanged margin of 20.0%. Over the first nine months, sales were $26,607.9m, up 59.8%, and GAAP operating income was $7,437.2m, up 79.4%.
Which end markets drive Amphenol's sales?
Amphenol also reports sales by end market on its earnings call. IT datacom, the servers, switches and storage systems in data centres, was 48% of third-quarter sales and grew 100% in US dollars and 77% organically. Norwitt said "the vast majority of our sequential growth was related to AI", that AI now represents about three-quarters of IT datacom sales, roughly 36% of the company's total, and that sales in the market rose 30% from the June quarter, against Amphenol's expectation of a mid-teens increase.
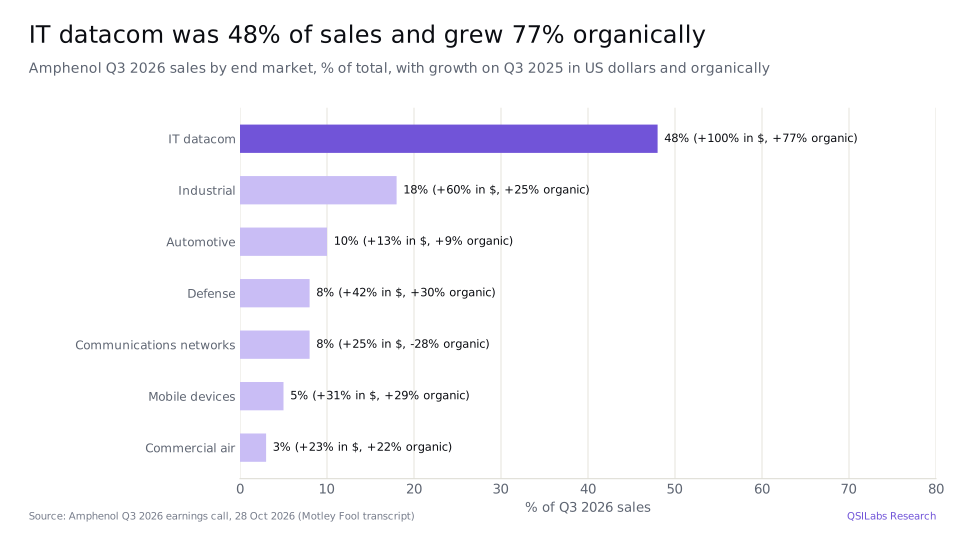
The other markets were smaller but mostly grew. Industrial was 18% of sales, up 60% in dollars and 25% organically, helped by CommScope's building connectivity products. Automotive was 10%, up 13% and 9% organically, with Norwitt citing electric vehicles. Defence was 8%, up 42% and 30% organically, mobile devices 5%, up 31%, and commercial air 3%, up 23%. The one weak market was communications networks, 8% of sales: dollar sales rose 25% because of CommScope, but organic sales fell 28%, which Norwitt attributed in particular to lower broadband spending, and Amphenol expects a further decline in the fourth quarter.
The industry backdrop supports growth in IT datacom. Dell'Oro Group said in August 2026 that worldwide data centre capital spending will "surpass $3 trillion by 2030" and that its 2030 outlook had "nearly doubled since the January 2026 forecast"; in February it had said spending was "expected to approach $1 Trillion in 2026". For connectors overall, the research firm Bishop & Associates said on 13 October 2026 that the industry is entering "one of its strongest growth cycles in decades", after growth of 14.6% in 2025.
How profitable is Amphenol?
Amphenol's GAAP operating margin was 29.5% in the third quarter, the same as in the June quarter and up from 27.5% a year earlier. Gross margin was 39.3%, against 40.5% in the June quarter and 38.1% a year earlier. On Amphenol's adjusted measure, operating margin was 29.7%, 22 basis points higher than a year earlier, which Norwitt called "a direct result of the outstanding execution" of the team.
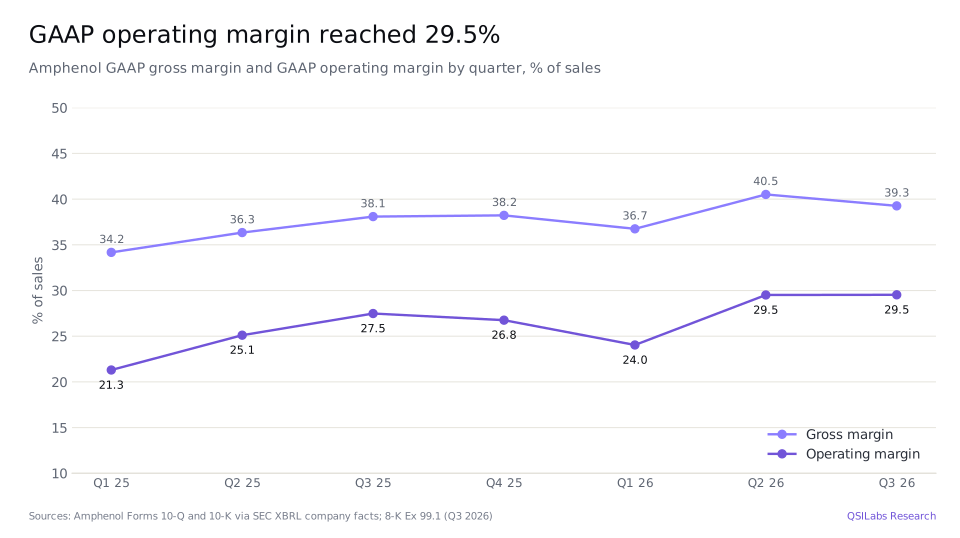
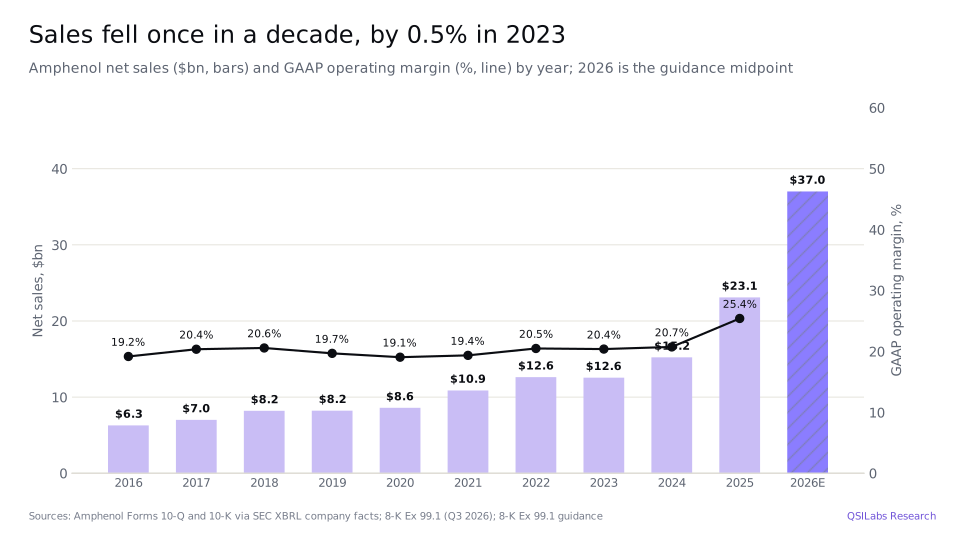
Margins in the first half of 2026 were held back by acquisition costs: over the first nine months Amphenol booked $132.0m of non-cash inventory step-up amortisation for CommScope and $155.9m of other acquisition-related expenses, of which only $15.5m fell in the third quarter. Over the longer term Amphenol has been consistently profitable. Its GAAP operating margin was between 19.1% and 20.7% in every year from 2016 to 2024 and rose to 25.4% in 2025, when sales grew 51.7% to $23.09bn. Sales fell only once in that decade, by 0.5% in 2023.
Tax is rising. Amphenol recorded $389.0m of discrete tax charges in the first nine months of 2026, including $130.0m after unfavourable determinations from tax authorities in China and $160.0m from reassessing tax rates on prior years there, and said that as a result, together with a shift of income to higher-tax countries, it raised its adjusted effective tax rate to 27.0%. The adjusted rate was 25.5% in the first nine months of 2025.
What is Amphenol guiding for the fourth quarter?
Amphenol expects fourth-quarter sales of $10.3bn to $10.5bn, 60% to 63% more than the $6,439.0m of a year earlier and up to 3% more than the third quarter, and adjusted diluted EPS of $0.81 to $0.83, up 65% to 69%. For the full year it expects sales of $36.9bn to $37.1bn, about 60% above 2025, and adjusted EPS of $2.82 to $2.84, with GAAP EPS of $2.64 to $2.66. The guidance assumes current market conditions and constant exchange rates and excludes the three acquisitions that have not yet closed.
By market, Norwitt expects IT datacom sales to rise again by a mid-single-digit percentage in the fourth quarter and to more than double in 2026. He expects defence to grow by a mid-single-digit percentage from the third quarter, commercial air to hold at third-quarter levels, mobile devices to rise about 35%, industrial and automotive sales to ease slightly and communications networks to decline further. Chief financial officer Craig Lampo said capital spending should stay within Amphenol's historical range of 3% to 4% of sales over the long term, perhaps "slightly higher than 4" in periods of fast growth.
Three more acquisitions are pending: AdvancedPCB, a US maker of printed circuit boards with expected 2026 sales of about $270m, and Humanetics Sensors, about $70m, are due to close in the fourth quarter, and Dexgreen, an Irish maker of fibre optic products with about $90m of sales, in the first quarter of 2027. With Empire Electronics, the four deals cost about $1.6bn, to be paid from cash and debt.
How much cash does Amphenol return to shareholders?
Amphenol generated $2,078.5m of cash from operations in the third quarter, up 41.3%, spent $457.2m on capital projects, 4.5% of sales, and had free cash flow of $1,622.7m, up 33.5%, or 80% of net income. In the first nine months free cash flow was $3,659.4m, against $2,917.2m a year earlier.
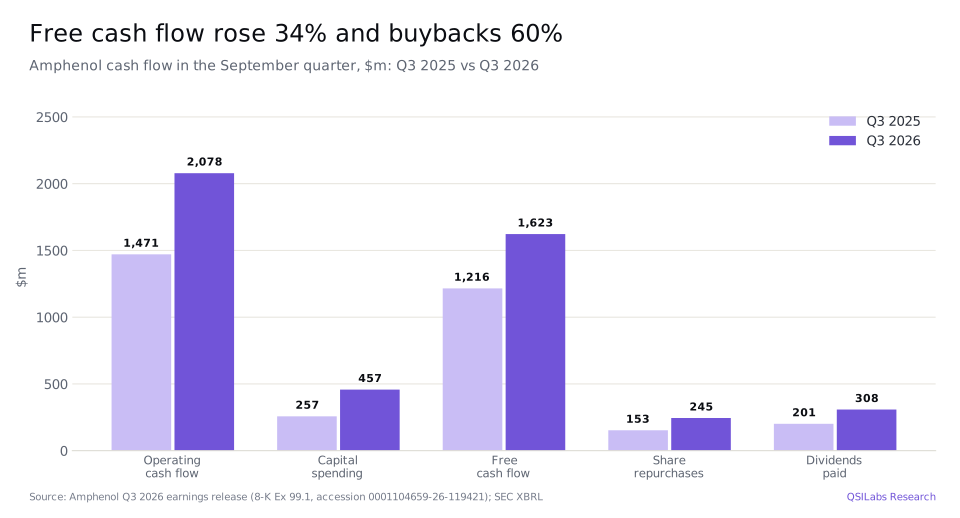
It returned $553m to shareholders in the quarter: $245m for 3.0m shares, at an average of about $81 according to Lampo, and $308m of dividends. The board raised the quarterly dividend by 20% to $0.15 a share, or $0.60 a year, a yield of 0.75% at $79.84, payable on 13 January 2027 to shareholders of record on 22 December. Amphenol expects to finish its existing $2bn buyback by the end of 2026, and a new three-year $4bn programme starts on 1 January 2027.
At 30 September Amphenol had cash and short-term investments of $5,301.4m and total debt of $17,870.8m, net of $109.9m of unamortised issuance costs, mostly US and euro senior notes plus a $1,534.1m term loan; $700.7m is due within a year. Its $3bn revolving credit facility was undrawn. Lampo put net leverage at 1.1 times adjusted EBITDA, which was $3.4bn in the quarter.
How has APH stock performed in 2026?
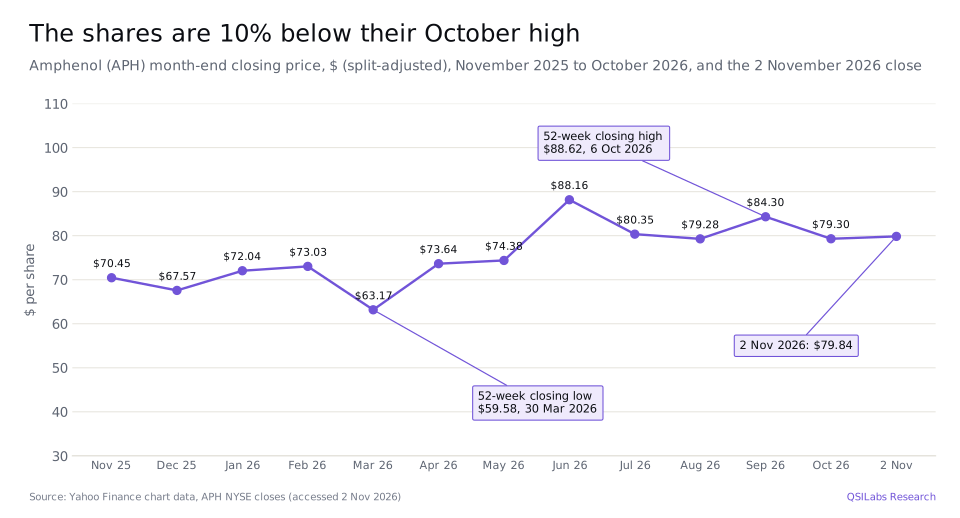
APH closed at $79.84 on 2 November 2026, up 18.2% from $67.57 at the end of 2025 and 9.9% below its 52-week closing high of $88.62 on 6 October 2026. Its 52-week closing low was $59.58 on 30 March 2026. On the day of the results, 28 October, the shares closed at $80.96, up 3.5%; they reached $82.08 the next day and closed at $79.30 on 30 October. All prices are adjusted for the two-for-one split.
At $79.84, Amphenol's equity was worth about $197.1bn on the 2,469.3m shares outstanding on 27 October, and its enterprise value, adding debt and deducting cash, about $210bn. That is 22.1 times the consensus 2027 EPS of $3.62 and 15.7 times the 2027 operating income of $13.4bn implied by consensus. StockAnalysis puts the trailing price-earnings ratio at 34.7 and the forward ratio at 22.9.
Amphenol stock Q3 2026: is APH overvalued?
On our numbers, yes. Our discounted cash flow model values Amphenol at $44.58 a share, about 44% below the $79.84 close on 2 November 2026; put another way, the price is 1.79 times our value. Our enterprise value of $127.6bn is 9.5 times the 2027 operating income implied by consensus, against 15.7 times for the market's enterprise value.
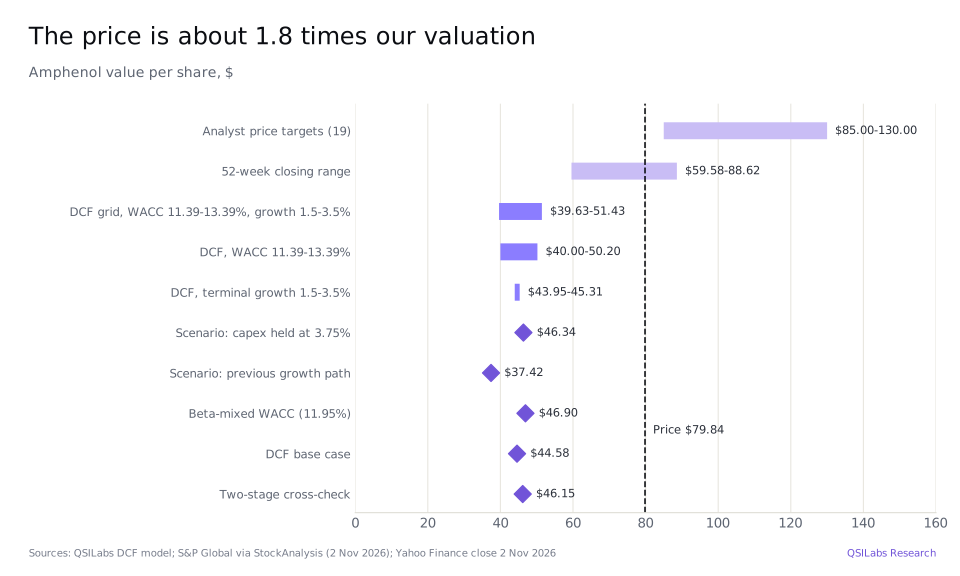
Analysts are much more positive than our model. The 19 analysts tracked by S&P Global rate Amphenol a Strong Buy on average, with an average price target of $106.97, a median of $107 and a range from $85 to $130. In November 13 rated it a Strong Buy, 4 a Buy and 2 a Hold, and none rated it a Sell.
The gap comes mainly from the cost of capital and what happens after 2028. Our model grows revenue in line with consensus to 2028, then slows growth from 13% in 2029 to 2.5% in 2035, and discounts at 12.39%. The share price implies that Amphenol keeps growing quickly for longer, or that investors require a lower return; at 11.39% and 3.5% terminal growth, the most favourable corner of our grid, the value is still $51.43.
Method
We forecast revenue and GAAP operating margin year by year to 2035, apply a 27.0% tax rate, Amphenol's adjusted effective rate, and deduct capital spending and working capital to reach unlevered free cash flow. We discount those cash flows at a 12.39% weighted average cost of capital. The cost of equity is 13.05%: a 5.12% risk-free rate plus a beta of 1.54 times an equity risk premium of 5.15%. The beta is Damodaran's global unlevered beta of 1.445 for electronics (general) companies, relevered at Amphenol's debt-to-equity ratio of 8.7%; the equity risk premium is weighted by where Amphenol made its 2025 sales, 34.6% in the United States, 15.9% in China and 49.5% elsewhere. Debt is 8.0% of capital at an after-tax cost of 4.85%. After 2035 we assume growth of 2.5% a year; that terminal value is 44.3% of our enterprise value of $127.6bn. Adding cash and short-term investments of $5.30bn and about $0.49bn of cash generated between 30 September and 2 November, and deducting debt of $17.98bn before issuance costs and $0.15bn of non-controlling interests, gives equity value of $115.2bn, or $44.58 a share on 2,585.0m diluted shares.
For 2026 we use revenue of $37.0bn, the midpoint of Amphenol's guidance, and a GAAP operating margin of 28.3%. For 2027 we use the S&P Global consensus revenue of $45.86bn, up 23.9%, with an operating margin of 29.2%, the level consistent with consensus adjusted EPS of $3.62 at a 27.0% tax rate. For 2028 we apply S&P Global's three-year growth forecasts to 2025: revenue growth of 31.7% a year gives $52.8bn, up 15.1%, and EPS growth of 36.9% a year implies an operating margin of 30.1%, which we hold to 2035. Growth then slows to 13% in 2029, 11% in 2030 and 9% in 2031, and reaches 2.5% in 2035, when revenue is $86.8bn. That is slower than Dell'Oro's forecast of roughly 32% a year for data centre spending to 2030, because about half of Amphenol's sales come from other markets and its revenue more than doubled from 2024 to 2026.
Capital spending is 4.2% of revenue in 2026, 4.0% in 2027 and 3.75% in 2028, inside the 3% to 4% range Lampo described, and then rises to 6.84% by 2035, the reinvestment our method requires for 2.5% growth after 2035 at a 15% return on new capital. That is well above Amphenol's range and is one reason our value is conservative. Depreciation and amortisation fall from 4.4% of revenue to 3.5%, and working capital rises by 13.1% of each year's increase in revenue, which takes $1.16bn of cash in 2027.
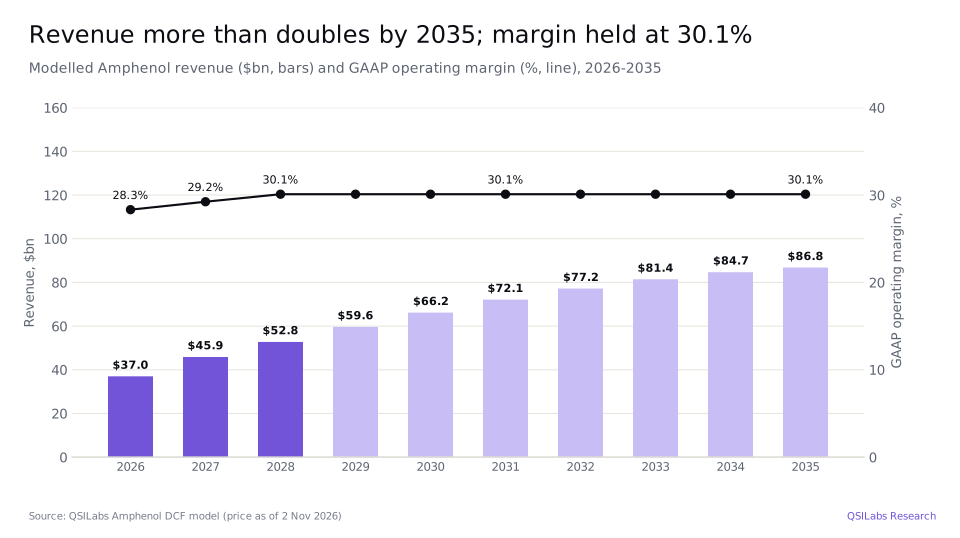
We forecast unlevered free cash flow of $8.82bn in 2027 and $10.98bn in 2028, rising to $13.27bn in 2030 and $15.90bn in 2035. Our previous model, priced at the $80.96 close on 28 October and built on forecasts made before the results, gave $35.58. It assumed growth of 15.3% in 2027, slowing from 10% in 2028 to 3% in 2035, a flat operating margin of 28.9% and a tax rate of 23.1%, Amphenol's 2025 rate. We have replaced those assumptions with consensus to 2028 and the fade described above, and raised the tax rate to 27.0%.
How the number moves if you argue with us
The table shows our value per share at different costs of capital and terminal growth rates. Even at an 11.39% cost of capital and 3.5% terminal growth, the model gives $51.43, about 36% below the share price.
| Cost of capital | Growth 1.5% | Growth 2.0% | Growth 2.5% | Growth 3.0% | Growth 3.5% |
|---|---|---|---|---|---|
| 11.39% | $49.18 | $49.66 | $50.20 | $50.78 | $51.43 |
| 11.89% | $46.43 | $46.82 | $47.24 | $47.69 | $48.19 |
| 12.39% | $43.95 | $44.25 | $44.58 | $44.93 | $45.31 |
| 12.89% | $41.69 | $41.93 | $42.18 | $42.45 | $42.74 |
| 13.39% | $39.63 | $39.81 | $40.00 | $40.21 | $40.42 |
We also ran two scenarios through the model. If capital spending stays at 3.75% of revenue every year to 2035, in Amphenol's range, rather than rising to 6.84%, the value is $46.34. If revenue growth instead slows from 10% in 2028 to 3% in 2035, the path in our previous model, with the new 2027 forecast and margins, the value is about $37.4. A cost of capital built from separate betas for each region gives 11.95% and a value of $46.90, and a two-stage version of the terminal value gives $46.15.
Risks to the Amphenol investment case
- AI spending. IT datacom was 48% of sales, and about three-quarters of it is AI. A pause in data centre construction, or a change in server designs that uses fewer connectors, would hit Amphenol quickly; on the call an analyst asked whether funding concerns could slow neocloud build-outs.
- Acquisitions. Amphenol spent $11.06bn on acquisitions in the first nine months of 2026 and has $1.6bn more agreed. CommScope's communications networks sales fell 28% organically in the quarter, and goodwill is $17.70bn.
- Tax. Discrete tax charges of $389.0m in 2026, mostly in China, pushed the adjusted tax rate to 27.0%. Further rulings could raise it again.
- Debt. Total debt was $17.87bn at 30 September, with interest expense of $212.3m in the quarter, against $80.7m a year earlier.
- Valuation. At 22.1 times consensus 2027 EPS, the shares already assume strong growth; the shares have closed between $59.58 and $88.62 in the past year, so expectations can change quickly.
- Upside risks. Orders of $12.17bn ran 19% ahead of sales. If AI spending follows Dell'Oro's forecast and Amphenol's margins keep rising, our model would understate the value.
FAQ
What value does QSILabs put on Amphenol stock?
$44.58 a share in our base case, from a discounted cash flow model priced on 2 November 2026, when the shares closed at $79.84. Our sensitivity grid ranges from $39.63 to $51.43, and a two-stage cross-check gives $46.15. Our previous model, priced on 28 October, gave $35.58.
Is Amphenol stock a buy after its Q3 2026 results?
The results were strong: sales up 65.1%, adjusted EPS up 74% and orders 19% ahead of sales. But on our model the shares trade well above the value of the cash flows we forecast, so they price in growth beyond consensus or a lower cost of capital. Analysts disagree: 17 of 19 rate it a Buy or Strong Buy. This is not investment advice.
How much revenue did Amphenol make in Q3 2026?
$10,229.7m in the quarter to 30 September 2026, up 65.1% from $6,194.4m a year earlier and 37% organically. Communications Solutions provided $6,583.0m. Amphenol guided $10.3bn to $10.5bn for the fourth quarter and $36.9bn to $37.1bn for 2026.
What does Amphenol Corporation do?
Amphenol designs and makes electrical, electronic and fibre optic connectors, interconnect systems, cables, antennas and sensors. It sells them to makers of data centre equipment, cars, aircraft, defence systems, industrial machinery, phones and communications networks.
Does Amphenol pay a dividend?
Yes. The board raised the quarterly dividend by 20% to $0.15 a share, or $0.60 a year, a yield of about 0.75% at $79.84, from the payment on 13 January 2027. Amphenol paid $308.0m of dividends and bought back $244.7m of shares in the September 2026 quarter.
What price target do analysts have for APH?
The 19 analysts tracked by S&P Global have an average price target of $106.97, a median of $107, a low of $85 and a high of $130, according to StockAnalysis on 2 November 2026. Their consensus rating is Strong Buy.
How much of Amphenol's business comes from AI?
Norwitt said AI represents about three-quarters of IT datacom sales, and IT datacom was 48% of total sales in the third quarter, so AI-related sales were roughly 36% of the total. IT datacom sales grew 77% organically and are expected to more than double in 2026.
How much debt does Amphenol have?
Total debt was $17,870.8m at 30 September 2026, net of issuance costs, against cash and short-term investments of $5,301.4m, so net debt was about $12.6bn. Lampo put net leverage at 1.1 times adjusted EBITDA. The $3bn revolving credit facility was undrawn.
When did Amphenol split its stock?
Amphenol's two-for-one stock split was distributed on 2 September 2026, and the shares began trading on a split-adjusted basis on 3 September 2026. Per-share figures and prices in this article are on the post-split basis.
Sources
- Amphenol Corporation, third quarter 2026 results (Form 8-K, Exhibit 99.1, 28 Oct 2026; accession 0001104659-26-119421) www.sec.gov
- Amphenol Corporation, Form 10-Q for the quarter ended 30 Sep 2026 (filed 30 Oct 2026; accession 0001104659-26-120646) www.sec.gov
- Amphenol Corporation, Form 10-K for 2025 (filed 11 Feb 2026; accession 0001104659-26-013549): net sales by customer location www.sec.gov
- SEC XBRL company facts for Amphenol Corporation (CIK 820313): quarterly and annual sales, costs and cash flow from Forms 10-Q and 10-K data.sec.gov
- Amphenol Q3 2026 earnings call transcript, 28 Oct 2026, via The Motley Fool (accessed 2 Nov 2026) www.fool.com
- StockAnalysis: Amphenol forecast and analyst ratings, S&P Global data (updated 2 Nov 2026; accessed 2 Nov 2026) stockanalysis.com
- StockAnalysis: Amphenol statistics (accessed 2 Nov 2026) stockanalysis.com
- Dell'Oro Group, data center capex press release, 11 Feb 2026 www.delloro.com
- Dell'Oro Group, data center capex press release, 18 Aug 2026 www.delloro.com
- Bishop & Associates, 2026 Connector Industry Forecast announcement, 13 Oct 2026 bishopinc.com
- Yahoo Finance chart data: APH closing prices and dividends (November 2025 to November 2026) query1.finance.yahoo.com
- Damodaran Online: global industry betas and country equity risk premiums, January 2026 pages.stern.nyu.edu
- QSILabs Amphenol discounted cash flow model (internal; price as of 2 Nov 2026)
Disclaimer
This article is for information only and is not investment advice, a recommendation or an offer to buy or sell any security. QSI Labs and its authors may hold positions in the securities discussed. Forecasts and valuations are estimates that depend on assumptions that may prove wrong. Figures are taken from company filings and third-party sources believed to be reliable, but we do not guarantee their accuracy. Do your own research or consult a licensed adviser before investing.
More from QSI Labs
Related analysis: Dell stock Q3 2026: AI servers and backlog, Nvidia stock Q3 2026: Rubin, Broadcom stock Q3 2026: AI XPUs and Cisco stock Q3 2026: AI networking orders.
Read our white paper, QSI Labs: An AI-Native Trading Firm Built on a Training Loop (October 2026), available on request, or browse the research index.