Research / Earnings and valuation
Dell Stock Q3 2026:Revenue Up 58% as AI Server Backlog Reaches $95bn and PCs Slow
As of: Figures are as of Dell Technologies' fiscal second-quarter 2027 results (the quarter ended 31 July 2026, reported 1 September 2026 in a Form 8-K) and its Form 10-Q for the quarter, filed 8 September 2026. Dell's fiscal year ends on the Friday nearest 31 January, so fiscal Q2 FY2027 (May to July 2026) is its latest reported quarter; fiscal Q3 FY2027, the quarter to 30 October 2026, had not been reported by publication. The share price is the NYSE close of DELL on 30 October 2026, $424.30. Analyst estimates are S&P Global consensus as shown by StockAnalysis (updated 26 October 2026) and, for fiscal 2029, ChartMill (accessed 2 November 2026). Published 2 November 2026.
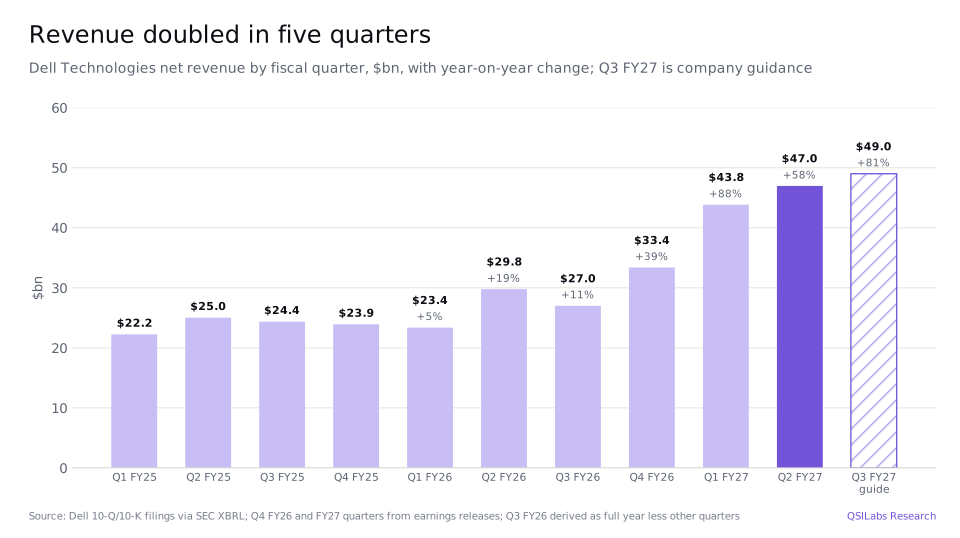
The short answer. Dell stock Q3 2026 coverage starts with the biggest quarter in the company's history and a sharp sell-off. Dell Technologies (NYSE: DELL) grew revenue 58% to $47.0bn in its fiscal second quarter of 2027, the three months to 31 July 2026, which the company called a record. AI-optimized servers brought in $16.4bn, double a year earlier, and Dell booked $60.9bn of AI orders, leaving a $95bn AI backlog. Diluted EPS rose 273% to $6.34 and Dell raised its fiscal 2027 revenue guidance by $25bn to $192.0bn. Then, on 30 October, Intel warned that memory shortages would shrink the PC market by about 12% in 2026 and 10% in 2027, and DELL fell 10.8% to $424.30. Our discounted cash flow model puts Dell at $272.1 a share. The growth is real; the question is how much of it lasts once the AI build-out and memory prices normalize.
Key takeaways
- Revenue up 58%. Fiscal Q2 FY27 revenue was $46,971m, up from $29,776m a year earlier. Infrastructure Solutions Group (ISG) revenue rose 89% to $31.8bn and Client Solutions Group (CSG) revenue rose 20% to $15.0bn.
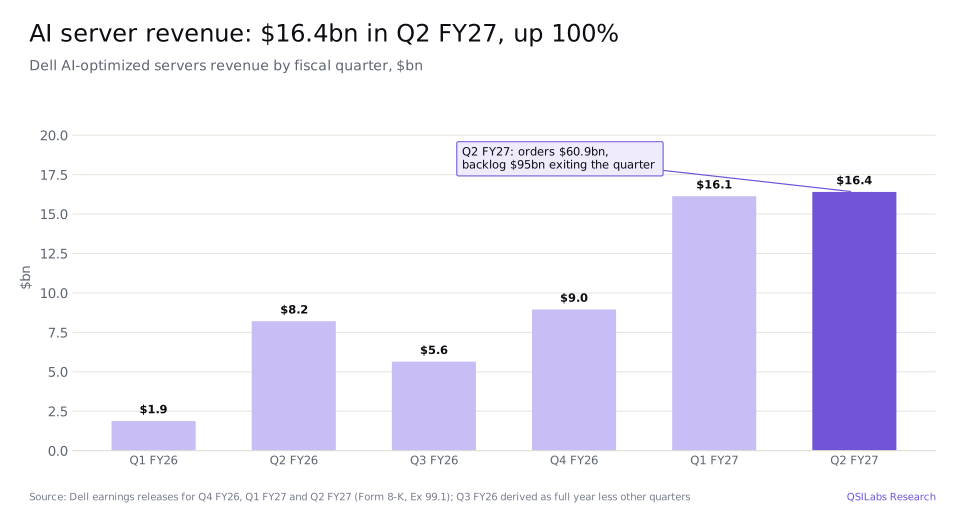
- AI servers doubled. AI-optimized servers revenue was $16.4bn, up 100%. Dell booked $60.9bn of AI orders in the quarter and ended it with a $95bn AI backlog; the company described all three as records.
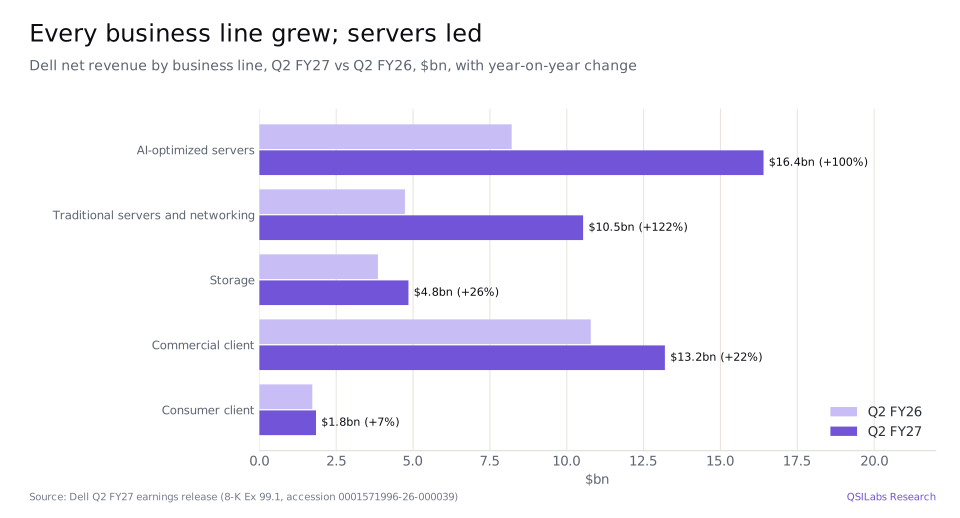
- Servers beyond AI grew faster still. Traditional servers and networking revenue rose 122% to $10.5bn and storage 26% to $4.9bn.
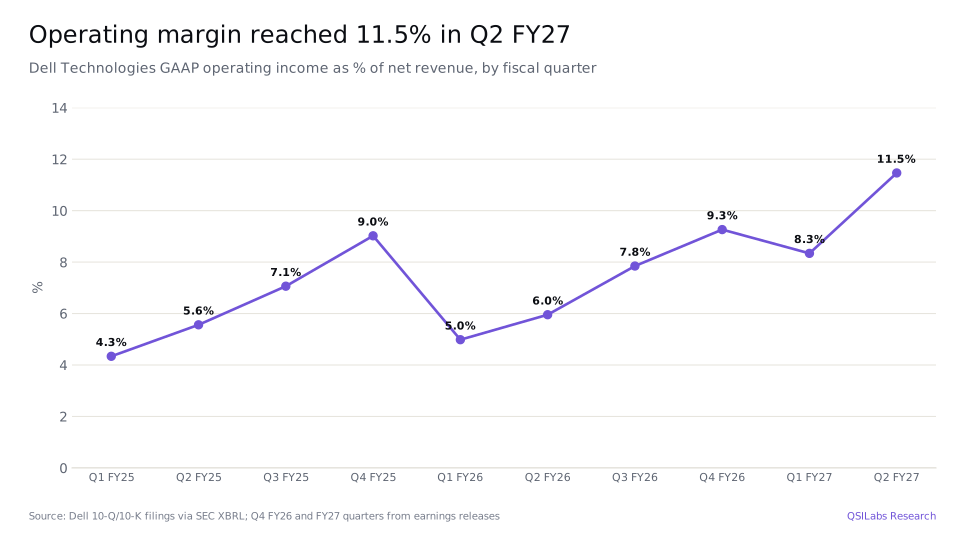
- Profit grew faster than sales. GAAP operating income rose 204% to $5,385m, an 11.5% operating margin against 6.0% a year earlier. Diluted EPS was $6.34, up 273%; non-GAAP EPS was $7.04, up 203%.
- Guidance raised again. Dell now expects fiscal 2027 revenue of $192.0bn (previously $167.0bn), AI server revenue of $74.0bn (previously $60.0bn) and non-GAAP EPS of $25.50, and fiscal Q3 revenue of $49.0bn, up 81%.
- Cash lagged profit. Operating cash flow was $2.2bn in the quarter, down 13%, as inventories doubled in six months to $21.3bn to support the AI build. Dell still returned $4.3bn to shareholders, mostly through buybacks.
- Our value: $272.1 a share, about 36% below the $424.30 close on 30 October 2026, as of 2 November 2026. A two-stage cross-check gives $279.2; the average analyst price target was $595 before the late-October fall.
Key numbers from Dell's fiscal Q2 FY27 earnings
| Metric | Q2 FY27 | Q2 FY26 | Change |
|---|---|---|---|
| Net revenue | $46,971m | $29,776m | +58% |
| ISG revenue | $31,782m | $16,800m | +89% |
| AI-optimized servers revenue | $16,401m | $8,208m | +100% |
| Traditional servers and networking revenue | $10,531m | $4,736m | +122% |
| Storage revenue | $4,850m | $3,856m | +26% |
| CSG revenue | $15,034m | $12,503m | +20% |
| Gross margin | 20.9% | 18.3% | +2.6pt |
| Operating income | $5,385m | $1,773m | +204% |
| GAAP operating margin | 11.5% | 6.0% | +5.5pt |
| Net income | $4,133m | $1,164m | +255% |
| Diluted EPS | $6.34 | $1.70 | +273% |
| Non-GAAP diluted EPS | $7.04 | $2.32 | +203% |
| Operating cash flow | $2,225m | $2,543m | -13% |
| AI orders in the quarter | $60.9bn | ||
| AI backlog at quarter end | $95bn |
Sources: Dell Q2 FY27 earnings release (Form 8-K, Exhibit 99.1); margins are as reported by Dell.
What did Dell report in its latest quarter?
Dell's latest reported quarter is its fiscal second quarter of 2027, which ran from May to 31 July 2026 and was reported on 1 September. It is the quarter that sits inside the calendar Q3 2026 reporting season, which is why this article carries a Q3 2026 label. The headline numbers were large by any measure: revenue of $46,971m, up 58%; operating income of $5,385m, up 204%; and net income of $4,133m, up 255%. Diluted EPS was $6.34, against $1.70 a year earlier.
The quarter continued a run that began in fiscal 2026. Revenue was $23.4bn in the first quarter of that year and $47.0bn five quarters later, roughly double. Over the first half of fiscal 2027 Dell's revenue was $90.8bn, up 71%, and operating income was $9,041m, up 208%.
Two things drove the step-up. First, AI-optimized servers, the GPU-dense systems Dell sells to cloud providers, AI start-ups, governments and large enterprises, contributed $16.4bn, almost exactly double the $8.2bn of a year earlier. Second, and less expected, traditional servers and networking more than doubled to $10.5bn. The PC business, reported as CSG, grew 20% to $15.0bn, mainly on commercial PCs.
- 26 Feb 2026Fiscal 2026 results; first FY27 guidance of $138-142bn revenue and about $50bn of AI server revenue; dividend raised 20%8-K Ex 99.1
- 28 May 2026Q1 FY27: revenue $43.8bn (+88%); FY27 guidance raised to $167bn and AI servers to about $60bn8-K Ex 99.1
- 31 Jul 2026Fiscal Q2 FY27 ends: cash $11.6bn, total debt $34.5bn, inventories $21.3bnForm 10-Q
- 1 Sep 2026Q2 FY27: revenue $47.0bn (+58%), AI orders $60.9bn, AI backlog $95bn; FY27 guidance raised to $192bn8-K Ex 99.1
- 8 Sep 2026Form 10-Q for the quarter filedSEC EDGAR
- 15 Sep 2026$5.0bn of senior notes issued in four tranches due 2029 to 2037Form 8-K
- 17 Sep 2026DELL closes at $588.40, its highest close of the past yearYahoo Finance
- 21 Oct 2026General counsel Richard Rothberg to retire on 1 February 2027Form 8-K
- 29 Oct 2026Intel forecasts 2026 PC units down about 12% and 2027 down about 10% on memory shortagesBenzinga, TipRanks
- 30 Oct 2026DELL falls 10.8% to $424.30, the price used in our valuation; $0.63 dividend payableYahoo Finance; 8-K Ex 99.1
- 2 Nov 2026DELL closes at $392.78, down a further 7.4%Yahoo Finance
How big is Dell's AI server business now?
AI servers are now the largest single line in Dell's accounts. AI-optimized servers revenue was $16,401m in fiscal Q2, against $16,132m in Q1 and $8,208m a year earlier. In the first half of fiscal 2027 the line brought in $32.5bn, more than the $24.7bn Dell recognized in the whole of fiscal 2026.
Orders are the bigger story. Dell booked $60.9bn of AI orders in the quarter, compared with $24.4bn in Q1 and more than $64bn in the whole of fiscal 2026, and it exited the quarter with a $95bn AI backlog, up from $43bn at the start of the fiscal year. The company called the orders, revenue and backlog figures records. Dell also disclosed about $132bn of remaining performance obligations at 31 July 2026, which include deferred revenue and unbilled amounts, and expects to recognize about 77% of that within twelve months.
Guidance shows how much of the backlog Dell expects to ship this year. It now expects about $74.0bn of AI server revenue in fiscal 2027, which, after $32.5bn in the first half, implies roughly $41.5bn in the second half. That still leaves much of the $95bn backlog for fiscal 2028 and beyond, which is the main support for the consensus forecast of another 19% revenue growth next year.
The backlog needs some care. Dell's 10-Q says that "there is inherent non-linearity in the timing of demand and subsequent shipments" for AI servers, because customers differ in readiness and components change often. Backlog converts to revenue only when customers have data centre power and space ready, and AI servers carry thinner margins than storage or traditional servers.
Why did traditional servers and storage grow so fast?
Traditional servers and networking revenue rose 122% to $10,531m, faster than AI servers. Dell's management linked the strength to customers investing across their IT estates, saying IT environments "have shifted from cost centers to value drivers". Part of the growth is likely price: the 10-Q describes "substantial inflation in memory component costs", and servers carry large amounts of memory, so higher component costs lift selling prices as well as costs.
Storage revenue rose 26% to $4,850m, which Dell called a record for a second quarter. Storage matters more to profit than its size suggests, because it carries higher margins than servers. ISG operating income rose 225% to $4,781m and the ISG operating margin widened to 15.0% from 8.8% a year earlier; ISG now produces 81% of Dell's segment operating income.
How is Dell's PC business doing, and how exposed is it to the PC slump?
The PC business was healthy in the quarter to July. CSG revenue rose 20% to $15,034m: commercial client revenue grew 22% to $13,192m, which Dell called a record, and consumer revenue grew 7% to $1,842m. CSG operating income rose 42% to $1,142m, a 7.6% margin against 6.4% a year earlier.
The outlook has since worsened. Preliminary IDC data published on 8 October show worldwide PC shipments fell 20.1% in calendar Q3 2026 (July to September) to 62.7 million units, and Dell's fell 25.0% to 7.6 million, a faster fall than the market. IDC pointed to buyers stocking up earlier in the year ahead of memory-driven price rises, followed by weaker demand as prices stayed high. On 29 October Intel said it expects the PC market to shrink about 12% in 2026, with second-half units down more than 20%, and about 10% in 2027.
Dell's revenue has so far held up better than units, which suggests higher prices per PC. But CSG is about a third of Dell's revenue, and a volume decline of that size would be hard to offset with price alone. CSG also sits on the same memory supply chain as the server business, so the same shortage that lifts server prices squeezes PC volumes.
What is happening to Dell's margins and earnings per share?
Margins widened sharply. Dell's GAAP gross margin rose to 20.9% from 18.3%, and operating expenses fell to 9.5% of revenue from 12.3%, as selling and administrative costs grew 15% while revenue grew 58%. The GAAP operating margin of 11.5% was the highest of the past ten quarters.
EPS grew faster than profit, because Dell has been buying back shares. The diluted share count fell 5% to 652m. Diluted EPS of $6.34 and non-GAAP EPS of $7.04 compare with the midpoints of Dell's own guidance, given in May, of $4.48 and $4.80. The gap between GAAP and non-GAAP EPS is mostly amortization of intangibles, stock-based compensation and other corporate costs, partly offset by gains on equity investments.
The tax rate rose to 19.5% from 19.2% in the quarter, while the first-half rate was 16.6%. Interest and other expense was a net $254m.
What is Dell's fiscal 2027 guidance?
Dell raised its full-year outlook for the second time in three months. It now expects:
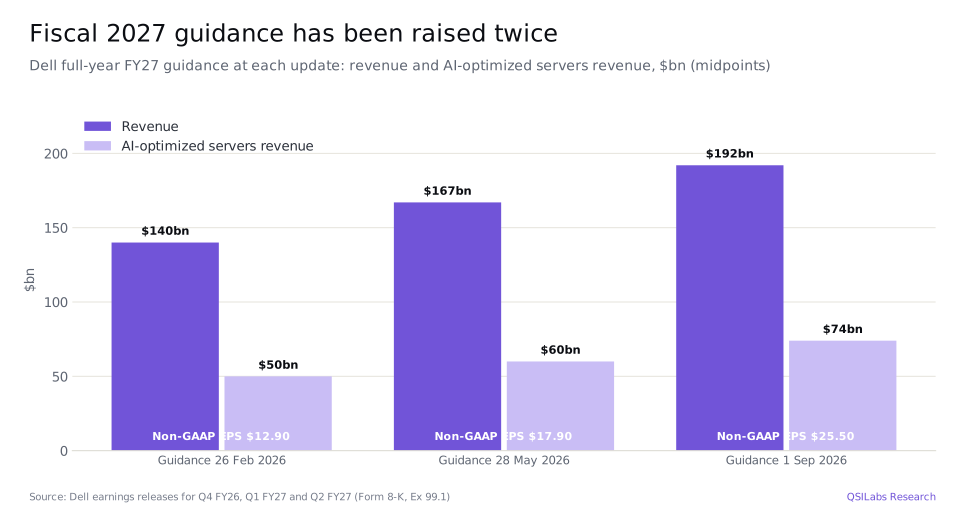
- Fiscal 2027 revenue of $192.0bn, up 69%, against $167.0bn in May and $140.0bn at the midpoint in February.
- AI-optimized servers revenue of $74.0bn, up 200%, against about $60bn in May and about $50bn in February.
- GAAP diluted EPS of $24.37, up 181%, and non-GAAP EPS of $25.50, up 148%.
- Fiscal Q3 revenue of $49.0bn, up 81%, with GAAP EPS of $6.10 and non-GAAP EPS of $6.50.
The full-year guide implies second-half revenue of about $101.2bn, of which $49.0bn falls in fiscal Q3 and about $52.2bn in fiscal Q4. Analysts are slightly ahead: S&P Global consensus, as shown by StockAnalysis on 26 October, expects fiscal 2027 revenue of $193.5bn and EPS of $25.90, and fiscal 2028 revenue of $230.7bn and EPS of $30.26.
The 10-Q adds a caveat on margins. Dell expects "margin rate pressure resulting from a continuing shift in mix towards our AI-optimized servers offerings", and expects "the notable inflationary environment for component costs will persist throughout the remainder of Fiscal 2027".
How much cash does Dell generate, and where does it go?
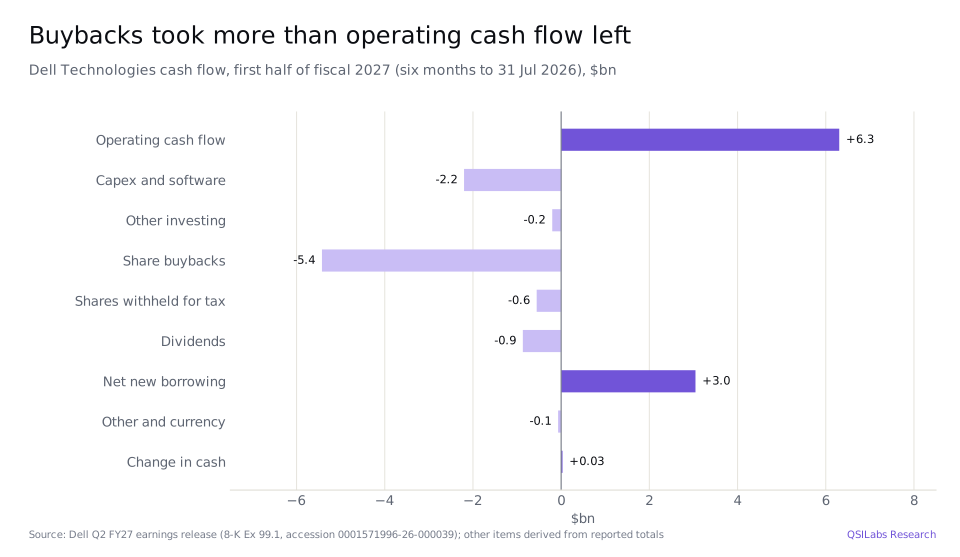
Cash flow has not kept pace with profit. Operating cash flow was $2,225m in the quarter, down 13%, and $6,306m in the first half, up 18%. Capital spending and capitalized software took $2,202m in the first half, leaving free cash flow of $4,104m, flat on a year earlier. The reason is working capital: inventories rose to $21,290m at 31 July from $10,437m in January, and accounts receivable to $22,918m from $17,585m, as Dell built AI systems ahead of delivery. Accounts payable rose to $49,723m, funding much of that build.
Dell also reports an adjusted free cash flow figure of $8,149m for the quarter and $11,314m for the first half. That measure adds back $6.4bn of first-half growth in financing receivables, the loans and leases Dell Financial Services (DFS) provides to customers, so it is closer to a gross cash figure than to cash available to shareholders.
Shareholder returns ran ahead of free cash flow. Dell repurchased about 20 million shares for about $5.4bn in the first half, $3.8bn of it in Q2, and paid $869m of dividends. It covered the gap with $3.0bn of net new borrowing, and in September issued a further $5.0bn of senior notes due between 2029 and 2037 at coupons of 5.100% to 5.900%. Total debt was $34,466m at 31 July, including debt that funds DFS, against cash of $11,569m. Shareholders' equity was a deficit of $1,427m.
Why did Dell stock fall in late October 2026?
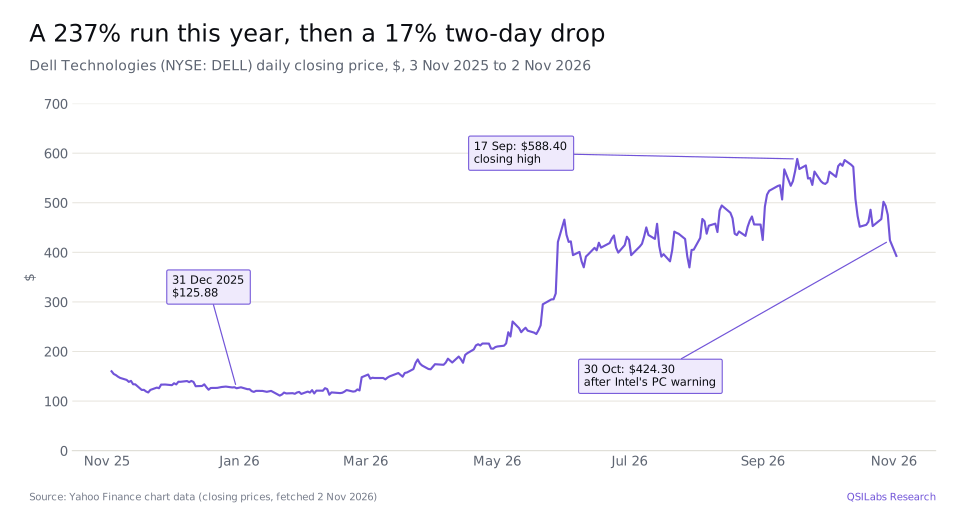
DELL had been one of the best-performing large US stocks of the year. It closed 2025 at $125.88 and reached a closing high of $588.40 on 17 September 2026, after the fiscal Q2 report lifted the shares 15.8% on 2 September. It then drifted lower in October before two sharp falls.
On 29 October, after the market closed, Intel reported its third quarter and warned that memory shortages were cutting PC demand. Chief executive Lip-Bu Tan said the "pace of this PC correction has accelerated over the last 2 months" as PC makers cut inventory, and that he expects the environment to persist "until memory availability and prices begin to normalize". Dell fell 10.8% on 30 October to $424.30, and a further 7.4% to $392.78 on 2 November. Even after that, the shares were up about 212% from the end of 2025.
The read-across is not only about PCs. Memory is a large part of the cost of an AI server, and the same shortage that is raising PC prices raises Dell's server costs. Dell has so far passed costs on, but the market is now pricing a risk that higher prices slow orders or squeeze margins. For Intel's own results, see our Intel stock Q3 2026 analysis; for the memory side, see Micron stock Q3 2026.
Dell stock Q3 2026: is DELL stock overvalued?
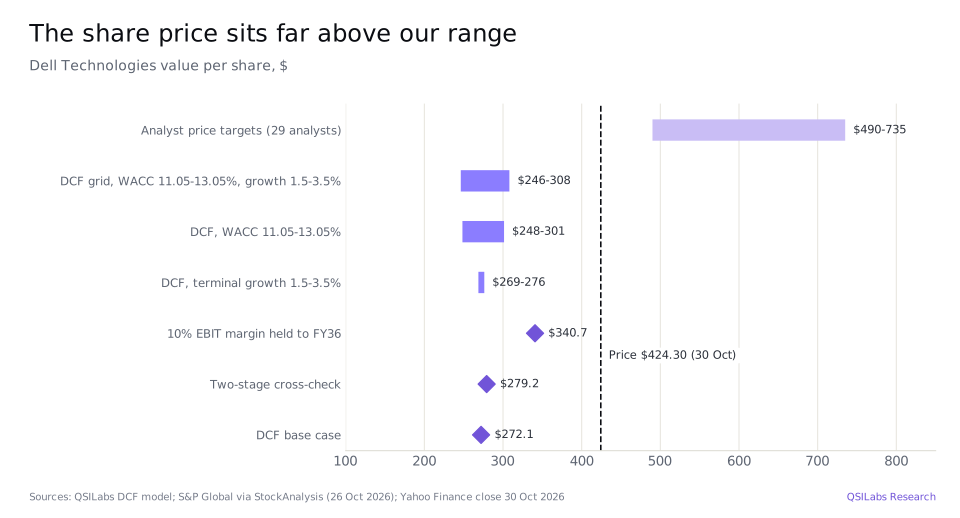
On our numbers, yes. Our discounted cash flow model values Dell at $272.1 a share, about 36% below the $424.30 close on 30 October 2026 and 31% below the $392.78 close on 2 November. A two-stage cross-check, which fades returns on new investment towards the cost of capital after the forecast period, gives $279.2. Analysts are far more positive: the 29 analysts tracked by S&P Global had an average price target of $595, with a range of $490 to $735, before the late-October fall.
At $424.30 the shares trade on 16.6 times Dell's fiscal 2027 non-GAAP EPS guidance of $25.50, and 14.0 times the fiscal 2028 consensus of $30.26. Those multiples look modest. The difference between our value and the market price comes from how long the current level of profit lasts. Dell's GAAP operating margin was 6.5% in fiscal 2025 and 7.2% in fiscal 2026, and the 10% we use for fiscal 2027 and 2028 is well above anything it earned in those years.
Method
We forecast Dell's revenue, operating margin, tax, capital spending and working capital year by year for fiscal 2027 to 2036 and discount the resulting unlevered free cash flow at a 12.0% cost of capital, with 2.5% terminal growth.
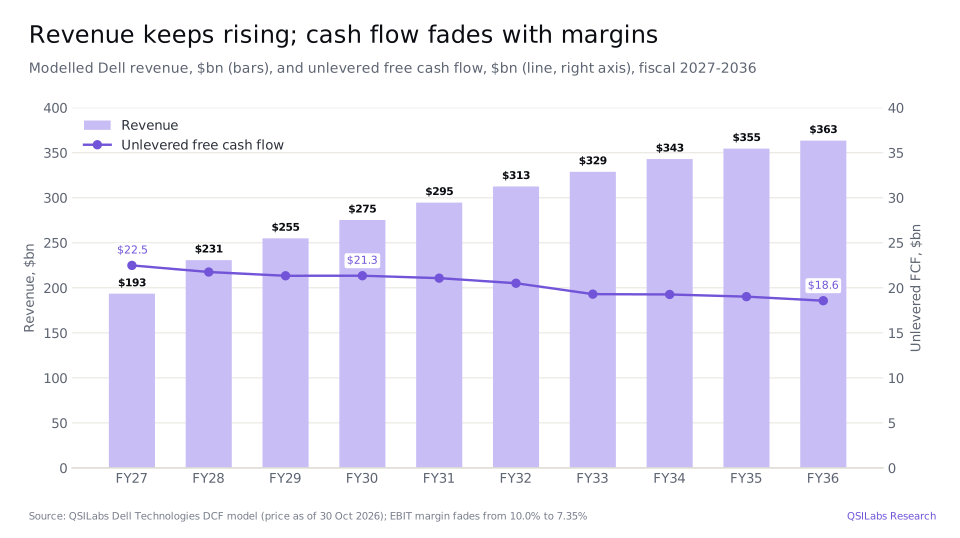
- Revenue. We use S&P Global consensus for the next two years: $193.5bn in fiscal 2027, up 70%, and $230.7bn in fiscal 2028, up 19.2%. Dell expects to recognize about 77% of its $132bn of remaining performance obligations within twelve months, which supports that second year. For fiscal 2029 we use 10.5%, the growth implied by consensus compiled by ChartMill. For fiscal 2030 we use 8%, the midpoint of the 7% to 9% a year Dell targets in the long-term framework it set out at its October 2025 analyst meeting, which looks out to fiscal 2030 and has ISG growing 11% to 14% a year and CSG 2% to 3%. Growth is 7% in fiscal 2031 and then slows by about 0.9 points a year to 2.5% in fiscal 2036, taking revenue to $363.5bn. IDC expects worldwide AI infrastructure spending to rise from $497bn in 2026 to $1.21tn in 2030, still growing 12% in that final year, which is why our path slows gradually rather than stalling.
- Margin. We assume a 10.0% EBIT margin in fiscal 2027 and 2028, consistent with Dell's second-half EPS guidance, fading to 7.35% by fiscal 2033 as AI hardware pricing normalizes and memory costs ease. The end point follows Dell's mix. In our forecast ISG and other revenue makes up about 79% of the total by fiscal 2033. Dell targets a 10% to 14% operating margin for ISG and 5% to 7% for CSG. Taking the low end of both ranges, less about 1.6% of revenue for amortization, stock-based compensation and other corporate costs (their fiscal 2026 level), gives 7.35%. Fiscal 2027 operating income comes to about $19.4bn.
- Tax and reinvestment. We use a 16.6% tax rate, Dell's first-half rate. Capital spending rises from $4.6bn to $12.6bn over the decade. Working capital releases cash as revenue grows, because Dell is paid by customers before it pays suppliers.
- Cost of capital. A 12.0% cost of capital reflects the high volatility of Dell's shares and its leverage. It is above Damodaran's US industry figure of 10.9%.
- Bridge to equity. We treat the roughly $9.6bn of debt that funds DFS as matched by its $20.4bn of financing receivables and leave both out of the bridge. Net debt outside DFS was $13.3bn at 31 July. We add about $1.7bn for cash generated between 31 July and 30 October, less the October dividend, and divide by 647m diluted shares.
That gives an enterprise value of $187.7bn, of which the terminal value is 37.1%, and equity value of $176.1bn. The market price implies an enterprise value of about $286bn, about 1.5 times ours.
How the number moves if you argue with us
Our value is not very sensitive to the usual dials. Moving terminal growth between 1.5% and 3.5% shifts it between $268.7 and $276.2. Moving the cost of capital between 11.05% and 13.05% shifts it between $248.4 and $301.3. The full grid runs from $246.3 to $308.1, all well below the share price.
The assumption that matters is the margin. Our forecast has Dell's operating margin falling from 10.0% to 7.35%, a little above its fiscal 2025 and 2026 levels of 6.5% and 7.2% because servers and storage make up a larger share of revenue. Holding a 10% margin from fiscal 2028 to 2036 in the same model lifts the value to $340.7 a share, still about 20% below the share price. An investor buying at $424 is betting that AI demand grows faster than Dell's own long-term framework and that Dell holds today's profitability through a full hardware cycle, including a cycle in memory prices.
What are the main risks for Dell stock?
- AI order timing. AI orders swing widely from quarter to quarter, as the jump from $24.4bn to $60.9bn shows. A slowdown in hyperscaler or AI start-up capital spending would hit both orders and the backlog.
- Memory costs and supply. Dell's 10-Q describes "substantial inflation in memory component costs". If Dell cannot pass costs on, margins fall; if it can, demand may slow.
- The PC slump. IDC data show Dell's PC shipments down 25% in calendar Q3, and Intel expects the PC market to shrink again in 2027. CSG is about a third of revenue.
- Customer concentration and credit. AI servers are sold to a relatively small number of large buyers, some of them young companies, and DFS financing receivables rose to $20.4bn at 31 July.
- Leverage. Total debt was $34.5bn at 31 July and Dell issued $5.0bn of notes in September, while shareholders' equity is negative.
- Upside risk. Dell has raised its full-year guidance at each of its last two reports, both times after beating its own quarterly revenue guidance. If the $95bn backlog converts at today's margins and orders keep growing, earnings could stay above our forecast for longer.
Related reading: Nvidia stock Q3 2026, Cisco stock Q3 2026: AI networking orders and Applied Materials stock Q3 2026.
FAQ
What is Dell's share price compared with the QSILabs DCF value after Q3 2026?
Our DCF model values Dell Technologies at $272.1 a share, as of 2 November 2026. The stock closed at $424.30 on 30 October 2026, so our value is about 36% below the market price; at the 2 November close of $392.78 the gap is about 31%.
Is Dell stock a buy after its fiscal second quarter?
We do not give buy or sell recommendations. On our assumptions the share price already reflects margins and growth well above what Dell has sustained in the past. Investors who expect Dell to hold today's margins as AI server demand grows will see more value than we do.
How fast will Dell's revenue grow after fiscal 2028?
Dell's long-term framework, set out at its analyst meeting on 7 October 2025, targets revenue growth of 7% to 9% a year through fiscal 2030, with ISG growing 11% to 14% and CSG 2% to 3%. Consensus compiled by ChartMill implies about 10.5% growth in fiscal 2029. Our model uses 10.5% for fiscal 2029, 8% for fiscal 2030 and 7% for fiscal 2031, then slows to 2.5% by fiscal 2036.
Why does a Q3 2026 article cover Dell's fiscal second quarter?
Dell's fiscal year ends on the Friday nearest 31 January, so its quarters run about a month behind the calendar. Fiscal Q2 FY2027 covered May to July 2026 and was reported on 1 September, during the calendar Q3 2026 reporting season. Fiscal Q3 FY2027, the quarter to 30 October 2026, had not been reported by publication.
How much revenue did Dell make in the quarter to July 2026?
Dell made $46,971m of revenue in fiscal Q2 FY2027, up 58% from $29,776m a year earlier. ISG contributed $31,782m and CSG $15,034m.
How big is Dell's AI backlog?
Dell exited fiscal Q2 FY2027 with a $95bn AI backlog, after booking $60.9bn of AI orders in the quarter. It started the fiscal year with a $43bn backlog.
When does Dell report its next quarter?
Dell has not reported fiscal Q3 FY2027, the quarter that ended on 30 October 2026. Benzinga lists 24 November 2026 as the expected date. Dell guided to revenue of $49.0bn and non-GAAP EPS of $6.50 for that quarter.
How much revenue does Dell expect in fiscal 2027?
Dell expects $192.0bn of revenue in fiscal 2027, the year ending 29 January 2027, up 69%. That includes about $74.0bn of AI-optimized servers revenue. It expects GAAP EPS of $24.37 and non-GAAP EPS of $25.50.
Does Dell pay a dividend?
Yes. Dell declared a quarterly dividend of $0.63 a share on 1 September 2026, payable on 30 October to shareholders of record on 20 October. That is $2.52 a year, a yield of about 0.6% at $424.30.
Is Dell buying back shares?
Yes. Dell repurchased about 20 million shares for about $5.4bn in the first half of fiscal 2027, including $3.8bn in fiscal Q2, and returned $4.3bn to shareholders in that quarter through buybacks and dividends.
How much debt does Dell have?
Dell had total debt of $34,466m at 31 July 2026, including about $9.6bn that funds its financing business, and cash of $11,569m. It issued another $5.0bn of senior notes in September 2026.
How do memory prices affect Dell?
Memory is a large share of the cost of both servers and PCs. Dell's 10-Q describes substantial inflation in memory component costs and expects it to persist through fiscal 2027. Higher memory prices have lifted Dell's selling prices so far, but they are also cutting PC demand across the industry.
Sources
- Dell Technologies Inc., Q2 fiscal 2027 earnings release (Form 8-K, Exhibit 99.1, 1 Sep 2026; accession 0001571996-26-000039) www.sec.gov
- Dell Technologies Inc., Form 10-Q for the quarter ended 31 Jul 2026 (filed 8 Sep 2026; accession 0001571996-26-000046) www.sec.gov
- Dell Technologies Inc., Q1 fiscal 2027 earnings release (Form 8-K, Exhibit 99.1, 28 May 2026; accession 0001571996-26-000021) www.sec.gov
- Dell Technologies Inc., Q4 and full-year fiscal 2026 earnings release (Form 8-K, Exhibit 99.1, 26 Feb 2026; accession 0001571996-26-000003) www.sec.gov
- Dell Technologies Inc., senior notes offering (Form 8-K, 15 Sep 2026; accession 0001193125-26-391976) www.sec.gov
- Dell Technologies Inc., officer retirement (Form 8-K, 21 Oct 2026; accession 0001193125-26-427920) www.sec.gov
- SEC XBRL company facts for Dell Technologies (CIK 1571996): quarterly and annual revenue, operating income, EPS and cash flow data.sec.gov
- StockAnalysis: Dell Technologies forecast and analyst ratings, S&P Global data (last updated 26 Oct 2026; accessed 2 Nov 2026) stockanalysis.com
- Yahoo Finance chart data: DELL closing prices (one year to 2 Nov 2026) query1.finance.yahoo.com
- Benzinga, "Dell, HP Stocks Tumble As Intel Flags Deepening PC Slump, Memory Shortages" (30 Oct 2026) www.benzinga.com
- TipRanks, "Why Are DELL and HPQ Stocks Plunging in Premarket Trading Today, October 30?" (30 Oct 2026) www.tipranks.com
- InfotechLead, "Global PC Shipments Fall 20.1% in Q3 2026 as Higher Prices Hit Demand" (IDC preliminary data, 8 Oct 2026) infotechlead.com
- Dell Technologies Inc., Securities Analyst Meeting press release with long-term financial framework (Form 8-K, Exhibit 99.1, 7 Oct 2025; accession 0001193125-25-232662) www.sec.gov
- Dell Technologies Inc., 2025 Securities Analyst Meeting transcript (7 Oct 2025)
- ChartMill: Dell Technologies (DELL) analyst revenue estimates (accessed 2 Nov 2026) www.chartmill.com
- IDC, worldwide AI infrastructure spending forecast (blog, 21 Jul 2026) www.idc.com
- Damodaran Online: cost of capital by industry (US), January 2026 pages.stern.nyu.edu
- QSILabs Dell Technologies discounted cash flow model (internal; price as of 30 Oct 2026)
Disclaimer
This article is for information only and is not investment advice. QSI Labs Research may hold positions in the securities discussed. The DCF value is an estimate based on the assumptions described above and on public information as of the date of publication; actual results will differ. Figures are rounded and some are QSILabs calculations from reported data. Dell, Dell Technologies and other names are trademarks of their owners, used for identification only.
More from QSI Labs
Related analysis: Intel stock Q3 2026, Nvidia stock Q3 2026, Micron stock Q3 2026: HBM and Cisco stock Q3 2026.
Read our white paper, QSI Labs: An AI-Native Trading Firm Built on a Training Loop (October 2026), available on request, or browse the research index.