Research / Earnings and valuation
Broadcom Stock Q3 2026:Custom AI Chips, a $34.8bn Guide and the Road to $230bn
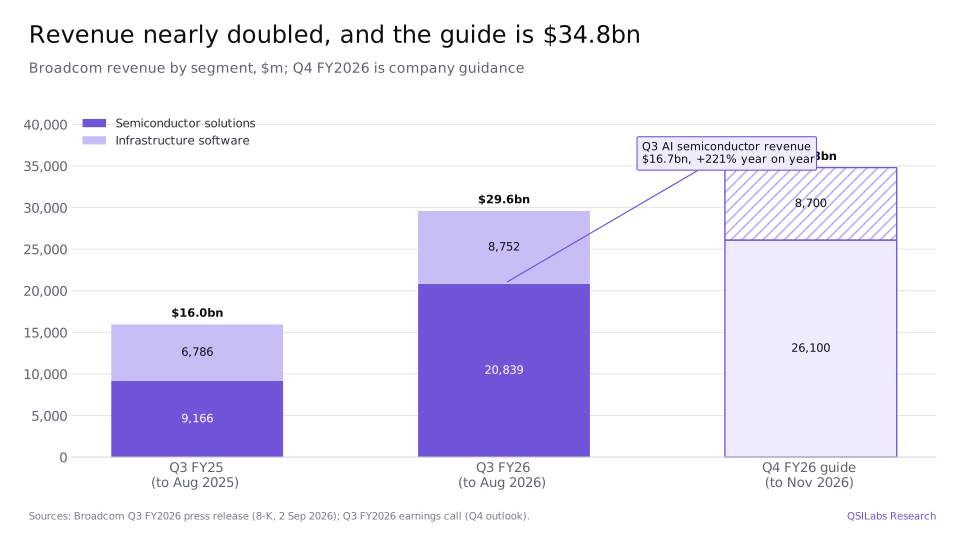
Our Broadcom stock Q3 2026 review of Broadcom Inc. (NASDAQ: AVGO) starts from a share price of $326.08, the 30 October 2026 close, about 34% below its 52-week high of $495.00 (Yahoo Finance). The business has never grown faster. In the quarter to 2 August 2026 Broadcom booked $29.6bn of revenue, up 86% year on year, guided to $34.8bn for the quarter to 1 November, and told investors to expect AI semiconductor revenue of about $115bn in fiscal 2027 and about $230bn in fiscal 2028 (Q3 FY2026 press release; earnings call). The open questions are gross margins, customer concentration, and how much of its customers' build-out Broadcom is now helping to finance.
The short answer. Broadcom (AVGO) stock looks close to fully valued after Q3 2026. Its latest quarter set records for revenue, operating income and free cash flow, and the Q4 guide implies another $5.2bn of sequential growth. Our discounted cash flow model puts fair value at $313.43 a share, about 4% below the $326.08 close on 30 October 2026: even after building in management's AI outlook in full, the price leaves little margin for a slower ramp.
A note on timing. Broadcom's fiscal year ends on the Sunday closest to 31 October, so its fiscal Q3 2026 covers 4 May to 2 August 2026 and fiscal Q4 runs to 1 November 2026. Broadcom plans to report Q4 and full-year fiscal 2026 results after the market closes on 9 December 2026 (Q3 FY2026 call). Until then, the latest reported figures are fiscal Q3 2026, which we compare with the same quarter a year earlier, alongside the company's guidance for Q4.
Key takeaways: Broadcom stock Q3 2026
- Fair value. The QSILabs fair value for Broadcom (AVGO) is $313.43 per share as of Q3 2026, against a $326.08 close on 30 October 2026, which puts the shares about 4% above fair value.
- Latest results. Broadcom (AVGO) reported record revenue of $29.6bn for Q3 FY2026, the quarter to 2 August 2026, up 86% year on year, with AI semiconductor revenue of $16.7bn (up 221%) and GAAP diluted EPS of $2.68 against $0.85 (8-K Ex 99.1; Q3 FY2026 call).
- Q4 guidance. Broadcom guided Q4 FY2026 revenue, the quarter to 1 November 2026, to $34.8bn (up 93%), including $21.7bn of AI semiconductor revenue, with a non-GAAP operating margin of about 66%; results are due on 9 December 2026 (Q3 FY2026 call).
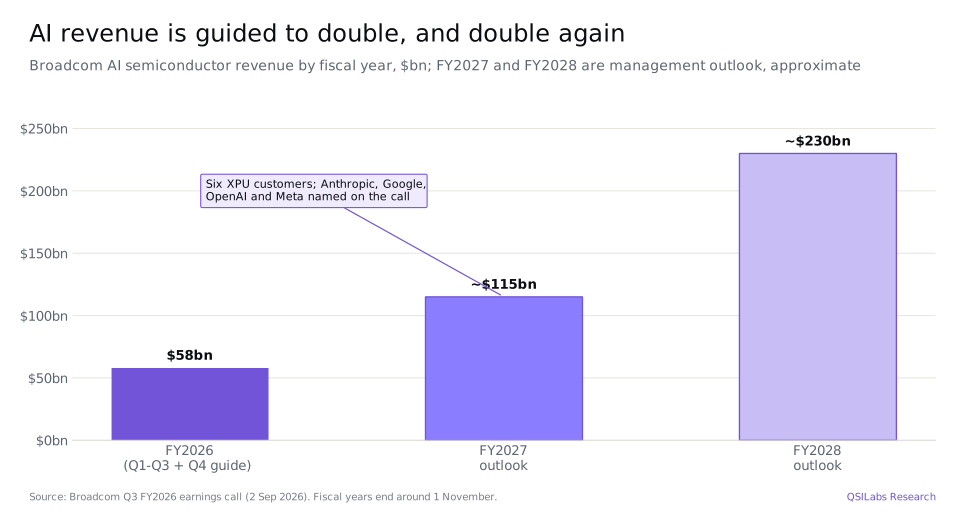
- AI outlook. Broadcom expects AI semiconductor revenue of about $58bn in fiscal 2026, about $115bn in fiscal 2027 and about $230bn in fiscal 2028, roughly $350bn over the next two fiscal years, and says it is on target to exceed $30 of earnings per share in fiscal 2028 (Q3 FY2026 call).
- Off-balance-sheet support. Broadcom has two residual value backstops on AI-rack leases for its customers, with maximum undiscounted exposure of about $29bn (Form 10-Q) and about $43bn (Form 8-K, 26 October 2026); neither has been drawn.
Broadcom earnings: how did Q3 FY2026 compare with last year?
| Metric | Q3 FY2026 | Q3 FY2025 | Change |
|---|---|---|---|
| Revenue | $29,591m | $15,952m | +86% |
| Semiconductor solutions | $20,839m | $9,166m | +127% |
| Infrastructure software | $8,752m | $6,786m | +29% |
| GAAP gross margin | 69.1% | 67.1% | +2.0 pts |
| GAAP operating income | $15,955m | $5,887m | +171% |
| Non-GAAP operating income | $20,095m | $10,455m | +92% |
| GAAP net income | $13,088m | $4,140m | +216% |
| GAAP diluted EPS | $2.68 | $0.85 | +215% |
| Non-GAAP diluted EPS | $3.32 | $1.69 | +96% |
| Operating cash flow | $14,197m | $7,166m | +98% |
| Free cash flow | $13,665m | $7,024m | +95% |
Broadcom's Q3 FY2026 results roughly doubled almost every line against Q3 FY2025. Revenue rose from $15.95bn to $29.59bn, driven by semiconductor solutions, which grew 127% to $20.84bn and now make up 70% of revenue (8-K Ex 99.1). Infrastructure software, mainly VMware, grew 29% to $8.75bn.
GAAP operating income almost tripled, from $5.9bn to $16.0bn, because operating expenses fell slightly while revenue grew 86%. Research and development was $2.9bn against $3.1bn a year earlier, and amortisation of acquired intangibles was $2.0bn in total across cost of revenue and operating expenses (Form 10-Q). GAAP net income was $13.1bn, or $2.68 per diluted share, after a 14.3% effective tax charge (our calculation from the income statement).
On the non-GAAP basis that management uses, which excludes stock-based compensation of $2.0bn and amortisation, operating income was a record $20.1bn, up 92%, a 67.9% operating margin, and EPS was $3.32, up 96% (Q3 FY2026 call).
Customer concentration rose with the AI ramp. One distributor accounted for 50% of net revenue in the quarter, against 32% a year earlier, and Broadcom estimates that its top five end customers, through all channels, were about 55% of revenue, against about 40% (Form 10-Q).
How fast is Broadcom's AI revenue growing?
Broadcom's AI semiconductor revenue more than tripled in a year, to $16.7bn in Q3 FY2026, up 221% year on year and 54% on the previous quarter, and it is guided to $21.7bn in Q4 (Q3 FY2026 call). AI was 56% of total revenue in Q3, up from 49% in Q2.
Two product lines drive it. Custom AI accelerators, which Broadcom calls XPUs, were 73% of AI revenue in Q3, or about $12.2bn on our arithmetic, with shipments up more than 3.5 times year on year. AI networking, mainly Ethernet switches and optical components, grew more than 2.5 times. Management expects both to triple year on year in Q4 and says networking should grow as fast as XPUs over the next few years.
The outlook is unusually long for a chip company. Broadcom says it has "secured the supply" to double AI revenue to about $115bn in fiscal 2027, that demand exceeds that figure, and that it has line of sight to another doubling to about $230bn in fiscal 2028 (Q3 FY2026 call). Chief executive Hock Tan described this as about $350bn of AI semiconductors shipped over two years, and said Broadcom is "very much on target to exceed $30 in earnings per share in fiscal 2028". Management also said it does not intend to update this outlook every quarter.
The rest of the chip business is small by comparison. Non-AI semiconductor revenue, which covers broadband, server storage and wireless, was $4.2bn in Q3, up 5% year on year, and is guided to about $4.3bn in Q4.
Broadcom custom AI chips: who are the XPU customers?
Broadcom designs custom AI accelerators, or XPUs, for six customers, and four of them, Google, Anthropic, OpenAI and Meta, account for the bulk of the outlook (Q3 FY2026 call). Unlike a merchant graphics processor, an XPU is co-designed with one customer for its own models, and Broadcom argues that this gives better performance for that workload at less than half the cost of a GPU.
- Google (Alphabet). Broadcom delivered Ironwood, the seventh-generation Tensor Processing Unit (TPU v7), in high volume in Q3 and began production shipments of TPU v8i. A long-term agreement covers future TPU generations and AI networking, with "multi-tens of billions of dollars of TPUs annually over the next several years".
- Anthropic. Anthropic is deploying 1 gigawatt (GW) of Ironwood in 2026 and is expected to deploy another 5 GW of TPU v8i in 2027, with line of sight to an incremental 10 GW in 2028. Broadcom expects Anthropic to be its largest XPU customer in 2027 and 2028.
- OpenAI. Broadcom shipped Jalapeño, OpenAI's first custom accelerator, in Q3. It is on track for about 1.3 GW of deployment in 2027 and more than 5 GW in 2028 with its successor, which would make OpenAI the second-largest XPU customer.
- Meta Platforms. Broadcom will deliver three generations of Meta's MTIA inference accelerators by the end of 2027, with line of sight to 3 GW through 2028.
Per gigawatt, Broadcom puts its content at $20bn-30bn, a range it expects to stay stable as each chip becomes more powerful (Q3 FY2026 call). On a question from an analyst, management said the gigawatts its customers are planning add up to about 30 GW across fiscal 2027 and 2028, but that its revenue outlook assumes that somewhat less of this is actually deployed in the period, because land, power and data centre shells set the pace.
- Q2 FY2026Long-term contract for custom AI accelerators signed (quarter to 3 May 2026)Form 10-Q
- Jun 2026AI XPV platform launched with a $35bn first tranche for more than 1 GW of computeForm 10-Q
- 2 Sep 2026Q3 FY2026 results; FY2027 AI outlook of about $115bn and FY2028 of about $230bn8-K; Q3 FY2026 call
- Q3 FY2026Tomahawk 6 (100 Tbps) deployed at almost all AI hyperscalers; Tomahawk 7 (200 Tbps) taped outQ3 FY2026 call
- 26 Oct 2026Residual value support for a new AI-rack lease vehicle; maximum exposure about $43bn8-K, 27 Oct 2026
- 1 Nov 2026Fiscal 2026 endsForm 10-Q
- 9 Dec 2026Q4 FY2026 results expected, after the market closeQ3 FY2026 call
- FY2027Anthropic expected to be the largest XPU customer; OpenAI deployments of about 1.3 GWQ3 FY2026 call
- FY2028AI revenue outlook of about $230bn; target of more than $30 of earnings per shareQ3 FY2026 call
Networking is the second leg. Broadcom says it was first to market with the 100 terabit-per-second Tomahawk 6 Ethernet switch, which is deployed at almost all the AI hyperscalers, including some that do not use its XPUs, and it has taped out Tomahawk 7, a 200 Tbps switch. Tomahawk Ultra, a low-latency Ethernet switch for connecting accelerators within a rack, began deploying in the quarter (Q3 FY2026 call). Broadcom also makes optical DSPs and lasers, and says it is more than tripling its laser factory capacity year on year.
For a view from the other side of the custom-chip trade, see our Alphabet Q3 2026 analysis of Google Cloud and the TPU build-out. For the merchant GPU alternative, see our NVIDIA Q3 2026 analysis of the Vera Rubin ramp.
Why is Broadcom's gross margin falling while operating margin holds?
Broadcom's gross margin is falling because custom accelerators, which carry a lot of high-bandwidth memory, are a growing share of revenue, while operating margin is holding because operating costs grow far more slowly than sales (Q3 FY2026 call). Non-GAAP gross margin was 75% in Q3, down 2.1 points on Q2, and is guided to about 73% in Q4, against 78% a year earlier. The Q4 non-GAAP operating margin is guided to about 66%, flat on a year earlier.
On a GAAP basis the picture is better than a year ago, because amortisation is now a smaller share of a much larger revenue base. GAAP gross margin rose from 67.1% to 69.1% and GAAP operating margin from 36.9% to 53.9% (Form 10-Q; our calculation).
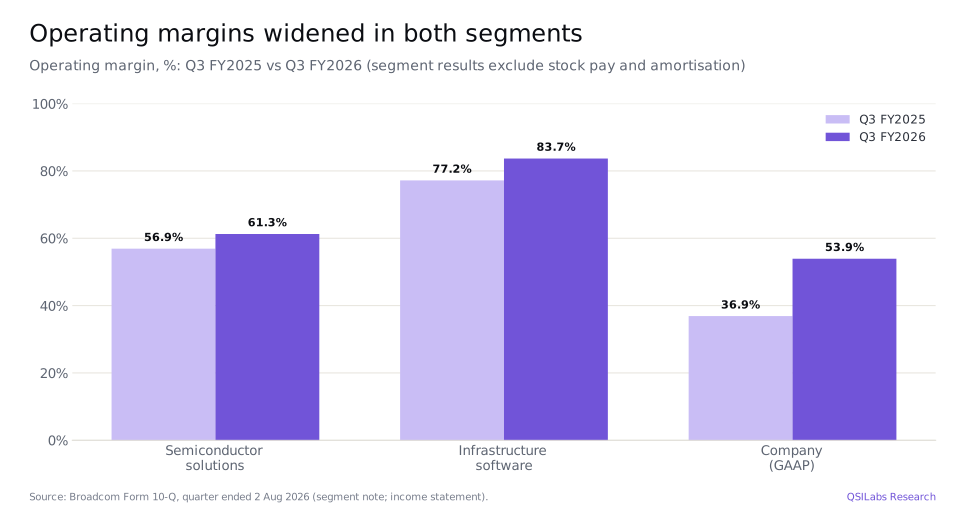
By segment, semiconductor solutions earned $12.8bn of operating income on $20.8bn of revenue, a 61.3% margin, up from 56.9%. Its gross margin was about 67%, as the chief financial officer clarified on the call. Infrastructure software earned $7.3bn on $8.8bn, an 83.7% margin, up from 77.2%, with a 94% gross margin (Form 10-Q; Q3 FY2026 call). Management's message is to "stop focusing on gross margin" and look at operating margin, which it expects to sustain as the mix dilutes gross margin.
What is happening in Broadcom's VMware software business?
Broadcom's infrastructure software segment, built mainly on VMware, grew revenue 29% year on year to $8.75bn in Q3 FY2026, and annual recurring revenue grew 15% (Q3 FY2026 call). Management expects software revenue to stabilise at about $8.7bn in Q4, up 25% on a year earlier.
The product focus is VMware Cloud Foundation (VCF), a private-cloud platform, and VMware Private AI Cloud, which bundles AI infrastructure, security, compliance and agent tools for enterprises that want to run AI on their own hardware. Broadcom pitches VCF as a way to move workloads back from public cloud to private data centres. Software matters to the valuation because it is a high-margin annuity: at about $35bn a year on the Q4 run rate it adds stable cash flow to a chip business whose revenue depends on a handful of buyers.
Broadcom cash flow, capex and balance sheet
Broadcom generated a record $13.7bn of free cash flow in Q3 FY2026, 46% of revenue, from $14.2bn of operating cash flow less $532m of capex (8-K Ex 99.1). In the first three quarters of fiscal 2026, operating cash flow was $33.0bn and free cash flow $31.9bn, against $19.8bn of operating cash flow a year earlier.
Working capital absorbed cash as the AI ramp accelerated. Trade receivables rose to $13.7bn at 2 August from $7.1bn at the start of the fiscal year, and inventory doubled to $4.5bn (Form 10-Q). Capex remains small relative to revenue but is rising: Broadcom guided $1.4bn for Q4 as it invests in semiconductor capacity, including a substrate factory in Singapore that starts in fiscal 2027 and its laser plants.
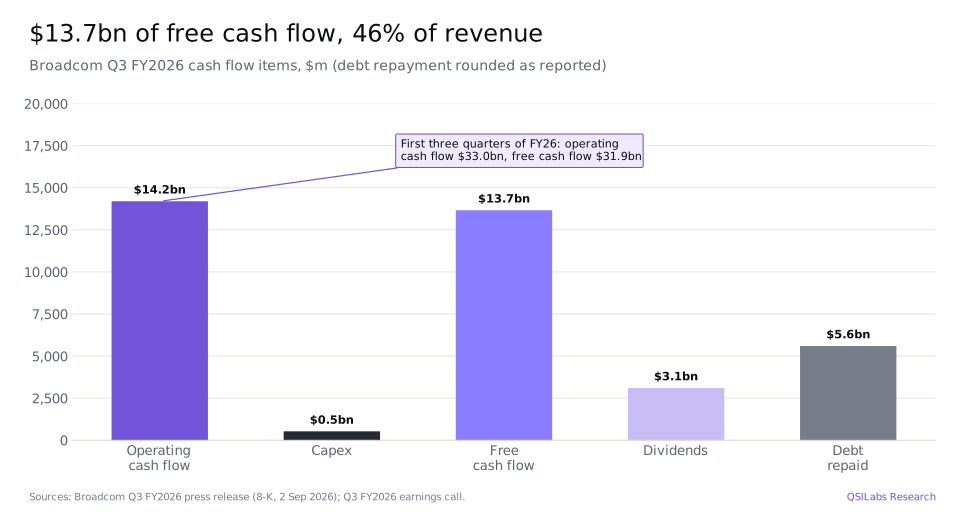
Capital returns and debt reduction both continued. Broadcom paid $3.1bn of dividends in Q3, based on a quarterly dividend of $0.65 a share, repaid $5.6bn of long-term debt, and repaid another $1.5bn of senior notes after the quarter ended (Q3 FY2026 call). Year to date it has paid $9.3bn of dividends and bought back $8.5bn of stock (Form 10-Q).
The balance sheet is still shaped by the VMware acquisition. At 2 August 2026 Broadcom had $24.0bn of cash and $59.4bn of debt, or $35.4bn of net debt, against $188.1bn of total assets, $97.8bn of goodwill, $26.3bn of intangibles and $99.7bn of equity (Form 10-Q). Gross fixed-rate debt of $59.6bn carries a weighted average coupon of 4% and 7.4 years to maturity.
What are Broadcom's AI commitments and backstop guarantees?
Broadcom has three large forward commitments that do not appear in revenue yet: $179.2bn of remaining performance obligations, $126.8bn of purchase commitments and two residual value backstops on AI-rack leases (Form 10-Q; Form 8-K, 27 October 2026).
- Contracted revenue. Remaining performance obligations, firmly committed amounts under non-cancellable contracts, were about $179.2bn at 2 August 2026, including a long-term custom accelerator contract signed in the quarter to 3 May 2026. Broadcom expects about 25% of this to be recognised as revenue over the next 12 months.
- Purchase commitments. Unconditional purchase commitments, mainly inventory, were $126.8bn, of which $52.7bn falls in fiscal 2027 and $73.0bn in fiscal 2028.
- The XPV platform. In June 2026 Broadcom launched the AI XPV platform with Apollo and Blackstone to enable more than 20 GW of compute for OpenAI and Anthropic by the end of 2028 (Q3 FY2026 call). Financial partners buy the AI racks and lease them to the customer; the first $35bn tranche funds Anthropic's 1 GW deployment.
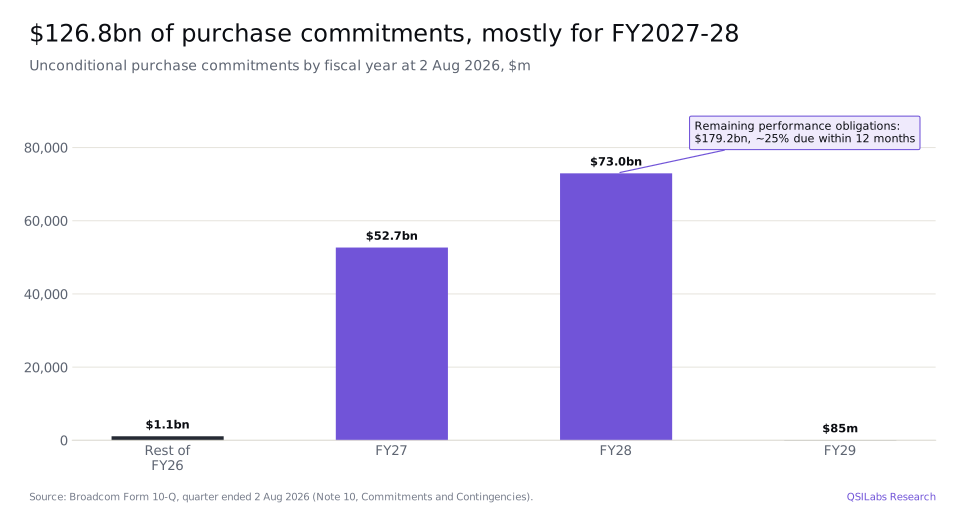
The backstops are the part to watch. Under the first, Broadcom covers any difference between 85% of the amount owed on the lease and the value of the racks if the customer defaults; its maximum undiscounted exposure is about $29bn and the fair value of the guarantee was not material (Form 10-Q). On 26 October 2026 Broadcom provided residual value support to a second, newly formed vehicle, with a 72.5% threshold and maximum undiscounted exposure of about $43bn (Form 8-K). Taken together that is about $72bn of potential exposure on our sum, roughly twice Broadcom's net debt. Broadcom calls both contingent liabilities with a low probability of occurring, and its remedies include taking over the lease or selling the racks back to the seller at a fixed price.
Broadcom outlook: Q4 FY2026 guidance and fiscal 2027-2028
Broadcom's outlook is for Q4 FY2026 revenue of $34.8bn, up 93% year on year, and for AI revenue to roughly double in each of fiscal 2027 and 2028 (Q3 FY2026 call). Q4 guidance, as given by the chief financial officer:
- Revenue. $34.8bn, including semiconductor solutions of about $26.1bn (up 136%), of which AI $21.7bn and non-AI about $4.3bn, and infrastructure software of about $8.7bn (up 25%).
- Margins. Non-GAAP gross margin about 73% and operating margin about 66%.
- Other items. A non-GAAP tax rate of about 16% for Q4 and fiscal 2026, about 4.94bn diluted shares and $1.4bn of capex.
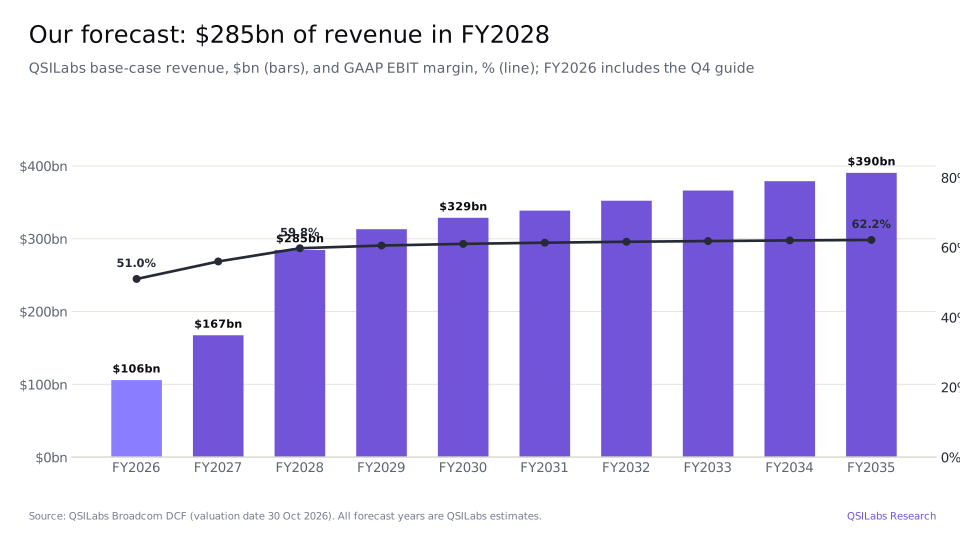
If Q4 lands on the guide, fiscal 2026 revenue would be about $105.9bn, against about $63.9bn in fiscal 2025 (our arithmetic: the first three quarters of each year from the 10-Q, plus the Q4 guide and the Q4 FY2025 base implied by its 93% growth rate). For fiscal 2027 our own build, a QSILabs estimate, adds about $115bn of AI revenue to roughly $17.6bn of non-AI semiconductors and $34.8bn of software, both at their Q4 run rates, for about $167.4bn, up 58%. For fiscal 2028 the same approach gives about $285bn.
Is Broadcom stock overvalued after Q3 2026? Our valuation
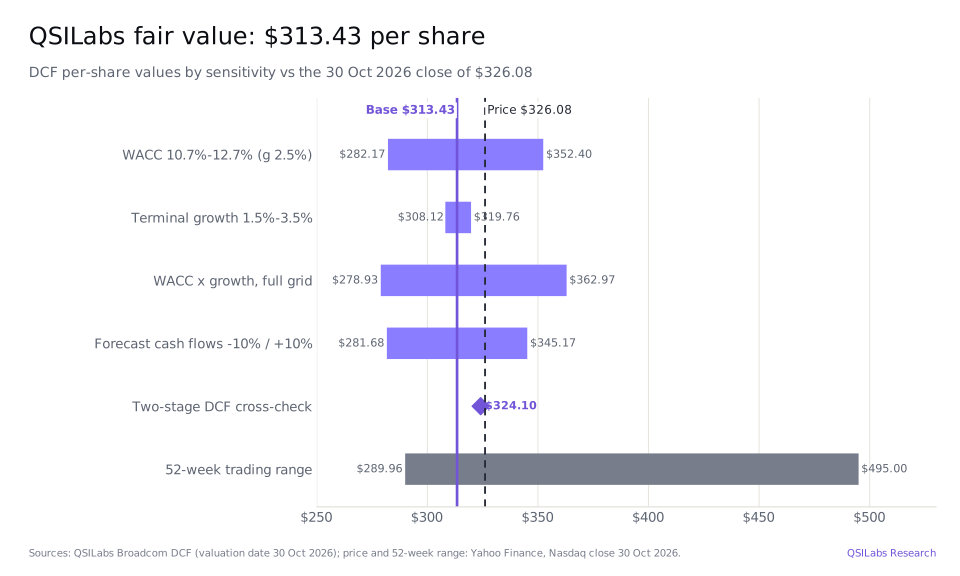
Our fair value for Broadcom stock is $313.43 a share, about 4% below the 30 October close of $326.08. That makes the shares slightly overvalued on our numbers, essentially priced for the outlook management has given. The gap is not about the next two years, where we use management's AI revenue outlook in full. It is about what comes after fiscal 2028, and whether $230bn of AI revenue is a base or a peak.
The market price implies either a discount rate of about 11.4% on our forecasts, or cash flows about 4% higher than ours in every year (QSILabs estimates). A two-stage version of the model, which fades growth gradually to the terminal rate over ten further years, gives $324.10, almost exactly the share price.
Method
We value Broadcom (AVGO) at $313.43 a share with a ten-year discounted cash flow model covering fiscal 2026 to fiscal 2035, valued at 30 October 2026.
- Revenue. Fiscal 2026 is the reported first three quarters plus the $34.8bn Q4 guide, about $105.9bn. Fiscal 2027 grows 58% to about $167.4bn and fiscal 2028 70% to about $284.7bn, built from management's AI outlook plus non-AI semiconductors and software. We then model 10% growth in fiscal 2029, 5% in fiscal 2030, 3% in fiscal 2031 as a digestion year, and 3-4% a year to about $390bn in fiscal 2035.
- Margins. The fiscal 2027 GAAP operating margin is 56%, reflecting the guided 66% non-GAAP margin less stock-based compensation and amortisation. It rises to about 60% in fiscal 2028 and 62% by fiscal 2035 as amortisation falls away.
- Cash flow. Tax at the guided 16%, and capex rising from $2.4bn in fiscal 2026 and $5.0bn in fiscal 2027 to about 10% of revenue by fiscal 2035.
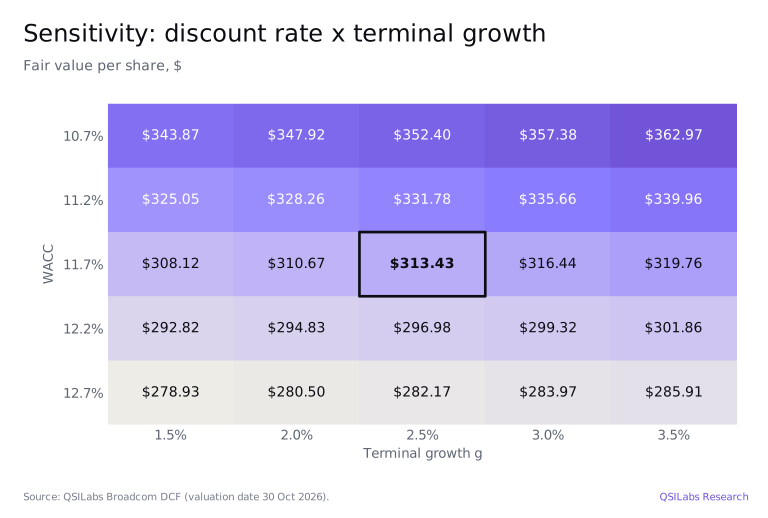
- Discount rate. A WACC of 11.7%, using a 5.12% risk-free rate, and terminal growth of 2.5%. The terminal value is 47% of enterprise value.
- From enterprise value to equity. Enterprise value is $1.55tn. Cash of $24.0bn, less debt of $59.4bn, plus an estimated $15.6bn of cash generated between 2 August and the 30 October valuation date, takes equity value to $1.53tn, or $313.43 across 4,895m diluted shares. The backstops are contingent and are not deducted.
Broadcom stock risks
The main risks to Broadcom (AVGO) stock are its dependence on a few AI customers, the financing behind their build-outs, and execution on supply.
- Customer concentration. Its top five end customers were about 55% of revenue in Q3, and two AI labs, Anthropic and OpenAI, are expected to be its largest XPU buyers in 2027 and 2028 (Form 10-Q; Q3 FY2026 call).
- Customer financing. About $72bn of maximum backstop exposure ties Broadcom to the ability of its customers to meet lease payments. Broadcom calls the risk low, citing the labs' profitability trajectory, but future XPV tranches may carry different terms.
- Deployment timing. Land, power and data centre shells set the pace of deployment, and management says it has already discounted its outlook for this. A delay could push revenue into later years, and our valuation assumes it arrives on time.
- Supply. Leading-edge wafers, substrates and high-bandwidth memory are all tight. Broadcom has secured supply for its outlook, but $126.8bn of purchase commitments would weigh on cash flow if demand fell short.
- Gross margin dilution. Memory-heavy XPUs push gross margin down, and the outlook depends on operating costs continuing to grow far more slowly than revenue.
- Competition. NVIDIA and other custom-chip designers, including MediaTek on part of Google's TPU line, compete for the same budgets.
- After 2028. Our model assumes growth slows sharply after fiscal 2028; a digestion cycle deeper than our 3% year would cut fair value.
FAQ
What is Broadcom's fair value after Q3 2026?
The QSILabs fair value for Broadcom (AVGO) is $313.43 per share as of Q3 2026, about 4% below the $326.08 close on 30 October 2026. It comes from a ten-year discounted cash flow model; on single assumptions the range is about $279 to $363, and a two-stage version of the model gives $324.10.
Is Broadcom stock overvalued or undervalued right now?
On QSILabs estimates Broadcom (AVGO) stock is slightly overvalued, trading about 4% above our $313.43 fair value at the 30 October 2026 close of $326.08. The shares would be fairly valued at a discount rate of about 11.4%, or with cash flows about 4% above our forecasts.
How did Broadcom do in its latest earnings report?
Broadcom reported record revenue of $29.6bn for Q3 FY2026, the quarter to 2 August 2026, up 86% year on year. AI semiconductor revenue was $16.7bn, up 221%, and GAAP net income was $13.1bn, or $2.68 per diluted share against $0.85 a year earlier (8-K Ex 99.1).
When does Broadcom report its next earnings?
Broadcom plans to report Q4 and full-year fiscal 2026 results, covering the quarter to 1 November 2026, after the market closes on Wednesday 9 December 2026, with a call at 2:00 pm Pacific time (Q3 FY2026 call).
How much AI revenue does Broadcom expect in 2027 and 2028?
Broadcom expects AI semiconductor revenue of about $115bn in fiscal 2027 and about $230bn in fiscal 2028, after about $58bn in fiscal 2026. Management says it has secured the supply for both years and that demand for fiscal 2027 exceeds the outlook (Q3 FY2026 call).
What are Broadcom XPUs and who uses them?
XPUs are custom AI accelerators that Broadcom co-designs with individual customers for their own models. Broadcom has six XPU customers; the four it names are Google (TPU), Anthropic (which uses Google's TPU designs), OpenAI (Jalapeño) and Meta Platforms (MTIA), and XPUs were 73% of its AI revenue in Q3 FY2026 (Q3 FY2026 call).
Why is Broadcom's gross margin going down?
Broadcom's gross margin is going down because custom AI accelerators, which include a lot of high-bandwidth memory, are a growing share of revenue. Non-GAAP gross margin is guided to about 73% in Q4 FY2026, against 78% a year earlier, while operating margin is guided flat at about 66% (Q3 FY2026 call).
What is Broadcom's AI rack backstop?
Broadcom's backstop is a residual value guarantee to financing vehicles that buy AI racks and lease them to a Broadcom customer. If the customer defaults, Broadcom pays the gap between a set share of the lease (85% or 72.5%) and the value of the racks; maximum undiscounted exposure is about $29bn and $43bn for the two arrangements (Form 10-Q; Form 8-K, 27 October 2026).
Sources
- Broadcom, Q3 FY2026 financial results press release (Form 8-K, Exhibit 99.1, 2 Sep 2026)
- Broadcom, Form 10-Q for the quarter ended 2 Aug 2026
- Broadcom, Form 8-K: residual value support for AI-rack lease agreements (event 26 Oct 2026, filed 27 Oct 2026)
- Broadcom Q3 FY2026 earnings call transcript (2 Sep 2026)
- Broadcom Investor Relations
- Yahoo Finance: AVGO price history and 30 Oct 2026 close
- QSILabs Broadcom discounted cash flow model (internal, valuation date 30 Oct 2026)
Disclaimer
This article is for information only and is not investment advice. Forecasts and fair values are QSILabs estimates and may be wrong. Company names and trademarks belong to their owners and are used solely for identification. Such use does not imply any affiliation with, sponsorship by, or endorsement of, QSI Labs. For more of our work, see the QSI Labs research hub.
More from QSI Labs
Read our white paper, QSI Labs: An AI-Native Trading Firm Built on a Training Loop (October 2026), available on request, or browse the research index.