Research / Earnings and valuation
ADP Stock Q3 2026:Revenue Up 6% and Margin Up 1.3 Points as Guidance Rises
As of: Figures are as of ADP's results for the quarter ended 30 September 2026: the earnings release of 28 October 2026 (Form 8-K, Exhibit 99) and the Form 10-Q for the quarter ended 30 September 2026, filed on 30 October 2026. ADP's fiscal year ends on 30 June, so the July to September 2026 quarter, calendar Q3 2026, is the first quarter of its fiscal 2027. The share price used in our valuation is the Nasdaq close of ADP on 2 November 2026, $298.78. Analyst data were accessed on 2 November 2026. Published 2 November 2026.
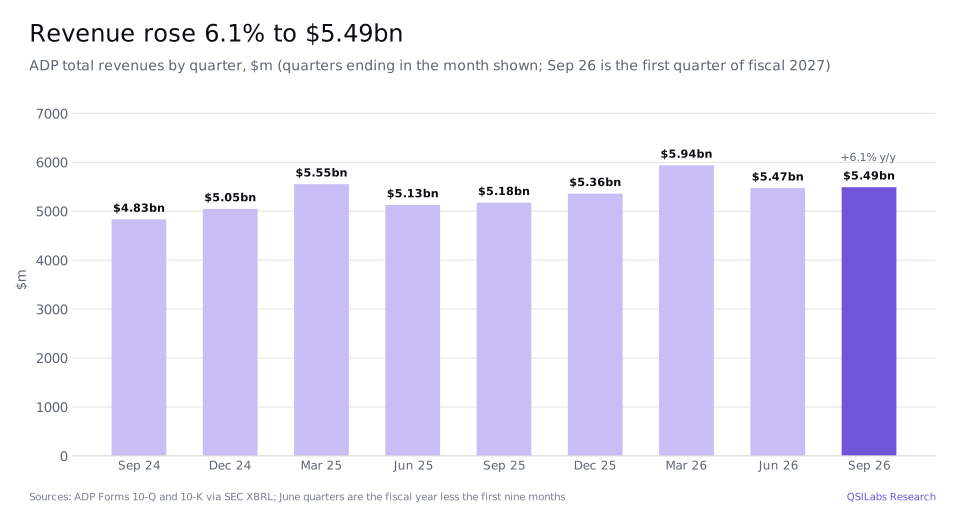
The short answer. ADP stock Q3 2026 is a story of steady growth with a wider margin. Automatic Data Processing (Nasdaq: ADP) reported revenue of $5,491m for the three months to 30 September 2026, the first quarter of its fiscal 2027, up 6.1%. Its adjusted EBIT margin rose 1.3 points to 26.8%, net earnings rose 11.1% to $1,125m and adjusted earnings per share 13% to $2.82. ADP raised its fiscal 2027 guidance to revenue growth of about 6% and adjusted earnings per share growth of 10% to 12%. The shares fell 2.6% on results day but closed at $298.78 on 2 November 2026, up 16.2% for the year. Our discounted cash flow model values the shares at $208.93, about 0.70 times the price; the gap comes from an 8.97% cost of capital and growth that slows from 6% to 2.5% over ten years, against a share price of about 24 times this year's expected earnings.
Key takeaways
- Revenue grew 6.1%. Revenue was $5,491m, up from $5,175m, and 6% on an organic constant-currency basis. Employer Services revenue rose 5.6% to $3,685m and PEO Services revenue 7.1% to $1,808m.
- Profit grew about twice as fast as revenue. Earnings before income taxes rose 11.3% to $1,455m and adjusted EBIT 11.5% to $1,470m. The Employer Services segment margin rose to 36.5% from 35.2%.
- Client money earned more. Interest on funds held for clients rose 15% to $329m, as average client balances rose 6% to $36.9bn and the average yield rose 0.3 points to 3.6%.
- Guidance went up. ADP now expects fiscal 2027 revenue growth of about 6%, up from 5% to 6%, and adjusted earnings per share growth of 10% to 12%, up from 9% to 11%.
- Hiring at clients is slow. US pays per control, the number of employees on ADP's payrolls at the same clients, rose 2%, and average PEO worksite employees rose 2% to about 771,000.
- Our value: $208.93 a share, against a $298.78 close on 2 November 2026. Across costs of capital from 7.97% to 9.97% and terminal growth from 1.5% to 3.5% the model gives $175.97 to $267.29. Analysts' average target is $297.93.
- What to watch. Employment growth at ADP's clients, interest rates on client funds, new business bookings, client retention and competition from software rivals using AI.
Key numbers from ADP's Q3 2026 earnings
| Measure | Sep 2026 quarter | Sep 2025 quarter | Change |
|---|---|---|---|
| Total revenues | $5,491m | $5,175m | +6.1% |
| Employer Services revenues | $3,685m | $3,491m | +5.6% |
| PEO Services revenues | $1,808m | $1,688m | +7.1% |
| Earnings before income taxes | $1,455m | $1,308m | +11.3% |
| Adjusted EBIT | $1,470m | $1,318m | +11.5% |
| Adjusted EBIT margin | 26.8% | 25.5% | +1.3 points |
| Net earnings | $1,125m | $1,013m | +11.1% |
| Diluted earnings per share | $2.83 | $2.49 | +13.7% |
| Adjusted diluted earnings per share | $2.82 | $2.49 | +13.3% |
| Average PEO worksite employees | 771,000 | 754,000 | +2.3% |
| Diluted shares | 397.6m | 406.5m | -2.2% |
Source: ADP Form 10-Q for the quarter ended 30 September 2026 and first-quarter fiscal 2027 earnings release (Form 8-K, Exhibit 99, 28 October 2026). Adjusted EBIT is net earnings before income taxes and before interest not related to client funds, excluding gains on ADP Ventures investments.
ADP Q3 2026 earnings: what happened
ADP released its results on 28 October 2026 and filed its Form 10-Q on 30 October. Its fiscal year ends on 30 June, so the July to September quarter is the first quarter of fiscal 2027. Revenue rose $316m, or 6.1%, to $5,491m, with both segments growing and interest on client funds up 15%.
Costs grew more slowly than revenue. Earnings before income taxes rose 11.3% to $1,455m, a pre-tax margin of 26.5%, up from 25.3%. The tax rate was 22.7% on both a reported and an adjusted basis, and net earnings rose 11.1% to $1,125m. Diluted shares fell 2.2% to 397.6 million because of buybacks, so diluted earnings per share rose 14% to $2.83. Leaving out a $2.9m gain on ADP Ventures investments, adjusted earnings per share were $2.82, up 13%.
Adjusted EBIT, ADP's main profit measure, rose 11.5% to $1,470m and the margin rose 1.3 points to 26.8%. ADP counts the interest it earns on client funds as part of operating profit, because holding clients' payroll and tax money before it is paid out is part of how the business makes money.
Chief executive Maria Black said: "ADP is off to a strong start in fiscal 2027 with first quarter results that reflect the resilience of our business model and the trust our clients continue to place in us." Chief financial officer Peter Hadley said the quarter "exceeded our expectations across revenue growth, adjusted EBIT margin expansion, and adjusted EPS growth".
- 12 Jun 2025Investor Day: medium-term goals of 6-7% revenue growth, 8-10% adjusted EBIT growth and 9-11% adjusted EPS growth8-K Ex 99 (Investor Day)
- 31 Dec 2025ADP ends calendar 2025 at $257.23Yahoo Finance
- 10 Apr 2026ADP closes at $188.79, its 52-week closing lowYahoo Finance
- 30 Jun 2026Fiscal 2026 ends: revenue $21,947m, up 6.7%; adjusted EPS $11.12Form 10-K; 8-K Ex 99
- 29 Jul 2026First fiscal 2027 outlook: revenue growth of 5-6% and adjusted EPS growth of 9-11%8-K Ex 99
- 11 Sep 2026ADP goes ex-dividend for its $1.70 quarterly dividend, up from $1.54 a year earlierYahoo Finance; Form 10-Q
- 22 Oct 2026ADP closes at $307.94, its 52-week closing highYahoo Finance
- 28 Oct 2026First-quarter fiscal 2027 results; revenue and EPS guidance raised; shares fall 2.6% to $285.378-K Ex 99; Yahoo Finance
- 30 Oct 2026Form 10-Q filed for the quarter ended 30 September 2026Form 10-Q
- 2 Nov 2026ADP closes at $298.78, the price used in our valuationYahoo Finance
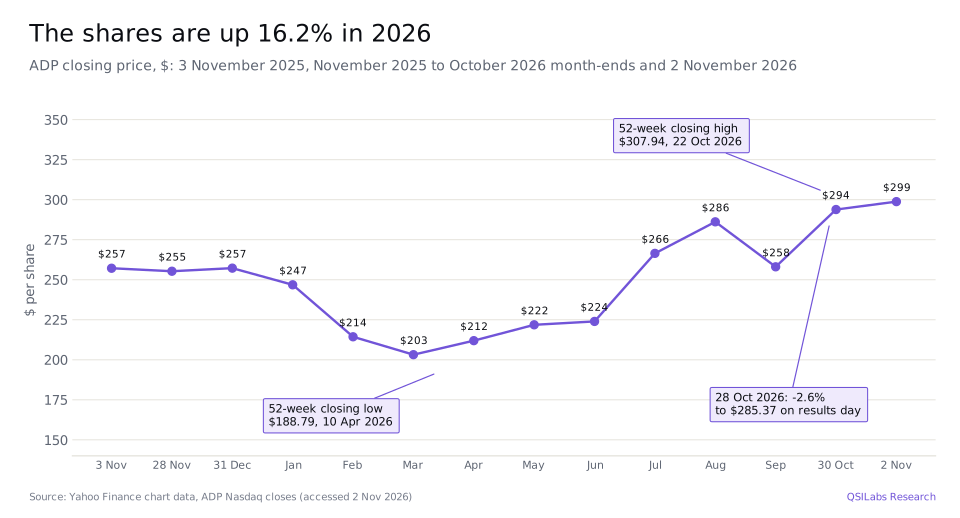
The market was less impressed. The shares fell 2.6% to $285.37 on 28 October, results day, from $293.11 the day before and from a 52-week closing high of $307.94 on 22 October. They recovered to $298.78 by 2 November, 15.8% above the 30 September close of $258.06 and up 16.2% for 2026. The 52-week closing low was $188.79 on 10 April 2026.
Which ADP business grew faster?
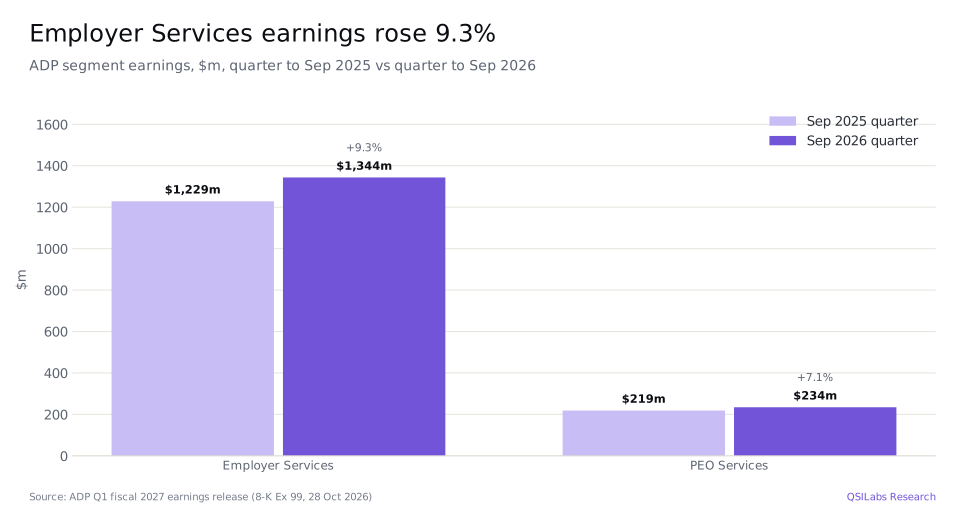
PEO Services grew faster on revenue, Employer Services on profit. Employer Services, which sells payroll, HR, benefits and workforce software and outsourcing to employers of all sizes, made $3,685m of revenue, up 5.6%, or 6% as ADP rounds it, at constant currency too. Its segment earnings rose 9.3% to $1,344m and the segment margin rose 1.3 points to 36.5%. US pays per control rose 2%.
PEO Services, ADP TotalSource, acts as co-employer of its clients' staff and handles payroll, benefits and workers' compensation for them. Its revenue rose 7.1% to $1,808m, but that includes $1,229m of benefits costs passed through to clients at no margin, up from $1,131m; excluding those pass-throughs revenue rose 4%. Segment earnings rose 7.1% to $234m and the margin was flat at 13.0%. Average worksite employees rose 2% to about 771,000.
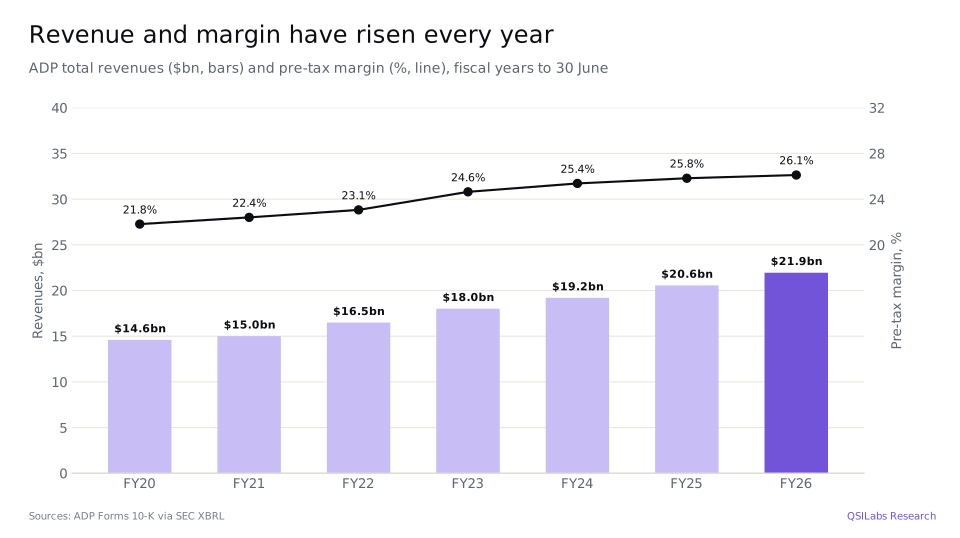
Over a longer period ADP has grown steadily and become more profitable. Revenue rose from $14.6bn in fiscal 2020 to $21.9bn in fiscal 2026, and the pre-tax margin rose every year, from 21.8% to 26.1%.
Why are client funds a growing source of profit?
Because ADP holds a lot of other people's money and is reinvesting it at higher rates. At 30 September it held $44.7bn of funds for clients against client funds obligations of $46.0bn, money collected for wages and taxes that it pays out later. Average client balances in the quarter were $36.9bn, up 6%, and the average yield was 3.6%, up 0.3 points, so interest on funds held for clients rose 15% to $329m.
ADP raised its fiscal 2027 forecast for this income to $1.59bn to $1.61bn, from $1.54bn to $1.56bn, on balances growing 4% to 5% and a yield rising to about 3.8%. That compares with $1,355m in fiscal 2026. Bonds bought years ago at lower yields are maturing and being replaced at higher ones; ADP's 2025 Investor Day showed about $13bn of the portfolio maturing in fiscal 2026 and 2027.
What did ADP change in its fiscal 2027 guidance?
ADP raised its revenue growth outlook to about 6%, from 5% to 6%, and its adjusted earnings per share growth outlook to 10% to 12%, from 9% to 11%. On fiscal 2026 adjusted earnings per share of $11.12, that implies $12.23 to $12.45; the S&P Global consensus compiled by StockAnalysis is $12.37. The adjusted EBIT margin is still expected to rise 0.7 to 0.9 points from 26.8%, and the adjusted tax rate to be about 23%.
For Employer Services ADP now expects revenue growth of about 6%, new business bookings growth of 4% to 7%, client revenue retention 0.1 to 0.3 points lower than fiscal 2026's 92.1%, and US pays per control growth of about 1%. For PEO Services it expects revenue growth of 5% to 7% and worksite employee growth of about 2%.
How much cash is ADP returning to shareholders?
More than it earned in the quarter. ADP spent $759m buying back 2.9 million shares and paid $677m of dividends, against operating cash flow of $651m, and cash fell to $3,277m from $4,230m at 30 June. It declared a quarterly dividend of $1.70 a share, up from $1.54 a year earlier, an annual rate of $6.80, or 2.28% of the 2 November close. Long-term debt was $4,965m, almost unchanged.
ADP stock Q3 2026: is ADP overvalued?
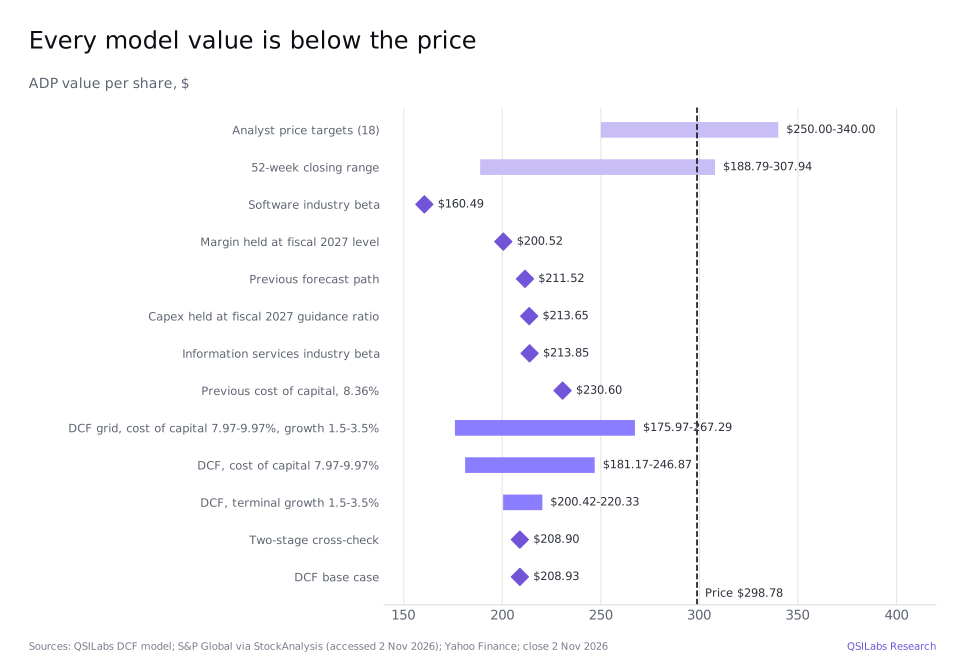
On our numbers, yes. Our model values ADP at $208.93 a share, about 0.70 times the $298.78 close on 2 November 2026.
We forecast operating profit and the cash ADP's businesses generate after tax and investment, and discount it at the weighted average cost of capital. That gives unlevered free cash flow of $4.89bn in fiscal 2027, $5.88bn in fiscal 2030 and $6.71bn in fiscal 2036 and an enterprise value of $84.8bn. To reach equity value we add cash of $3.28bn and deduct long-term debt of $4.97bn and the $0.67bn dividend declared and still payable at 30 September, and we add $0.43bn of cash generated between 30 September and 2 November net of interest. That gives an equity value of $82.9bn, or $208.93 a share on 396.7 million shares. We leave out the client funds portfolio and the borrowings that support it, because the interest on that money is already in operating profit.
The cost of capital is 8.97%. The cost of equity is 9.15%: a risk-free rate of 5.12% plus a beta of 0.887 times an equity risk premium of 4.54%. The beta is the global unlevered beta for business and consumer services companies, 0.860, relevered at ADP's debt-to-equity ratio of 0.042. The risk premium weights country premiums by where ADP bills its revenue: 87.8% in the United States, 7.9% in Europe, the Middle East and Africa, 2.4% in Canada and 1.9% elsewhere. Debt is only 4.0% of capital, at an after-tax cost of 4.68%. After fiscal 2036 we assume growth of 2.5% a year; that terminal value is 54.0% of enterprise value.
Plainly, the market expects more than our model does. At $298.78, ADP trades at about 24 times consensus fiscal 2027 adjusted earnings per share of $12.37, and our fiscal 2028 free cash flow of $5.28bn is about 4.4% of its enterprise value of about $120bn at market prices. With growth slowing from 6% to 2.5% over ten years and an 8.97% cost of capital, even the most generous corner of our grid, a 7.97% cost of capital with 3.5% terminal growth, gives $267.29. The price implies a lower cost of capital than our grid allows, or growth near 6% lasting well beyond fiscal 2029.
ADP's own five-year beta is 0.84, according to StockAnalysis, a little below the 0.887 we use. Damodaran places ADP in business and consumer services, which we use. With the information services beta instead the model gives $213.85, and with the software beta, 1.30 unlevered and a 10.94% cost of capital, $160.49; ADP sells software, but its outsourcing and client funds income behave more like a business service.
Our forecast for ADP
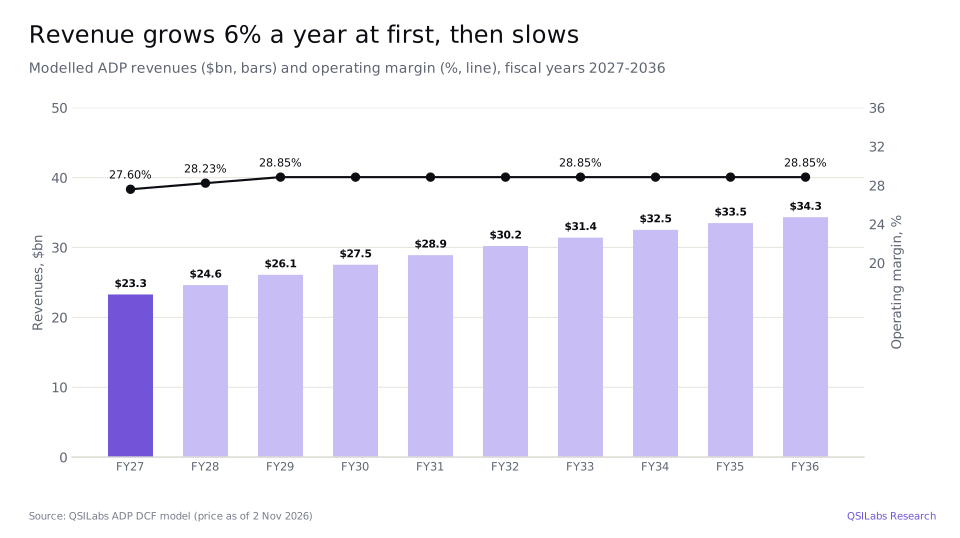
ADP's fiscal year ends on 30 June. For fiscal 2027 we take S&P Global's consensus revenue of $23.28bn, growth of 6.07%, in line with ADP's raised guidance of about 6%; after the first quarter, that leaves $17.79bn for the last three. For fiscal 2028 consensus is $24.62bn, growth of 5.76%. For fiscal 2029 we use 6.0%, the bottom of ADP's medium-term objective of 6% to 7% revenue growth, set at its June 2025 Investor Day. Growth then slows in a straight line to 2.5% in fiscal 2036, giving revenue of $34.3bn.
That growth is consistent with ADP's market. ADP puts its addressable human capital management market at $180bn, using fiscal 2024 data, and expects it to grow at mid-single digits over the medium term. At 5% a year that market would be about $323bn by fiscal 2036, and our revenue forecast would be about 10.6% of it, close to the 10.7% that ADP's $19.2bn of fiscal 2024 revenue was of $180bn. The narrower HR payroll software market, as estimated by The Business Research Company, grows faster, by 10% a year to $62.64bn in 2030.
Operating profit is ADP's earnings before income taxes and before interest not related to client funds. For fiscal 2027 we use a margin of 27.6%: the fiscal 2026 adjusted EBIT margin of 26.8% plus 0.8 points, the middle of ADP's guidance, which gives $6.43bn, close to consensus operating income of $6.42bn. We then add 0.625 points a year, the middle of the 0.5 to 0.75 points a year in ADP's medium-term objectives, to reach 28.85% in fiscal 2029, and hold it there. Tax is 23.0%, ADP's guided adjusted rate.
Depreciation and amortization is 2.67% of revenue, its level over the twelve months to September 2026. Capital spending in fiscal 2027 is $709m: the middle of ADP's $200m to $225m capital expenditure guidance plus software and other intangibles at their fiscal 2026 level of 2.13% of revenue. That is 3.05% of revenue, and we use the same ratio for fiscal 2028. After that our house method raises it each year to a long-run level of 5.38% of revenue in fiscal 2036, well above the 2.7% to 3.0% ADP spent from fiscal 2024 to 2026. Held at 3.05% through fiscal 2036, the model gives $213.65.
Our previous model, priced at the 28 October close of $285.37, gave $233.97. It used Damodaran's US cost of capital for business and consumer services, 8.36%, revenue growth of 6% a year fading to 3% without a cited source, and a margin rising to 28.73%. At that 8.36% cost of capital today's model gives $230.60, so most of the change comes from the cost of capital. On the old growth and margin path, today's model gives $211.52, so the sourced forecast lowers the value by $2.59. Holding the margin at its fiscal 2027 level of 27.6% gives $200.52.
How the number moves if you argue with us
The table shows our value per share at different costs of capital and terminal growth rates. At a 7.97% cost of capital and 3.5% terminal growth, the corner of the grid, the model gives $267.29, still below the share price.
| Cost of capital | Growth 1.5% | Growth 2.0% | Growth 2.5% | Growth 3.0% | Growth 3.5% |
|---|---|---|---|---|---|
| 7.97% | $232.56 | $239.14 | $246.87 | $256.08 | $267.29 |
| 8.47% | $215.32 | $220.41 | $226.30 | $233.22 | $241.46 |
| 8.97% | $200.42 | $204.39 | $208.93 | $214.18 | $220.33 |
| 9.47% | $187.41 | $190.53 | $194.05 | $198.07 | $202.72 |
| 9.97% | $175.97 | $178.42 | $181.17 | $184.27 | $187.81 |
A simpler two-stage cross-check in the same workbook gives $208.90.
Risks to the ADP investment case
- Employment. ADP is paid per employee on many products. US pays per control grew 2% in the quarter and ADP expects about 1% for the year; job losses at clients would slow revenue.
- Interest rates. Interest on client funds is expected to be $1.59bn to $1.61bn in fiscal 2027. Lower rates would reduce it over time as bonds mature.
- Retention and competition. ADP expects client revenue retention to fall 0.1 to 0.3 points from 92.1%, and software rivals and AI tools compete for payroll and HR work.
- PEO costs. PEO revenue includes benefits costs passed through at no margin; rising health and workers' compensation costs can squeeze the segment margin.
- Client fund values. Funds held for clients were $1.3bn below client funds obligations at 30 September, mainly because of unrealized bond losses; we do not deduct this gap.
- Valuation risk. Our value relies on an 8.97% cost of capital and growth slowing to 2.5%. The market price implies faster growth for longer or a lower cost of capital.
FAQ
What value does QSILabs put on ADP stock?
Our discounted cash flow model gives $208.93 a share, against a $298.78 close on 2 November 2026. Across costs of capital from 7.97% to 9.97% and terminal growth from 1.5% to 3.5% the value ranges from $175.97 to $267.29. A two-stage cross-check gives $208.90.
Should I buy ADP stock after the Q3 2026 results?
We do not give personal advice. ADP grew revenue 6.1% and adjusted earnings per share 13% and raised its guidance, but employment growth at its clients is slow. On our numbers the shares trade above the value of their cash flows, at about 24 times this year's expected earnings. Read the sensitivity table and the risks above before deciding.
How much did ADP earn in the quarter to September 2026?
ADP reported net earnings of $1,125m for the three months to 30 September 2026, up 11.1% from $1,013m, on revenue of $5,491m. Diluted earnings per share were $2.83 and adjusted earnings per share $2.82.
Why is ADP's Q3 2026 its first quarter of fiscal 2027?
ADP's fiscal year runs from 1 July to 30 June. The July to September 2026 quarter, the third calendar quarter, is therefore the first quarter of fiscal 2027, which ends on 30 June 2027.
What is ADP's earnings guidance for fiscal 2027?
ADP expects adjusted diluted earnings per share to grow 10% to 12% from $11.12 in fiscal 2026, revenue to grow about 6% and the adjusted EBIT margin to rise 0.7 to 0.9 points. It raised the revenue and earnings ranges with its results on 28 October 2026.
How much interest does ADP earn on client money?
Interest on funds held for clients was $329m in the quarter to September 2026, up 15%, on average balances of $36.9bn at a 3.6% yield. ADP expects $1.59bn to $1.61bn for fiscal 2027.
How much is ADP's dividend?
ADP pays $1.70 a share each quarter, $6.80 a year, up from $1.54 a quarter a year earlier. That is a yield of about 2.28% on the $298.78 close on 2 November 2026.
What price target do analysts have for ADP?
The 18 analysts compiled by StockAnalysis have an average target of $297.93, about the $298.78 close on 2 November 2026, with a low of $250 and a high of $340. Their consensus rating is Hold.
How much debt does ADP have?
ADP had $4,965m of long-term debt and $3,277m of cash at 30 September 2026. It also had $198m of short-term reverse repurchase borrowings that fund client payments, which are separate from its corporate debt.
What is a PEO and how big is ADP's?
A professional employer organization becomes co-employer of a client's staff and runs their payroll, benefits and workers' compensation. ADP's PEO, ADP TotalSource, paid an average of about 771,000 worksite employees in the quarter to September 2026 and had revenue of $1,808m.
Who runs ADP?
Maria Black is ADP's president and chief executive officer and Peter Hadley its chief financial officer, according to its first-quarter fiscal 2027 earnings release.
Sources
- Automatic Data Processing, Inc., Form 10-Q for the quarter ended 30 Sep 2026 (filed 30 Oct 2026; accession 0000008670-26-000044) www.sec.gov
- Automatic Data Processing, Inc., first quarter fiscal 2027 results (Form 8-K, Exhibit 99, 28 Oct 2026; accession 0000008670-26-000033) www.sec.gov
- Automatic Data Processing, Inc., Form 10-K for the year ended 30 Jun 2026 (accession 0000008670-26-000030) www.sec.gov
- Automatic Data Processing, Inc., Investor Day presentation, 12 Jun 2025 (Form 8-K, Exhibit 99; accession 0000008670-25-000023) www.sec.gov
- SEC XBRL company facts for ADP (CIK 8670): annual and quarterly revenues and earnings before income taxes data.sec.gov
- StockAnalysis: ADP forecast and analyst ratings, S&P Global data (accessed 2 Nov 2026) stockanalysis.com
- StockAnalysis: ADP statistics (accessed 2 Nov 2026) stockanalysis.com
- The Business Research Company: HR Payroll Software Global Market Report (accessed 2 Nov 2026) www.thebusinessresearchcompany.com
- Yahoo Finance chart data: ADP closing prices and dividends (November 2025 to November 2026) query1.finance.yahoo.com
- Damodaran Online: global industry betas, cost of capital and country equity risk premiums, January 2026 pages.stern.nyu.edu
- QSILabs ADP discounted cash flow model (internal; price as of 2 Nov 2026)
Disclaimer
This article is for information only and is not investment advice, a recommendation or an offer to buy or sell any security. QSI Labs and its authors may hold positions in the securities discussed. Forecasts and valuations are estimates that depend on assumptions that may prove wrong. Figures are taken from company filings and third-party sources believed to be reliable, but we do not guarantee their accuracy. Do your own research or consult a licensed adviser before investing.
More from QSI Labs
Related analysis: S&P Global stock Q3 2026: indices and Capital IQ, Visa stock Q3 2026: cross-border and buybacks, Mastercard stock Q3 2026: services and stablecoins and ServiceNow stock Q3 2026: AI and cRPO.
Read our white paper, QSI Labs: An AI-Native Trading Firm Built on a Training Loop (October 2026), available on request, or browse the research index.