Research / Earnings and valuation
Union Pacific Stock Q3 2026:Volumes Rise 6% as Revenue Jumps 15%
As of: Figures are as of Union Pacific Corporation's third-quarter 2026 results (the quarter ended 30 September 2026, reported 22 October 2026 in a Form 8-K) and its Form 10-Q for that quarter, filed on 22 October 2026. Union Pacific's fiscal year is the calendar year, so its Q3 2026 covers July to September 2026. The share price used in our valuation is the NYSE close of UNP on 2 November 2026, $307.00; analyst data were accessed on 2 November 2026. Published 2 November 2026.
The short answer. Union Pacific stock Q3 2026 comes down to a quarter in which the railroad moved more freight and charged more for it, while fuel prices did a lot of the work on revenue. In the three months to 30 September 2026, revenue carloads rose 6% and operating revenue rose 15% to $7,197m, helped by higher fuel surcharges; operating income rose 15% to $2,943m and diluted earnings per share rose 16% to $3.49. Union Pacific called these "record financial results". The operating ratio, the railroad's measure of costs as a share of revenue, was 59.1%, and the company said higher fuel prices added 140 basis points to it. The review of the Norfolk Southern merger moved forward, with completion expected in the second half of 2027. Our discounted cash flow model gives $193.73 a share, against a $307.00 close on 2 November 2026; below we show which assumptions drive that gap and how far it moves when you change them.
Key takeaways
- Volume grew 6%, revenue 15%. Revenue carloads were 2,293,000, up 6%, and operating revenue was $7,197m, up 15% from $6,244m. Freight revenue excluding fuel surcharge rose 6%.
- Fuel lifted revenue and costs. The average fuel price was $4.21 a gallon, against $2.56 a year earlier. Fuel expense rose 69% to $1,040m, and Union Pacific said higher fuel prices hurt the operating ratio by 140 basis points.
- Union Pacific reported records. The company said freight revenue, operating revenue, operating income and net income were records, and chief executive Jim Vena described "record financial results".
- Intermodal led the growth. Intermodal freight revenue rose 27% to $1,517m on 11% more shipments. Industrial revenue rose 14% and Bulk 10%.
- The merger review advanced. The Surface Transportation Board adopted a schedule in August and denied motions to dismiss the application in September. Union Pacific expects to complete the Norfolk Southern deal in the second half of 2027 and has paused share buybacks.
- Cash flow rose 17.5% in nine months. Cash from operations was $8,302m, against $7,065m, and debt fell to $30,324m from $31,814m at the end of 2025.
- Our value: $193.73 a share, against a $307.00 close on 2 November 2026. A two-stage cross-check gives $187.62 and a scenario with a single global railroad beta gives $244.93; analysts' average target is $331.38.
- What to watch. Fuel prices and surcharges, whether volume growth holds into 2027, service levels, the capital plan for 2027 and each step of the merger review.
Key numbers from Union Pacific's Q3 2026 earnings
| Measure | Q3 2026 | Q3 2025 | Change |
|---|---|---|---|
| Operating revenue | $7,197m | $6,244m | +15% |
| Freight revenue | $6,813m | $5,927m | +15% |
| Operating expenses | $4,254m | $3,695m | +15% |
| Fuel expense | $1,040m | $616m | +69% |
| Operating income | $2,943m | $2,549m | +15% |
| Operating ratio | 59.1% | 59.2% | -0.1 pts |
| Adjusted operating ratio | 58.8% | 58.5% | +0.3 pts |
| Net income | $2,076m | $1,788m | +16% |
| Diluted earnings per share | $3.49 | $3.01 | +16% |
| Adjusted diluted earnings per share | $3.53 | $3.08 | +15% |
| Revenue carloads | 2,293,000 | 2,163,000 | +6% |
| Average revenue per car | $2,971 | $2,740 | +8% |
Source: Union Pacific Q3 2026 earnings release (Form 8-K, Exhibit 99.1).
Union Pacific Q3 2026 earnings: what happened
Union Pacific reported third-quarter results on 22 October 2026. Operating revenue rose 15% to $7,197m from $6,244m: freight revenue rose 15% to $6,813m and other revenue rose 21% to $384m. For the first nine months, revenue was $20,278m, up 10%.
Operating expenses also rose 15%, to $4,254m, so operating income rose 15% to $2,943m. The operating ratio, operating expenses divided by revenue, improved by 10 basis points to 59.1%; a lower ratio means a higher margin. Excluding $22m of costs related to the Norfolk Southern acquisition, the adjusted operating ratio was 58.8%, 30 basis points worse than a year earlier; Union Pacific said higher fuel prices hurt the operating ratio by 140 basis points.
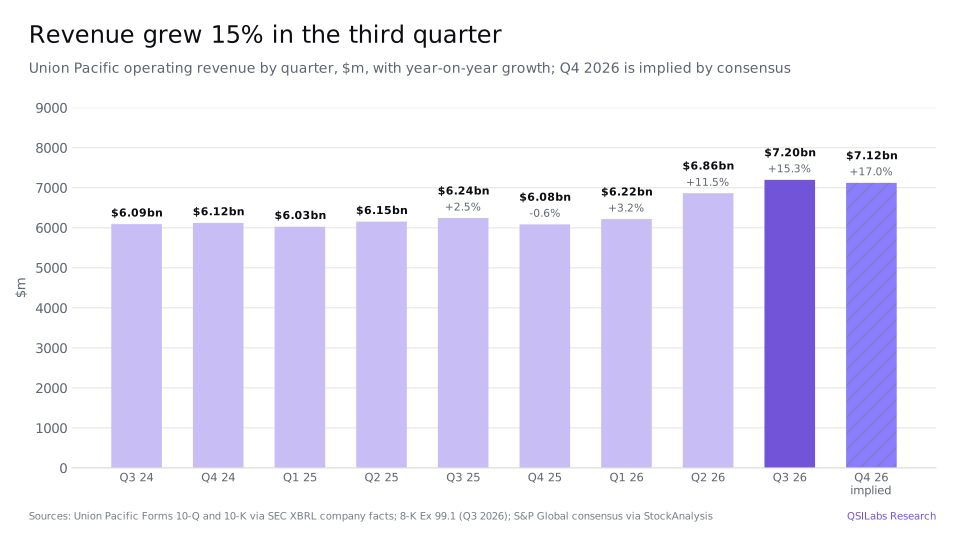
Net income rose 16% to $2,076m and diluted earnings per share rose 16% to $3.49 from $3.01, on 594.5m diluted shares. Adjusted earnings per share, which exclude acquisition-related costs, rose 15% to $3.53. Interest expense fell to $312m from $327m and the effective tax rate was 23.8%, against 22.9%. Over nine months, diluted earnings per share were $9.71, against $8.87.
"We executed at a consistently high level, enabling record financial results and further reinforcing our position as the industry leader," Vena said. Union Pacific said workforce productivity, train length and fuel consumption rate were also records. Workforce productivity, measured in car miles per employee, rose 5% to 1,219 as the average workforce fell 1% to 28,540, and average terminal dwell, the time a car spends in a rail yard, improved 2% to 19.9 hours.
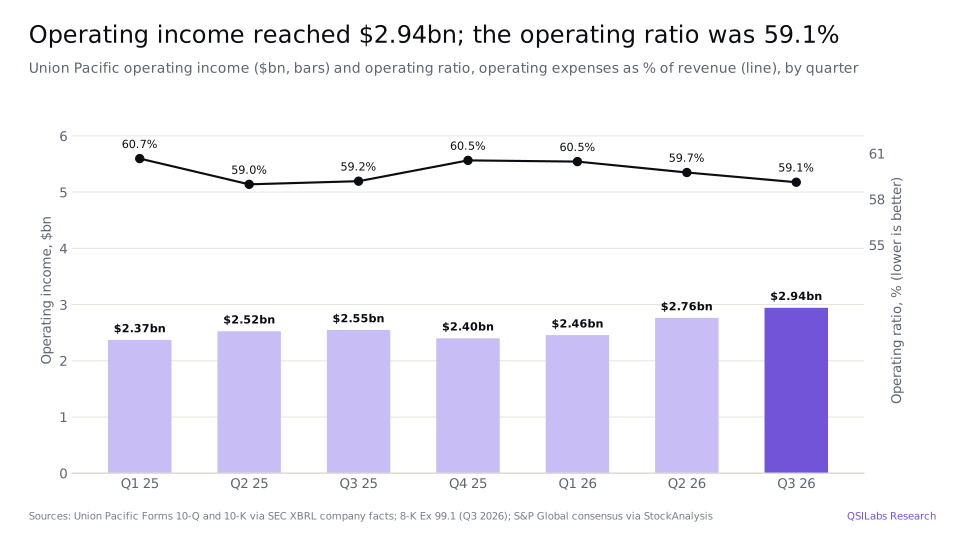
Union Pacific affirmed its 2026 outlook for reported earnings per share growth in the high single digits, "consistent with attaining 3-year CAGR target of high-single to low-double digit through 2027". It updated its capital plan to $3.5bn and said it expects operating ratio improvement from the core business, while the reported operating ratio is "challenged by high fuel prices". It described the economic forecast as mixed.
- 28 Jul 2025Merger agreement with Norfolk Southern signed: one UNP share and $88.82 in cash for each Norfolk Southern shareForm 10-Q
- 14 Nov 2025Shareholders of both companies approve the deal at special meetingsForm 10-Q
- 19 Dec 2025Joint application filed with the Surface Transportation Board (STB)Form 10-Q
- 16 Jan 2026STB decides the application is not completeForm 10-Q
- 30 Apr 2026Revised joint application filedForm 10-Q
- 28 May 2026STB accepts the revised application as complete and asks for more informationForm 10-Q
- 27 Jul 2026Responses to the STB's request completedForm 10-Q
- 18 Aug 2026STB adopts a procedural schedule and takes the case out of abeyanceForm 10-Q
- 18 Sep 2026STB denies motions to dismiss the applicationForm 10-Q
- 22 Oct 2026Q3 results: revenue up 15%, carloads up 6%; UNP closes at $298.09, up 3.6%8-K; Yahoo
- 2 Nov 2026UNP closes at $307.00, the price used in our valuationYahoo Finance
- Second half of 2027Completion of the merger expected, subject to STB approvalForm 10-Q
Why did revenue grow 15% when volume grew 6%?
Mostly because of fuel. Railroads add a fuel surcharge to their rates, so when diesel prices rise, revenue rises with them. Union Pacific paid an average of $4.21 a gallon for fuel in the third quarter, 64% more than the $2.56 of a year earlier. It said revenue growth was "driven by higher fuel surcharge, 6% volume growth, core pricing gains and increased other revenue partially offset by business mix". Freight revenue excluding fuel surcharge rose 6%, in line with volume.
The same fuel shows up in costs. Fuel expense rose 69% to $1,040m, on 240m gallons against 235m. Excluding fuel, operating expenses rose 4.4%, from $3,079m to $3,214m: compensation and benefits rose 4% to $1,264m, purchased services and materials 9% to $746m and depreciation 4% to $643m, while equipment and other rents fell 3%. The fuel consumption rate improved 2% to 1.034 gallons per thousand gross ton-miles.
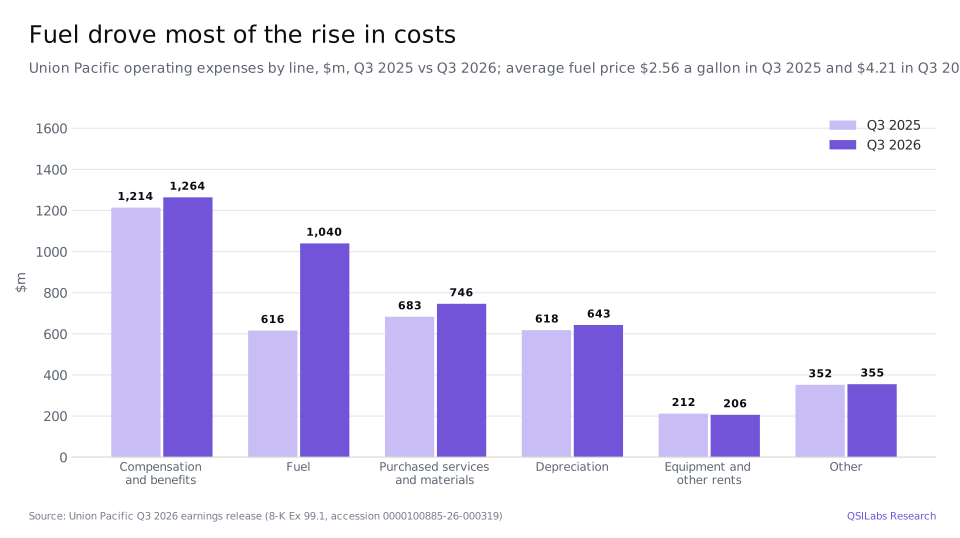
Fuel surcharges recover higher fuel costs, but they do not add margin: the surcharge dollars come in with matching costs, which raises revenue and the operating ratio at the same time. That is why Union Pacific said higher fuel prices added 140 basis points to its operating ratio, even as operating income grew 15%. If fuel prices fall, revenue growth will slow without the same effect on profit.
Average revenue per car rose 8% to $2,971. In the nine months, revenue carloads rose 3% to 6,539,000 and average revenue per car rose 7%.
Which freight businesses grew fastest?
Union Pacific reports freight in three groups. Premium, which is intermodal containers and trailers plus automotive, grew fastest: revenue rose 21% to $2,188m and carloads rose 9%. Intermodal revenue rose 27% to $1,517m on 11% more shipments, and average revenue per unit rose 14%. Automotive revenue rose 11% to $671m on 2% more carloads.
Industrial revenue rose 14% to $2,509m on 6% more carloads. Energy and specialized markets rose 18% to $771m, metals and minerals 17% to $666m, forest products 13% to $371m and industrial chemicals and plastics 8% to $701m.
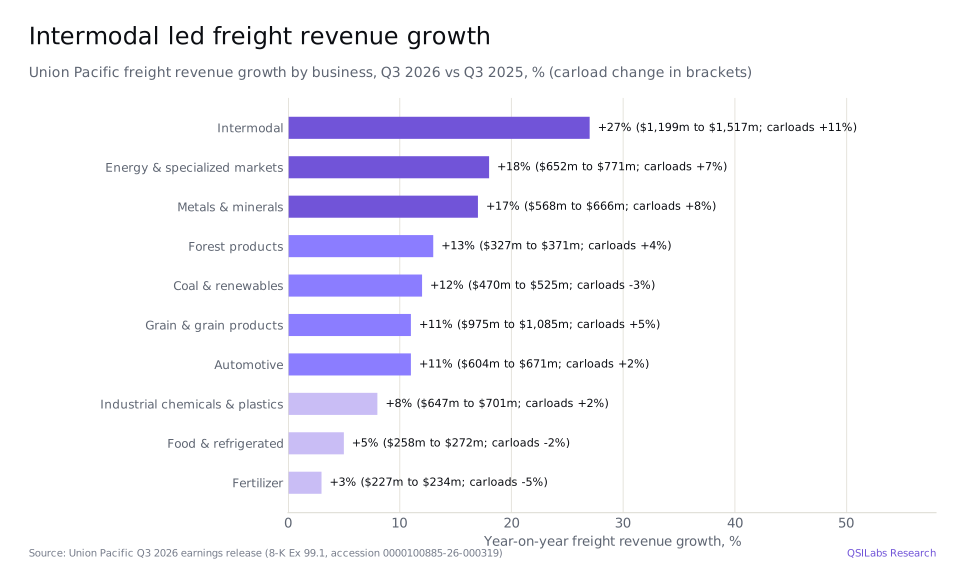
Bulk revenue rose 10% to $2,116m with carloads flat. Grain and grain products revenue rose 11% to $1,085m on 5% more carloads, and coal and renewables revenue rose 12% to $525m although carloads fell 3%; fertilizer and food and refrigerated lost carloads but grew revenue. Higher fuel surcharges lifted revenue per car in every group.
Service measures slipped as volume rose. The intermodal service performance index fell to 92% from 98% and the manifest index to 93% from 100%, although freight car velocity rose 1% to 228 miles a day.
Where does the Norfolk Southern merger stand?
Union Pacific agreed to buy Norfolk Southern on 28 July 2025. Each Norfolk Southern share would be exchanged for one Union Pacific share and $88.82 in cash; Union Pacific expects to issue about 225m shares and pay about $20bn in cash, funded with new debt and cash from operations. The combined railroad would span over 50,000 miles across 43 states, and Union Pacific calls it "America's first transcontinental railroad". Shareholders of both companies approved the deal on 14 November 2025.
The deal needs approval from the Surface Transportation Board, the US rail regulator. The board rejected the first application as incomplete in January 2026, accepted a revised one as complete on 28 May, adopted a procedural schedule on 18 August and, on 18 September, denied motions from several parties to dismiss the application. Union Pacific expects to complete the merger in the second half of 2027. Either company may have to pay the other a $2.5bn termination fee in certain circumstances.
The deal already affects the accounts. Union Pacific recorded $93m of acquisition-related expense in the first nine months of 2026 and has paused share repurchases: it spent $26m on buybacks in the nine months, against $2,679m a year earlier. Our valuation is for Union Pacific on its own; it does not include Norfolk Southern, the new shares, the cash payment or any cost savings from the combination.
How much cash does Union Pacific generate?
Cash provided by operating activities was $8,302m in the first nine months of 2026, up 17.5% from $7,065m, and capital investments were $2,834m, including $320m of early buyouts of leased locomotives and freight cars. Over the 12 months to September, cash from operations was about $10,527m and capital investments about $3,833m, a difference of about $6,694m, against $5,499m for 2025.
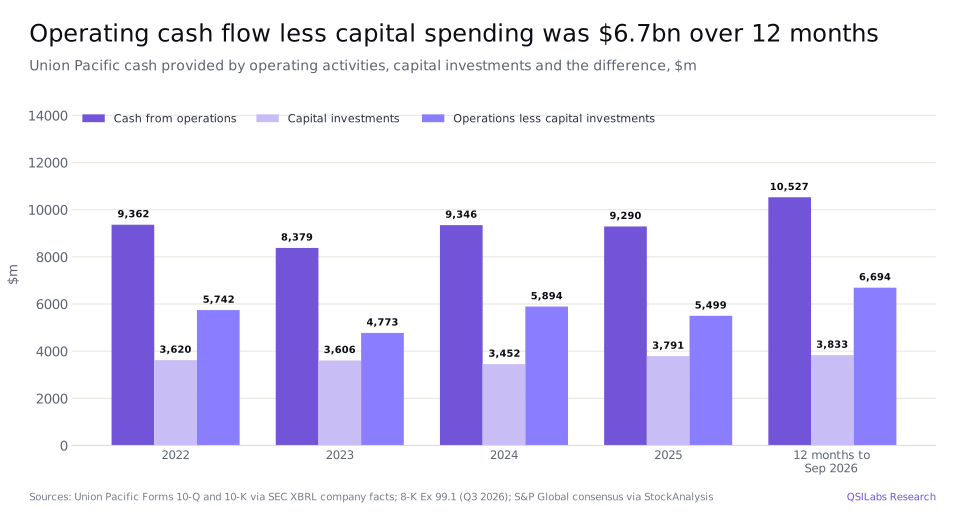
Union Pacific's own free cash flow measure also deducts dividends: it was $2,362m for the nine months, against $1,856m. Dividends paid were $2,484m, about 45% of cash from operations less capital investments. The quarterly dividend was raised 3% to $1.42 a share, or $5.68 a year, a yield of 1.85% at the 2 November close.
With buybacks paused, the cash went into the balance sheet. Union Pacific repaid $1,519m of debt and issued none, so total debt fell to $30,324m at 30 September from $31,814m at the end of 2025, while cash rose to $2,211m and short-term investments to $875m. Adjusted debt, including operating leases, was 2.4 times adjusted EBITDA over the past 12 months, down from 2.7 times at the end of 2025.
How has UNP stock performed in 2026?
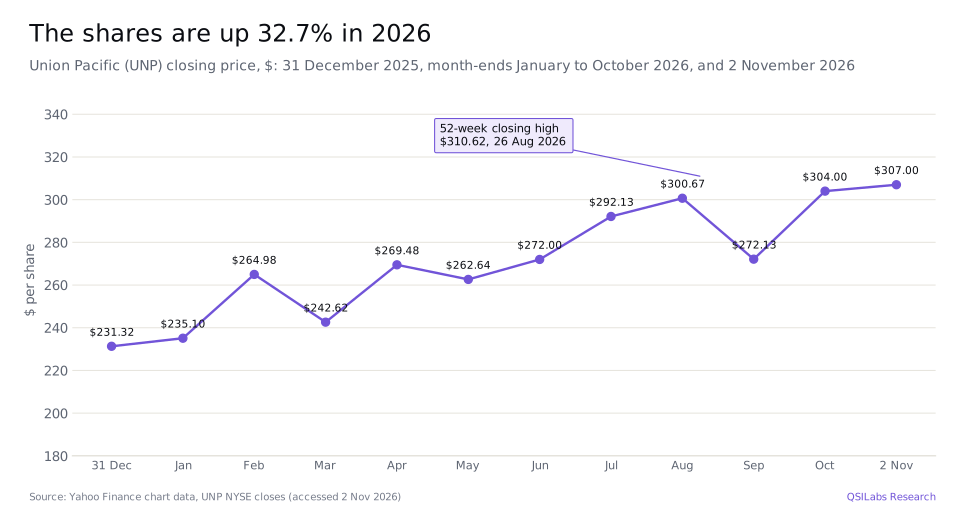
Union Pacific shares closed at $307.00 on 2 November 2026, up 32.7% from $231.32 at the end of 2025. They rose to $264.98 by the end of February, dipped to $242.62 in March and reached a 52-week closing high of $310.62 on 26 August, before falling to $272.13 at the end of September. The 52-week closing low was $217.38 on 5 November 2025.
On results day, 22 October, the shares rose 3.6% to $298.09 from $287.87, and they have risen another 3.0% since. At $307.00 the shares trade at 23.3 times S&P Global consensus earnings per share for 2026 of $13.17 and 21.3 times the $14.39 expected for 2027.
Union Pacific stock Q3 2026: is UNP overvalued?
On our numbers, the price is well above the value of the cash flows we forecast. Our discounted cash flow model gives $193.73 a share, 0.63 times the $307.00 close on 2 November 2026. At that price the equity was worth about $182.5bn, on 594.5m diluted shares, and the enterprise value, adding debt of $30.3bn and deducting $2.2bn of cash, about $210.6bn. That is 16.0 times the $13,136m of adjusted EBITDA Union Pacific reported for the past four quarters. Our enterprise value of $141.7bn is 10.8 times.
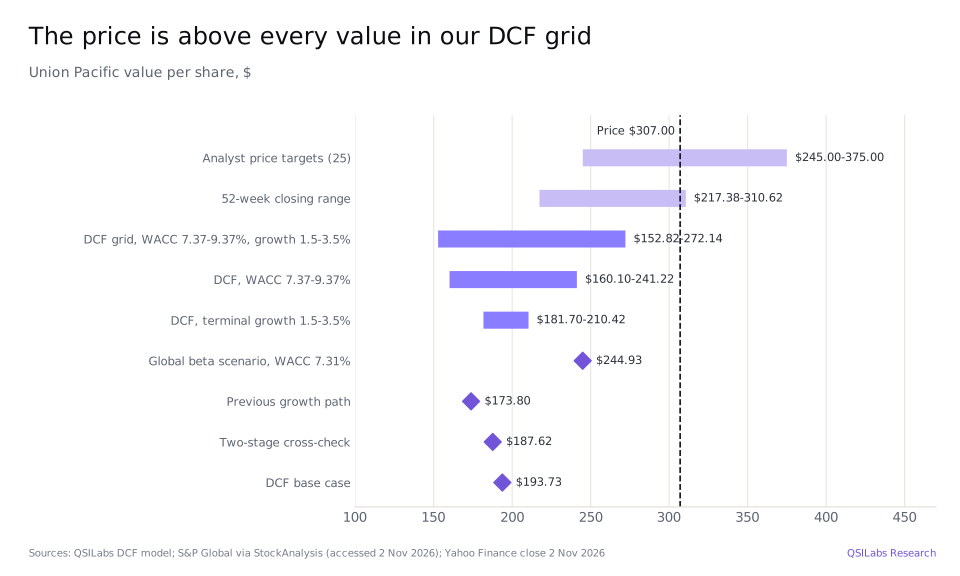
The gap comes from four assumptions: a cost of capital of 8.37%, growth that slows to 2.5% a year by 2035, a flat operating margin after 2027 and capital spending of 13% to 15% of revenue. The market is paying for more: faster growth for longer, a lower required return for a business with a five-year beta of 0.85, or the cost savings Union Pacific expects from the Norfolk Southern deal, which our model leaves out.
Analysts are much closer to the market. The 25 analysts tracked by S&P Global rate Union Pacific a Buy on average, with an average price target of $331.38, a median of $336.50 and a range from $245 to $375. In October 15 rated it a Strong Buy, 3 a Buy, 6 a Hold and 1 a Sell.
Method
We forecast revenue and GAAP operating margin year by year to 2035, apply a 23.2% tax rate, Union Pacific's effective rate for the first nine months of 2026, and deduct capital spending and working capital to reach unlevered free cash flow. We discount those cash flows at an 8.37% weighted average cost of capital, built from Damodaran's January 2026 data for US railroads: equity is 78.25% of capital at a cost of 9.47%, from a 5.12% risk-free rate, a beta of 0.98 and an equity risk premium of 4.46% for the US, where Union Pacific earns its revenue; debt is 21.75% at an after-tax cost of 4.42%. After 2035 we assume growth of 2.5% a year; that terminal value is 58.6% of our enterprise value of $141.66bn. Deducting debt of $30.32bn and adding cash of $2.21bn, short-term investments of $0.88bn and about $0.75bn of cash flow we estimate for the 33 days from 30 September to 2 November gives equity value of $115.17bn, or $193.73 a share on 594.5m diluted shares. We make no deduction for pension or retiree health obligations, and we exclude operating leases from debt.
For 2026 we use the S&P Global consensus revenue of $27.40bn, up 11.8%, which implies fourth-quarter revenue of about $7.12bn, and GAAP operating income of $10.92bn, a 39.84% margin and an operating ratio of 60.2%; that is nine-month operating income of $8.16bn and fourth-quarter operating income of about $2.75bn, in line with consensus. For 2027 we use consensus revenue of $28.96bn, up 5.7%, and a 41.47% operating margin, an operating ratio of 58.5%, which is what consensus earnings per share of $14.39 imply after interest and tax. For 2028 growth of 4.32% takes revenue to about $30.2bn, in line with S&P Global's three-year forecast of 7.22% annual growth from 2025. Growth then slows to 3.8% in 2029 and 3.34% in 2030 and 2031, Mordor Intelligence's forecast of annual growth in the US rail freight market from 2026 to 2031, and fades to 2.5% by 2035; Global Market Insights expects North American rail freight to grow 2.6% a year to 2035. We hold the 2027 margin flat after that.
Capital spending is $3.5bn in 2026, Union Pacific's capital plan, and $3.70bn in 2027 at the same share of revenue; it then rises to $5.63bn by 2035, 15.1% of revenue, our standard long-run level of reinvestment, which is within the 14.2% to 15.5% of revenue Union Pacific spent in 2024 and 2025. Depreciation is 9.4% of revenue in 2026 and 9.9% from 2031.
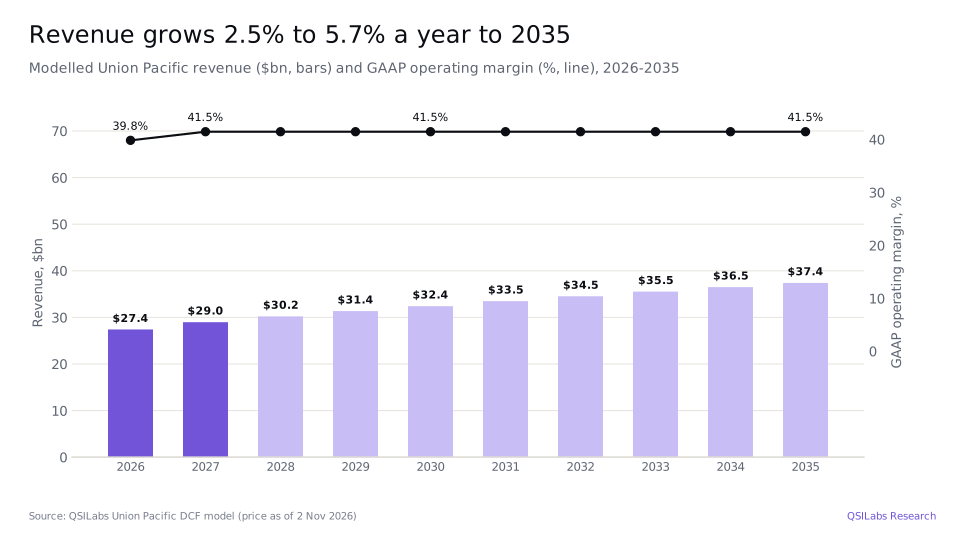
We forecast unlevered free cash flow of $7.34bn in 2026 and $8.31bn in 2027, rising to $9.05bn in 2030 and $9.93bn in 2035; only the part of 2026 after 2 November is discounted. Our previous model, dated 22 October and priced at $298.09, gave $170.91. It assumed revenue growth of 4.0% in 2027, 3.5% in 2028, 3.0% in 2029 and 2030 and 2.5% from 2031, a 40.1% operating margin, the five-year average, a 23% tax rate, 2027 capital spending of $3.4bn and fourth-quarter 2026 revenue of about $6.8bn. Run on today's price and balance sheet, that path gives $173.80; replacing it with the consensus and industry path above adds about $20 a share.
How the number moves if you argue with us
The table shows our value per share at different costs of capital and terminal growth rates. Even at a 7.37% cost of capital and 3.5% terminal growth, the model gives $272.14, about 11% below the share price.
| Cost of capital | Growth 1.5% | Growth 2.0% | Growth 2.5% | Growth 3.0% | Growth 3.5% |
|---|---|---|---|---|---|
| 7.37% | $220.59 | $229.97 | $241.22 | $254.95 | $272.14 |
| 7.87% | $199.60 | $206.79 | $215.25 | $225.39 | $237.76 |
| 8.37% | $181.70 | $187.27 | $193.73 | $201.33 | $210.42 |
| 8.87% | $166.27 | $170.61 | $175.59 | $181.36 | $188.15 |
| 9.37% | $152.82 | $156.23 | $160.10 | $164.52 | $169.65 |
The cost of capital is the biggest question. Damodaran's US railroad figures cover only four companies. A single global railroad beta, unlevered and relevered at Union Pacific's own ratio of debt to equity, gives a beta of 0.60 and a cost of capital of 7.31%, about one percentage point lower, and a value of $244.93 a share; Union Pacific's debt is about 14% of its capital at market value, against the 21.75% in the industry figures. A bottom-up cross-check of 9.4% points the other way, close to the 9.37% row, where the value is $160.10. A two-stage version of the model, which extends the fade over more years, gives $187.62.
Our numbers and the market's can both be right only if Union Pacific grows faster for longer than our forecast, earns a higher margin, needs less capital, or is valued at a cost of capital well below 7.4%. A completed Norfolk Southern merger with the cost savings Union Pacific expects could provide some of that, but it also brings about $20bn of new debt and 225m new shares. We think the price already assumes a lot of it.
Risks to the Union Pacific investment case
- The merger. Completion depends on Surface Transportation Board approval, which may come with conditions, and is not expected until the second half of 2027. The deal adds about $20bn of cash consideration, funded largely with new debt, and a $2.5bn termination fee applies in certain circumstances.
- Fuel. Fuel surcharges lifted revenue growth to 15% against 6% volume growth. If diesel prices fall, revenue growth will slow, and changes in fuel prices move the operating ratio.
- Volume and the economy. Union Pacific described a mixed economic forecast. Intermodal and automotive volumes depend on imports and consumer demand, and bulk volumes on grain, coal and fertilizer markets.
- Service. Intermodal and manifest service performance indices fell by 6 and 7 points as volume rose. Weaker service can cost customers, especially in intermodal, where trucks compete directly.
- Capital needs. Union Pacific plans $3.5bn of capital spending in 2026. A higher level after the merger, or to support growth, would reduce free cash flow.
- Valuation risk. At $307.00 the shares trade at 23.3 times 2026 consensus earnings and above every value in our sensitivity grid. Slower growth or a higher cost of capital would widen the gap.
FAQ
What value does QSILabs put on Union Pacific stock?
Our discounted cash flow model gives $193.73 a share, against a $307.00 close on 2 November 2026. Across costs of capital from 7.37% to 9.37% and terminal growth from 1.5% to 3.5% the value ranges from $152.82 to $272.14. A two-stage cross-check gives $187.62 and a scenario with a single global railroad beta $244.93.
Should I buy Union Pacific stock after the Q3 2026 results?
We do not give personal advice. The third quarter showed 6% volume growth, a stable operating ratio and higher cash flow, and the merger review moved forward. On our numbers the shares trade well above the value of their cash flows unless growth lasts longer or the cost of capital is lower than we assume, so read the risks above before deciding.
How much revenue did Union Pacific make in its latest quarter?
Union Pacific reported operating revenue of $7,197m for the third quarter of 2026, the three months to 30 September, up 15% from $6,244m. Freight revenue was $6,813m and other revenue $384m. Net income was $2,076m, or $3.49 a diluted share.
What is Union Pacific's operating ratio?
The operating ratio is operating expenses as a percentage of revenue, so lower is better. Union Pacific's was 59.1% in the third quarter of 2026, against 59.2% a year earlier, and 58.8% excluding acquisition-related costs. Union Pacific said higher fuel prices added 140 basis points.
What dividend does Union Pacific pay?
Union Pacific pays a quarterly dividend of $1.42 a share, up 3% from $1.38, or $5.68 a year. At the $307.00 close on 2 November 2026 that is a yield of 1.85%. It paid $2,484m of dividends in the first nine months of 2026.
What price target do analysts have for UNP?
The 25 analysts tracked by S&P Global have an average target of $331.38, about 8% above the $307.00 close on 2 November 2026, with a median of $336.50, a low of $245 and a high of $375. Their consensus rating is Buy.
How much debt does Union Pacific have?
Total debt was $30,324m at 30 September 2026, down from $31,814m at the end of 2025, against cash of $2,211m and short-term investments of $875m. Adjusted debt, including operating leases, was 2.4 times adjusted EBITDA.
When will the Norfolk Southern deal close?
Union Pacific expects to complete the acquisition in the second half of 2027, if the Surface Transportation Board approves it. Norfolk Southern shareholders would receive one Union Pacific share and $88.82 in cash for each share they own.
What did Union Pacific say about 2026?
It affirmed reported earnings per share growth in the high single digits for 2026, consistent with its three-year target of high-single to low-double digit annual growth through 2027, and pricing gains above inflation. It updated its capital plan to $3.5bn and said fuel prices are a challenge for the reported operating ratio.
Sources
- Union Pacific Corporation, third-quarter 2026 results (Form 8-K, Exhibit 99.1, 22 Oct 2026; accession 0000100885-26-000319) www.sec.gov
- Union Pacific Corporation, Form 10-Q for the quarter ended 30 Sep 2026 (filed 22 Oct 2026; accession 0000100885-26-000321) www.sec.gov
- SEC XBRL company facts for Union Pacific Corporation (CIK 100885): quarterly and annual revenue, operating income, cash flow and capital investments from Forms 10-Q and 10-K data.sec.gov
- StockAnalysis: Union Pacific forecast and analyst ratings, S&P Global data (last updated 27 Oct 2026; accessed 2 Nov 2026) stockanalysis.com
- StockAnalysis: Union Pacific statistics (accessed 2 Nov 2026) stockanalysis.com
- Mordor Intelligence, United States Rail Freight Transport Market report (accessed 2 Nov 2026) www.mordorintelligence.com
- Global Market Insights, Rail Freight Market report (accessed 2 Nov 2026) www.gminsights.com
- Yahoo Finance chart data: UNP closing prices and dividends (November 2025 to November 2026) query1.finance.yahoo.com
- Damodaran Online: cost of capital by industry (US), January 2026 pages.stern.nyu.edu
- QSILabs Union Pacific discounted cash flow model (internal; price as of 2 Nov 2026)
Disclaimer
This article is for information only and is not investment advice, a recommendation or an offer to buy or sell any security. QSI Labs and its authors may hold positions in the securities discussed. Forecasts and valuations are estimates that depend on assumptions that may prove wrong. Figures are taken from company filings and third-party sources believed to be reliable, but we do not guarantee their accuracy. Do your own research or consult a licensed adviser before investing.
More from QSI Labs
Related analysis: Caterpillar stock Q3 2026: power generation and backlog, GE Aerospace stock Q3 2026: LEAP and services, RTX stock Q3 2026: backlog and guidance and GE Vernova stock Q3 2026.
Read our white paper, QSI Labs: An AI-Native Trading Firm Built on a Training Loop (October 2026), available on request, or browse the research index.