Research / Earnings and valuation
GE Vernova Stock Q3 2026:Revenue Up 27% as Backlog Reaches $197bn
As of: Figures are as of GE Vernova's third-quarter 2026 results (the quarter ended 30 September 2026, reported 28 October 2026 in a Form 8-K) and its Form 10-Q for that quarter, filed the same day. GE Vernova's fiscal year is the calendar year, so its Q3 2026 covers July to September 2026. The share price used in our valuation is the NYSE close of GEV on 2 November 2026, $862.25; analyst data were accessed on 2 November 2026. Published 2 November 2026.
The short answer. GE Vernova stock Q3 2026 rests on a quarter in which the maker of gas turbines, grid equipment and wind turbines grew revenue at its fastest year-on-year rate of the past five quarters. Revenue for the three months to 30 September 2026 rose 27% to $12.64bn, with 18% organic growth, orders reached $29.3bn and backlog climbed $20bn in the quarter to $197bn. Adjusted EBITDA margin nearly doubled to 15.4%, and GE Vernova raised its 2026 guidance for revenue, margin and free cash flow. Our discounted cash flow model values GEV at $545.40 a share, against an $862.25 close on 2 November 2026. The business is executing well; the price assumes growth or margins beyond the consensus path that our model already follows to 2030.
Key takeaways
- Revenue up 27%. Q3 2026 revenue was $12,642m, up from $9,969m a year earlier. Organic growth was 18%, and Prolec GE, the transformer maker GE Vernova took full control of in February, added $945m.
- Orders doubled. Orders were $29.3bn, up 96% organically, led by $21.8bn at Power. Backlog, measured as remaining performance obligation, reached $196.7bn, 45% more than a year earlier.
- Margins widened. GAAP operating income rose to $1,394m from $366m, an 11.0% margin. Adjusted EBITDA was $1,943m, a 15.4% margin against 8.1%, as Power began shipping gas turbines from a higher-priced backlog.
- Guidance raised. GE Vernova now expects 2026 revenue of $46.5bn to $47.5bn, an adjusted EBITDA margin of 13.5% to 14.5% and free cash flow of $16bn to $17bn, up from $11.5bn to $12.5bn.
- Cash is piling up. Free cash flow was $5.4bn in the quarter and $15.3bn in nine months, much of it customer down payments. Cash reached $16.8bn against $2.8bn of debt, and the buyback authorisation was doubled to $20bn.
- Our value: $545.40 a share, about 37% below the $862.25 close on 2 November 2026. A two-stage cross-check gives $557.78; analysts' average target is $1,189.
- What to watch. Whether backlog passes $200bn in the fourth quarter as management expects, how fast Power margins rise as higher-priced turbines ship, the Trench Group acquisition, and the date of a capital markets day with a 2030 outlook, due to be set on the January call.
Key numbers from GE Vernova's Q3 2026 earnings
| Metric | Q3 2026 | Q3 2025 | Change |
|---|---|---|---|
| Revenue | $12,642m | $9,969m | +27% |
| Organic revenue growth | 18% | n/a | n/a |
| Orders | $29.3bn | n/a | +96% organic |
| GAAP operating income | $1,394m | $366m | +281% |
| GAAP operating margin | 11.0% | 3.7% | +7.3 pts |
| Adjusted EBITDA | $1,943m | $811m | +140% |
| Adjusted EBITDA margin | 15.4% | 8.1% | +7.3 pts |
| Net income | $1,289m | $453m | +185% |
| Diluted EPS | $4.81 | $1.64 | +193% |
| Cash from operating activities | $6,057m | $980m | +518% |
| Free cash flow | $5,409m | $732m | +639% |
| Backlog (period end) | $196.7bn | $135.3bn | +45% |
| Total debt (period end) | $2,826m | n/a | n/a |
GE Vernova Q3 2026 earnings: what happened
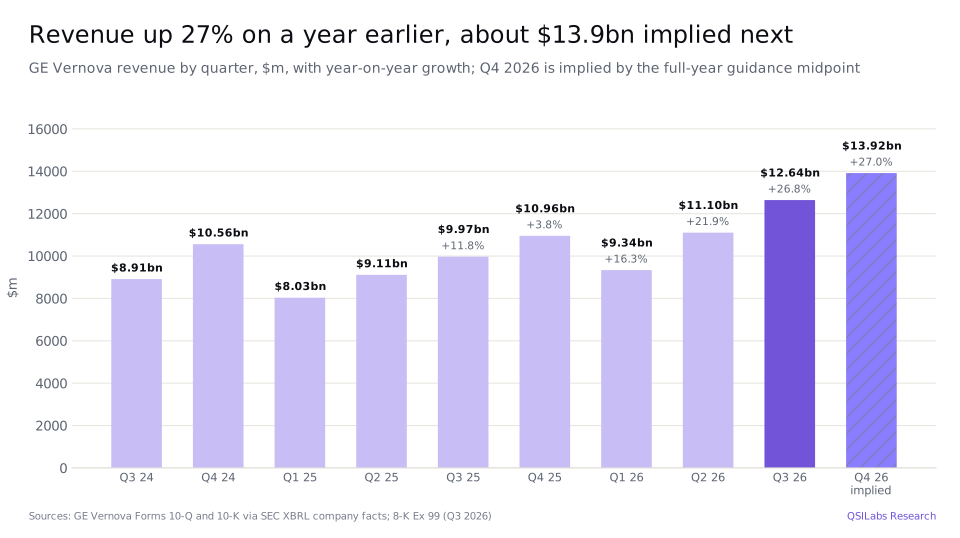
GE Vernova reported revenue of $12,642m for the third quarter of 2026, 26.8% more than a year earlier and 13.9% more than the $11,104m of the June quarter. Organic revenue, which strips out acquisitions, disposals and currency, grew 18% to $11,676m. The rest of the growth came mainly from Prolec GE, which added $945m in the quarter. Equipment revenue rose 42% to $8,340m and services revenue 5% to $4,302m. Revenue for the first nine months was $33,084m, up 22%.
Chief executive Scott Strazik said the company "delivered strong financial results in the third quarter as demand for electricity infrastructure increases around the world". Orders of $29.3bn were more than twice revenue. Within Power, gas turbine equipment led, but services orders also grew 12% organically, driven by gas and nuclear power.
GAAP operating income was $1,394m, almost four times the $366m of a year earlier, and diluted EPS rose 193% to $4.81. Net income was $1,289m. The tax charge was $493m, an effective rate of 27.7%, which the 10-Q attributes mainly to losses that give no tax benefit in some countries and US tax on income earned abroad. Average diluted shares fell to 268m from 275m because of buybacks. On GE Vernova's adjusted basis, which adds back depreciation and amortisation of $439m, restructuring and separation costs and taxes, and removes gains on business sales and pension income, EBITDA rose 140% to $1,943m.
The company said margins "expanded significantly from higher price, volume, and productivity". The company also finished exiting its transition services agreements with GE Aerospace, which it expects to save about $135m of general and administrative costs, $100m of it already realised.
- 9 Dec 2025Investor update: outlook by 2028 raised to $52bn of revenue and a 20% adjusted EBITDA margin; quarterly dividend doubled to $0.50GE Vernova press release
- 28 Jan 2026Q4 2025 results; outlook by 2028 raised again, to $56bn of revenue including Prolec GE and at least $24bn of cumulative free cash flow8-K Ex 99 (Q4 2025)
- 2 Feb 2026GE Vernova buys the remaining 50% of Prolec GE from Xignux for $5,254m in cashForm 10-Q
- 30 Jun 2026GEV closes at $1,174.86, its 52-week closing highYahoo Finance
- Aug 2026Fitch upgrades GE Vernova's credit rating to A- from BBB+8-K Ex 99
- 30 Sep 2026Q3 2026 ends: revenue $12,642m (+27%), backlog $197bn8-K Ex 99; Form 10-Q
- 1-23 Oct 2026GE Vernova buys back about 1.4m shares for $1.3bn8-K Ex 99
- 28 Oct 2026Q3 results; 2026 guidance raised; $9.0bn Trench Group acquisition and a $20bn buyback authorisation announced; GEV closes at $878.038-K Ex 99; earnings call; Yahoo Finance
- 2 Nov 2026GEV closes at $862.25, the price used in our valuationYahoo Finance
- 27 Jan 2027Expected date of Q4 2026 results, when management plans to set the date of a capital markets day with a 2030 financial outlookStockoscope; earnings call
Which GE Vernova segments grew fastest?
Power, the largest of GE Vernova's three segments, grew revenue 25% to $6,067m, all of it organic, led by deliveries of heavy-duty and aeroderivative gas turbines and higher prices. Segment EBITDA doubled to $1,297m and the margin rose to 21.4% from 13.4%. Power orders rose 178% organically to $21.8bn and included 55 heavy-duty gas turbines, 21 of them the large HA model, and 57 aeroderivative turbines.
In gas power GE Vernova signed 11 gigawatts (GW) of new contracts in the quarter, 8 GW as slot reservation agreements, under which a customer reserves a future production slot, and 3 GW as firm orders. It converted 13 GW of reservations into orders and shipped 5 GW. Gas equipment backlog rose to 64 GW from 53 GW, reservations fell to 58 GW from 63 GW, and the total under contract rose to 122 GW from 116 GW. Strazik said the company expects at least 130 GW by the end of 2026, against 83 GW when the year began.
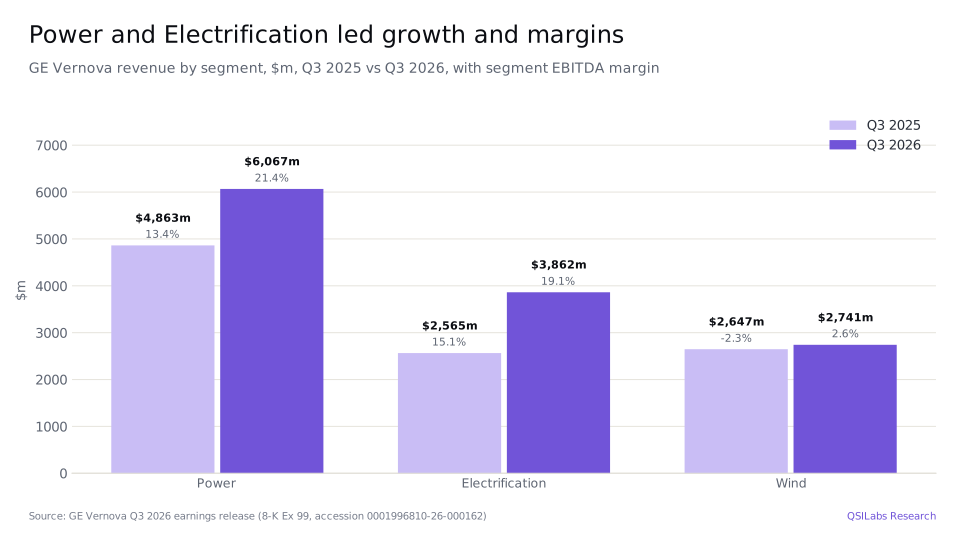
Electrification, which makes grid equipment such as transformers, switchgear and high-voltage direct current systems, grew revenue 51% to $3,862m, or 16% organically. Segment EBITDA rose 91% to $739m, a 19.1% margin. Orders were $5.4bn, down 9% organically because the year-earlier quarter included large synchronous condenser orders, and book-to-bill, orders divided by revenue, was about 1.4. Electrification equipment backlog rose 60% in a year to $42.2bn, including $5bn from Prolec GE, and data centre customers placed about $1.4bn of Electrification orders in the quarter, according to the call.
Wind revenue rose 4% to $2,741m, or 3% organically, as onshore services and offshore deliveries offset fewer onshore turbine deliveries. The segment made EBITDA of $72m, a 2.6% margin, against a $61m loss a year earlier, helped by lower offshore project costs and the settlement of all outstanding litigation over the Vineyard Wind offshore project. Wind orders rose 16% organically to $2.1bn, mainly for repowering onshore farms in North America.
How big is GE Vernova's backlog?
GE Vernova's remaining performance obligation, the revenue it is contracted to earn in future, was $196,721m at 30 September 2026, up from $176,284m in June and $135,269m a year earlier. Of the total, $104,054m was equipment, of which the company expects to recognise 33% within a year and 60% within two years, and $92,667m was services, of which 16% falls within a year and 78% within ten years. Long-term service contracts on installed equipment make the services backlog long-dated: the company expects 91% of it to be recognised within 15 years.
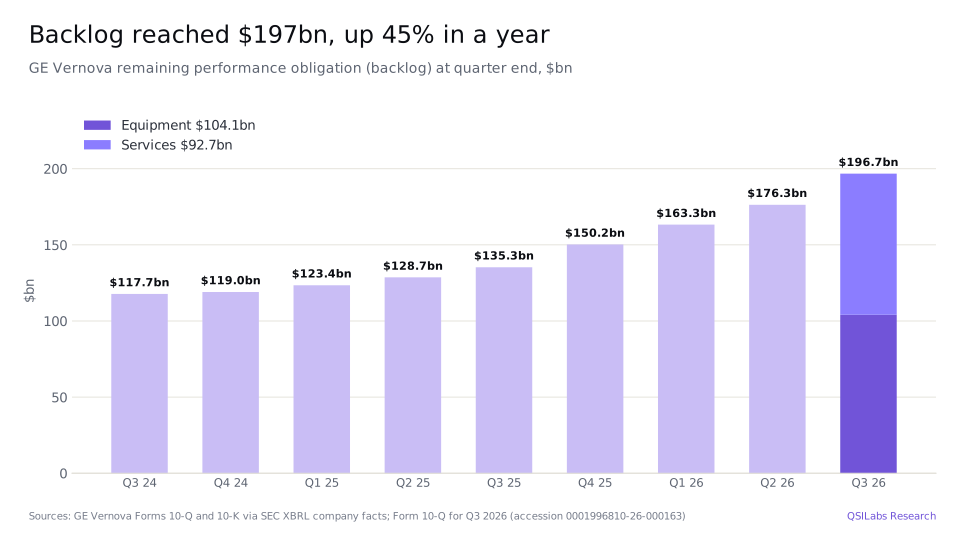
Strazik said he now expects backlog "to exceed $200 billion in the fourth quarter, with improved margins". In December 2025 GE Vernova had set a goal of growing backlog to about $200bn by the end of 2028, so it is about two years ahead of that plan. Gas equipment backlog, at 64 GW, is now larger than the 58 GW held under slot reservation agreements, which management presented as greater certainty that it will ship more gigawatts through the rest of the decade.
Why are GE Vernova's margins rising?
GE Vernova's GAAP operating margin was 11.0% in the third quarter, up from 3.7% a year earlier and the highest of the nine quarters shown below. Adjusted EBITDA margin rose 730 basis points to 15.4%, or 690 basis points on an organic basis. The company credited higher prices, more profitable volume and productivity, partly offset by inflation. Strazik said Power's margins "reflect the first quarter of our 5 gigawatt of gas power equipment shipments at better prices", in what is usually its weakest quarter for services.
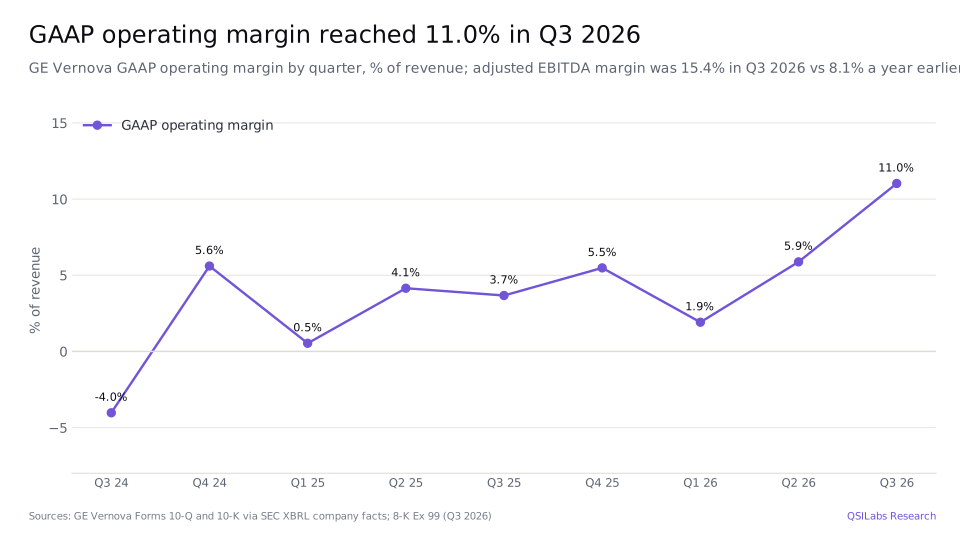
The longer view shows a business that lost money at the operating level when it was part of General Electric. GE Vernova's GAAP operating margin was -9.7% in 2022 and -2.8% in 2023, turned positive at 1.3% in 2024 and reached 3.6% in 2025. Guidance implies revenue of about $47.0bn in 2026, up 23% on 2025's $38.07bn, and we estimate a GAAP operating margin of 8.9%.
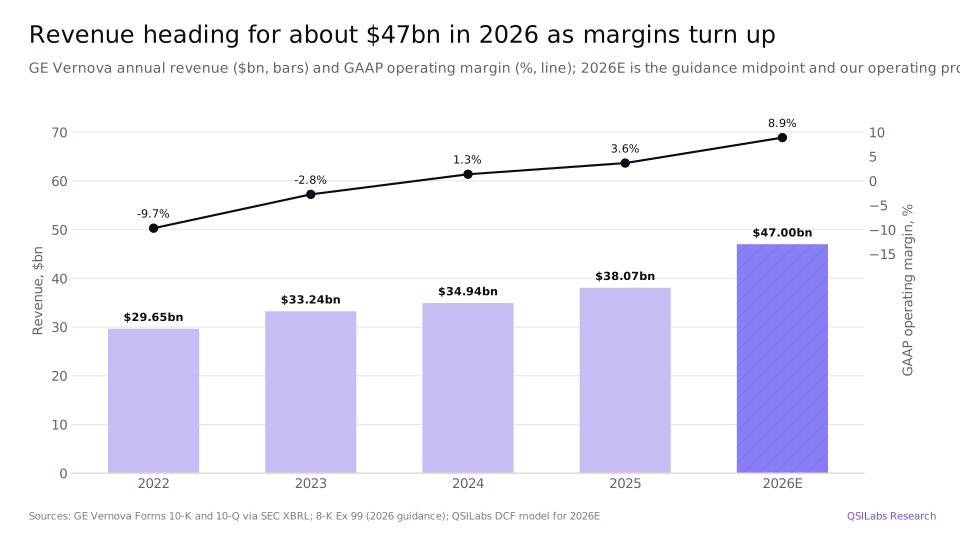
Management says there is more to come. Strazik said the 2030 financial outlook the company plans to give at its next capital markets day will be "a floor on what we expect by 2030", and that "we have high expectations of significant margin expansion every year between now and then".
How much free cash flow does GE Vernova generate?
Cash from operating activities was $6,057m in the third quarter and $16,737m in the first nine months of 2026, up from $2,508m a year earlier. After $1,430m of capital spending, free cash flow was $15,307m for the nine months, against $1,902m. Over the 12 months to September, cash from operations was $19,216m, capital spending $2,101m and free cash flow $17,115m.
Much of that cash is prepaid. Parks said working capital provided $5.3bn of cash in the third quarter, "driven primarily by down payments on increased orders and slot reservations at Power as well as down payments at Electrification". Those deposits are real cash, but they are paid ahead of deliveries, and the cost of building the turbines and transformers will be incurred later.
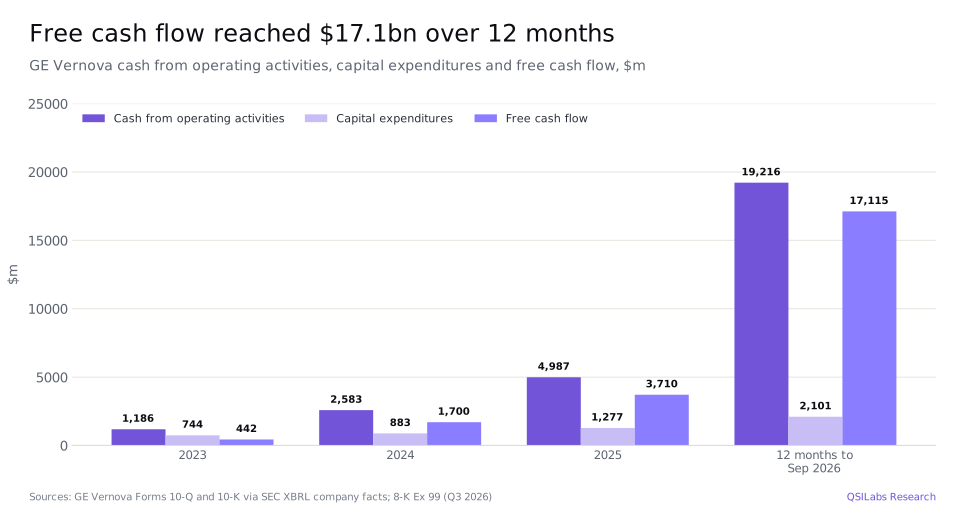
GE Vernova returned $5.7bn to shareholders in the first nine months of 2026, including 6.0m shares bought back for $5.3bn, and bought another 1.4m shares for $1.3bn between 1 and 23 October. Since its buyback began in December 2024 it has repurchased 15.6m shares for $9.9bn, an average of about $635 a share. In October the board raised the authorisation to $20bn from $10bn, leaving $10.1bn available. The company also paid about $350m to transfer part of its retiree benefit obligations to an insurer. Cash reached $16,764m at 30 September, up from $8,848m at the end of 2025.
What did GE Vernova guide for 2026?
GE Vernova raised its 2026 guidance with the results. It now expects revenue of $46.5bn to $47.5bn, up from $45.5bn to $46.5bn, an adjusted EBITDA margin of 13.5% to 14.5%, up from 12% to 14%, and free cash flow of $16bn to $17bn, up from $11.5bn to $12.5bn.
By segment, Power is now expected to grow organic revenue 19% to 21%, with a 19% to 21% segment EBITDA margin, up from 17% to 19%. Electrification should have revenue of $14.5bn to $15.0bn, including about $3.1bn from Prolec GE, with a margin trending toward the top of its 18% to 20% range. Wind organic revenue should fall by a mid-single-digit percentage, better than the low-double-digit decline previously guided, with segment EBITDA losses of $400m to $500m, slightly more than the roughly $400m guided before, partly because services work was brought forward from 2027.
Subtracting nine-month revenue of $33,084m from the full-year range implies fourth-quarter revenue of $13.42bn to $14.42bn, against $10.96bn in Q4 2025. The free cash flow guidance implies $0.7bn to $1.7bn in the fourth quarter. Analysts tracked by S&P Global expect 2026 revenue of $46.94bn and 2027 revenue of $53.54bn, up 14.1%, with 2027 EPS of $25.89.
What has GE Vernova promised investors beyond 2026?
At an investor update on 9 December 2025, GE Vernova raised its outlook by 2028 to $52bn of revenue, from $45bn, and a 20% adjusted EBITDA margin, from 14%, and said it expects "substantially higher returns beyond 2028". With its fourth-quarter results on 28 January 2026 it raised the 2028 revenue outlook again, to $56bn including Prolec GE, with low-teens organic growth a year from 2025, a 20% adjusted EBITDA margin and cumulative free cash flow of at least $24bn from 2025 to 2028. Power is expected to reach a 22% segment EBITDA margin and Wind 6%.
That outlook already looks conservative. Free cash flow of $3.7bn in 2025 and $16bn to $17bn guided for 2026 add up to about $20bn in two of the four years, and analysts' 2028 revenue forecast of about $62.1bn is above the $56bn outlook, which was set when 2026 revenue guidance was $44bn to $45bn. The company plans to invest $6bn of capital spending from 2025 to 2028, including $1bn at Prolec GE, and $5bn in research and development.
The demand backdrop is supportive. The International Energy Agency forecasts that global electricity demand will grow at an average 3.6% a year from 2026 to 2030, against 2.8% a year over the past decade, driven by industry, electric vehicles, air conditioning and data centres. Management also said each gigawatt of HA gas turbines is expected to generate about $500m of services revenue over its first 20 years, which ties today's orders to decades of service income.
On the January call, management plans to set a date for a capital markets day at which it will give a 2030 financial outlook. A new chief financial officer and a new head of Wind start in January 2027, after transitions with Parks and the current Wind leader.
How has GEV stock performed over the past year?
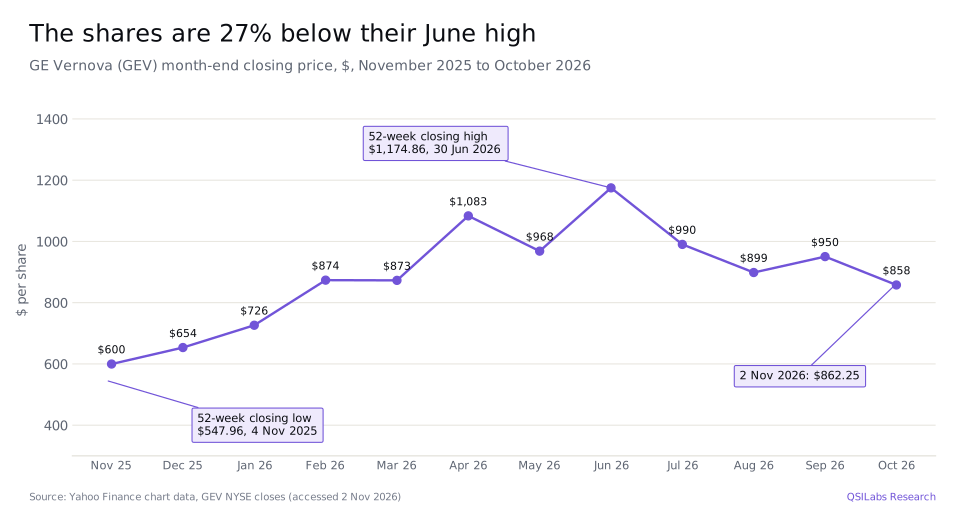
GE Vernova shares closed at $862.25 on 2 November 2026, 48% above the $581.26 close of 3 November 2025 and 32% above the $653.57 close at the end of 2025. The path was steep and uneven. From a 52-week closing low of $547.96 on 4 November 2025 the shares more than doubled to a closing high of $1,174.86 on 30 June 2026, then fell back. They closed at $895.08 on 27 October, $878.03 on results day, 1.9% lower, and $857.87 on 30 October, and are now 27% below the June high.
GE Vernova stock Q3 2026: is GEV overvalued?
On our numbers, yes. Our discounted cash flow model values GE Vernova at $545.40 a share, against an $862.25 close on 2 November 2026, about 37% lower. At that price GE Vernova's equity was worth about $231bn, on 268m diluted shares, and its enterprise value, after net cash of about $13.9bn, about $217bn. That is 4.0 times consensus 2027 revenue and 33.3 times consensus 2027 EPS of $25.89. The midpoint of 2026 free cash flow guidance, $16.5bn, is a yield of about 7.1% on the equity value, but much of that is customer deposits that will be spent building the equipment.
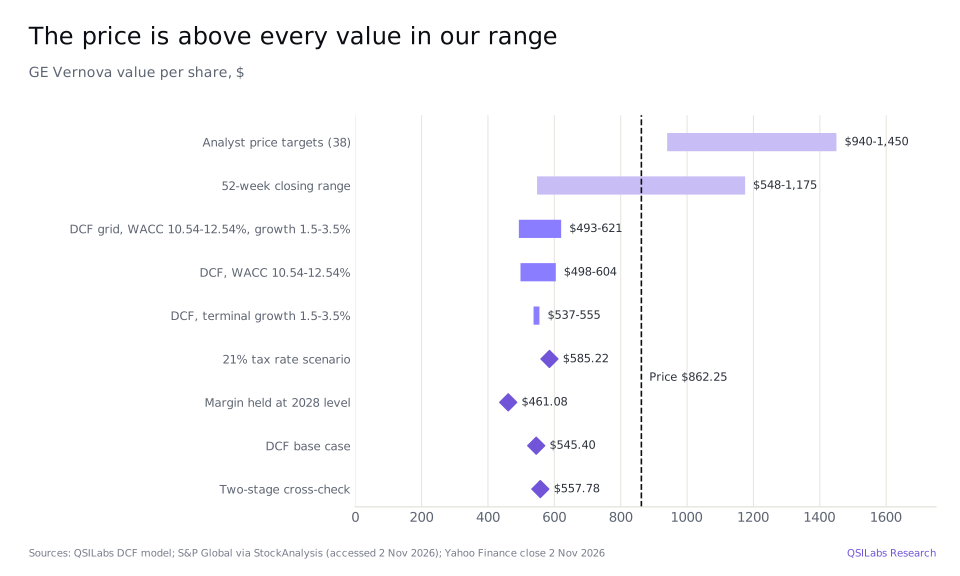
We are not saying the business is weak. GE Vernova is growing organically at 18%, has nearly doubled its adjusted EBITDA margin in a year and holds $197bn of contracted work. We are saying the price assumes more than our forecast, which already follows analysts' consensus revenue and margins through 2030: either growth well above consensus for many years after 2030, margins well above 20%, or a much lower discount rate than we use.
Analysts disagree. The 38 analysts tracked by S&P Global rate GE Vernova a Strong Buy on average, with an average price target of $1,189, a median of $1,200 and a range from $940 to $1,450. Stockoscope, which aggregates a different set of estimates, shows 32 buy ratings, six holds and no sells. Our value is below the lowest target.
Method
We forecast revenue and GAAP operating margin year by year to 2035, apply a 27.7% tax rate, GE Vernova's effective rate in the third quarter, and deduct capital spending and working capital to reach unlevered free cash flow. GE Vernova does not guide a tax rate. Its nine-month rate excluding the non-taxable Prolec GE gain was 29.4%, which supports a rate in the high 20s. We discount the cash flows at an 11.54% weighted average cost of capital, based on Damodaran's January 2026 data for 112 US electrical equipment companies: an unlevered beta of 1.25, relevered to 1.26 for GE Vernova's small debt, a 5.17% equity risk premium and a 5.12% risk-free rate, giving a cost of equity of about 11.6%; debt is about 1% of capital. After 2035 we assume growth of 2.5% a year; that terminal value is 44.1% of our enterprise value of $131.7bn. Adding cash of $16.76bn, deducting all $2.83bn of debt, including finance leases and other borrowings, and $1.16bn of minority interests, and adding $1.43bn of equity-method investments at book value and about $0.30bn of cash generated between the balance sheet date and 2 November, net of the October dividend, gives equity value of $146.2bn, or $545.40 a share on 268m diluted shares.
For 2026 we use the midpoint of guidance, revenue of $47.0bn, and GAAP operating income of $4.17bn, an 8.9% margin. For 2027 to 2030 we use consensus revenue from analysts tracked by Financial Modeling Prep, as shown by Stockoscope: $53.7bn in 2027, $62.1bn in 2028, $70.7bn in 2029 and $80.6bn in 2030, growth of 14% to 16% a year. Fewer analysts forecast the later years, 12 for 2030 against 24 for 2027. Growth then fades by 2.3 points a year, to 11.7% in 2031, 7.1% in 2033 and 2.5% in 2035, approaching the IEA's 3.6% electricity demand growth rate as the decade ends. We do not include Trench Group, which has not yet been bought.
For margins we take the consensus adjusted EBITDA margin each year and subtract 4.3 points, the gap between adjusted EBITDA and GAAP operating income in the third quarter, which covers depreciation, amortisation and other items. That gives a GAAP operating margin of 12.4% in 2027, 15.8% in 2028, 18.0% in 2029 and 20.4% in 2030, which we hold flat to 2035. The 2028 consensus margin of 20.2% matches the company's 20% outlook.
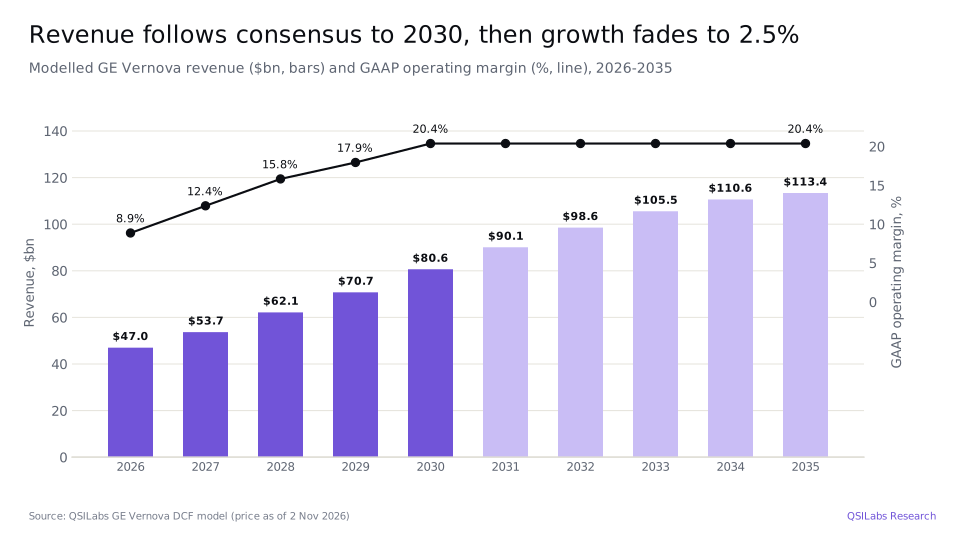
We forecast unlevered free cash flow of $7.3bn in 2027, rising to $15.2bn in 2030 and $13.9bn in 2035. We assume capital spending of about $2.05bn in 2026 and $2.32bn in 2027, 4.3% of revenue, as in the first nine months of 2026, rising to about $6.3bn by 2035. Because customers pay deposits in advance, GE Vernova's working capital is negative, and in our model growth releases cash each year; if order growth slowed, that would reverse.
How the number moves if you argue with us
The table shows our value per share at different costs of capital and terminal growth rates. Even at a 10.54% cost of capital and 3.5% terminal growth, the model reaches $620.55, about 72% of the share price.
| Cost of capital | Growth 1.5% | Growth 2.0% | Growth 2.5% | Growth 3.0% | Growth 3.5% |
|---|---|---|---|---|---|
| 10.54% | $591.49 | $597.63 | $604.42 | $612.01 | $620.55 |
| 11.04% | $563.00 | $567.86 | $573.20 | $579.10 | $585.68 |
| 11.54% | $537.37 | $541.21 | $545.40 | $549.99 | $555.05 |
| 12.04% | $514.18 | $517.21 | $520.49 | $524.05 | $527.93 |
| 12.54% | $493.10 | $495.48 | $498.03 | $500.78 | $503.74 |
Two other assumptions matter. Using a 21% tax rate, close to what analysts' earnings forecasts imply, raises the value to $585.22. Holding the operating margin at its 2028 level of 15.8%, instead of letting it rise to 20.4% as consensus expects, lowers it to $461.08. A two-stage version of the model, which extends the fade over more years, gives $557.78. Damodaran's published industry average cost of capital, 10.13%, would lift the value but leave it well below the share price. Matching the price would need GE Vernova to keep growing at double-digit rates well beyond 2030, or to earn margins well above the 20% it has outlined.
Risks to the GE Vernova investment case
- Gas turbine cycle. Power made 48% of third-quarter revenue and 74% of orders. Much of the demand comes from utilities and data centre customers; if electricity demand grows more slowly than expected, or financing for new plants dries up, orders and reservations could fall.
- Execution and costs. GE Vernova must deliver a fast-growing backlog on schedule while inflation offsets part of its price gains, as it did in Power this quarter. Power margins are rising from a low base and depend on delivering the higher-priced backlog on time.
- Wind. Wind is expected to lose $400m to $500m at the segment EBITDA level in 2026. Parks said it "remains difficult to call an inflection point in U.S. orders", and offshore projects in the North Sea have another year of execution.
- Working capital. Customer deposits added $5.3bn of cash in the third quarter. If order growth slowed, deposits would fall as equipment ships, and free cash flow would drop below profits for a time.
- Acquisitions. GE Vernova agreed to buy Trench Group for $9.0bn, about 13 times expected 2028 EBITDA, to be funded with equal amounts of debt and cash, with closing expected in late 2027 subject to regulatory approval. Integrating Prolec GE and Trench adds risk.
- Leadership change. A new chief financial officer and a new head of Wind take over in January 2027.
- Valuation risk. At about 33 times consensus 2027 EPS, the shares price in years of strong growth. Analysts' targets range from $940 to $1,450, all above our sensitivity grid, so the gap between our value and the market rests on how fast, and for how long, GE Vernova can grow after 2030.
FAQ
What value does QSILabs put on GE Vernova stock?
QSILabs values GE Vernova at $545.40 a share, based on a discounted cash flow model updated with Q3 2026 results and the Form 10-Q. That is about 37% below the $862.25 close on 2 November 2026. A two-stage cross-check gives $557.78; analysts' average price target is $1,189.
Is GE Vernova stock a buy after its Q3 2026 results?
Our model says GEV trades well above what its cash flows justify, even using consensus revenue and margins through 2030. The business is strong: 18% organic growth in the September quarter, a 15.4% adjusted EBITDA margin, $197bn of backlog and free cash flow guidance of $16bn to $17bn for 2026. This is not investment advice.
How much revenue did GE Vernova make in its latest quarter?
GE Vernova's revenue for Q3 2026, the quarter to 30 September 2026, was $12,642m, up 27% from $9,969m a year earlier, with organic growth of 18%. Power contributed $6,067m, Electrification $3,862m and Wind $2,741m. Revenue for the first nine months of 2026 was $33,084m.
What does GE Vernova do?
GE Vernova makes and services equipment that generates and moves electricity. Its Power segment sells gas turbines, nuclear and hydro equipment and long-term service contracts; Electrification makes grid equipment such as transformers, switchgear and high-voltage direct current systems; and Wind makes onshore and offshore wind turbines. It was spun off from General Electric in April 2024 and is listed on the NYSE as GEV.
Does GE Vernova pay a dividend?
Yes. GE Vernova pays a quarterly dividend of $0.50 a share, or $2.00 a year, after doubling it from $0.25 in December 2025. That is a yield of about 0.2% at the 2 November 2026 price. The latest dividend went ex on 27 October and is payable on 24 November 2026. The company returns more through buybacks, $5.3bn in the first nine months of 2026.
When does GE Vernova report its next earnings?
GE Vernova is expected to report fourth-quarter and full-year 2026 results on 27 January 2027, according to Stockoscope. Management said it will set the date of its next capital markets day, with a 2030 financial outlook, on that call. Its guidance implies fourth-quarter revenue of $13.42bn to $14.42bn.
What price target do analysts have for GEV?
The 38 analysts tracked by S&P Global, as reported by StockAnalysis on 2 November 2026, have an average price target for GE Vernova of $1,189, a median of $1,200, a low of $940 and a high of $1,450, with a consensus rating of Strong Buy. Our DCF value of $545.40 is below even the lowest target.
How much debt does GE Vernova have?
GE Vernova had $2,826m of debt at 30 September 2026: senior notes of $600m due 2031, $1,000m due 2036 and $1,000m due 2056, plus $281m of other borrowings and finance leases, less unamortised discounts. Against $16,764m of cash, that leaves net cash of about $13.9bn. Its $3bn revolving credit facility was undrawn, and Fitch rates it A-.
What is Trench Group and why is GE Vernova buying it?
Trench Group makes high-voltage grid equipment such as bushings, instrument transformers and coils used in transformers and substations, with estimated 2026 revenue of about $1.4bn. GE Vernova agreed in October 2026 to buy it for $9.0bn, about 13 times expected 2028 EBITDA. Management expects Trench to grow revenue at a mid-teens rate from 2026 to 2028, earn an adjusted EBITDA margin of about 36% in 2028 and deliver $50m to $100m of annual cost savings by 2030. Closing is expected in late 2027.
Sources
- GE Vernova Inc., third-quarter 2026 results (Form 8-K, Exhibit 99, 28 Oct 2026; accession 0001996810-26-000162) www.sec.gov
- GE Vernova Inc., Form 10-Q for the quarter ended 30 Sep 2026 (filed 28 Oct 2026; accession 0001996810-26-000163) www.sec.gov
- GE Vernova Inc., fourth-quarter 2025 results (Form 8-K, Exhibit 99, 28 Jan 2026; accession 0001996810-26-000012) www.sec.gov
- GE Vernova, "GE Vernova raises multi-year financial outlook, doubles dividend and increases buyback authorization", 9 Dec 2025 www.gevernova.com
- SEC XBRL company facts for GE Vernova (CIK 1996810): quarterly and annual revenue, operating income, backlog and cash flow from Forms 10-Q and 10-K data.sec.gov
- GE Vernova Q3 2026 earnings call transcript, 28 Oct 2026, via The Motley Fool (accessed 2 Nov 2026) www.fool.com
- GE Vernova, Q3 2026 earnings webcast presentation, 28 Oct 2026 www.gevernova.com
- StockAnalysis: GE Vernova forecast and analyst ratings, S&P Global data (accessed 2 Nov 2026) stockanalysis.com
- Stockoscope: GE Vernova analyst estimates (accessed 2 Nov 2026) stockoscope.com
- International Energy Agency, Electricity 2026 (CC BY 4.0) iea.blob.core.windows.net
- Yahoo Finance chart data: GEV closing prices and dividends (November 2025 to November 2026) query1.finance.yahoo.com
- Damodaran Online: cost of capital by industry (US), January 2026 pages.stern.nyu.edu
- QSILabs GE Vernova discounted cash flow model (internal; price as of 2 Nov 2026)
Disclaimer
This article is for information only and is not investment advice, a recommendation or an offer to buy or sell any security. QSI Labs and its authors may hold positions in the securities discussed. Forecasts and valuations are estimates that depend on assumptions that may prove wrong. Figures are taken from company filings and third-party sources believed to be reliable, but we do not guarantee their accuracy. Do your own research or consult a licensed adviser before investing.
More from QSI Labs
Related analysis: Caterpillar stock Q3 2026: power generation and backlog, GE Aerospace stock Q3 2026: LEAP, services and backlog, RTX stock Q3 2026: backlog and guidance and Dell stock Q3 2026: AI servers and backlog.
Read our white paper, QSI Labs: An AI-Native Trading Firm Built on a Training Loop (October 2026), available on request, or browse the research index.