Research / Earnings and valuation
Sandisk Stock Q3 2026:Datacenter Sales Jump 61% as Revenue Reaches $11bn
As of: Figures are as of Sandisk Corporation's results for the first quarter of fiscal 2027 (the 13 weeks ended 2 October 2026, reported 29 October 2026 in a Form 8-K) and its Form 10-Q for that quarter, filed 30 October 2026. Sandisk's fiscal year ends around the start of July, so this quarter covers July to September 2026, the calendar third quarter. Per-share figures are before the 8-for-1 stock split that takes effect on 20 November 2026. The share price used in our valuation is the Nasdaq close of SNDK on 2 November 2026, $1,075.08; analyst data were accessed on 2 November 2026. Published 2 November 2026.
The short answer. Sandisk stock Q3 2026 comes down to a quarter in which AI datacenters became the engine of the business. In the three months to 2 October 2026, Sandisk's first quarter of fiscal 2027 and the calendar third quarter, revenue rose 378% from a year earlier to $11.03bn, datacenter revenue rose 61% from the previous quarter to $4.80bn and the GAAP gross margin was 85.0%. Operating income was $8.78bn, a 79.6% margin, and free cash flow $6.31bn. Sandisk expects revenue of $12.2bn to $12.6bn in the December quarter. The shares still fell 19.2% in the two sessions after the results, to $1,075.08 on 2 November 2026. Our discounted cash flow model values them at $1,972.97 a share, about 1.8 times that price. The gap rests on how long margins near 75% last, so we show below how far the value moves when that changes.
Key takeaways
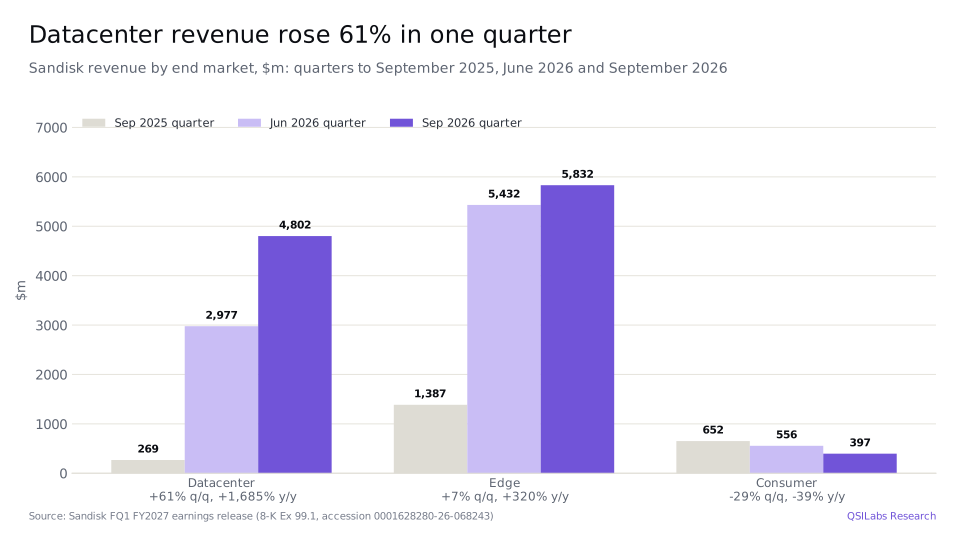
- Datacenter is now 43.5% of revenue. Datacenter revenue was $4,802m, up 61% from $2,977m in the June quarter and against $269m a year earlier, when it was 11.7% of revenue. Sandisk said its customers include three US hyperscalers.
- Prices and volumes both rose. Revenue rose 23% from the previous quarter. Chief financial officer Luis Visoso said 60% of that increase came from volume and 40% from higher prices.
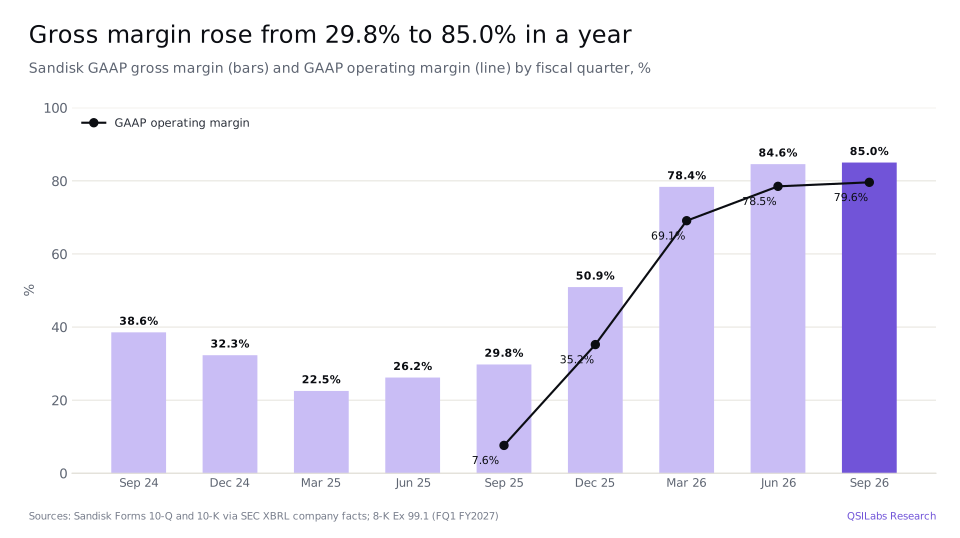
- Margins rose again. The GAAP gross margin was 85.0%, against 29.8% a year earlier and 84.6% in the June quarter. GAAP operating income was $8,780m, a 79.6% margin, and non-GAAP earnings per share were $49.51, above guidance of $44 to $46.
- Cash went back to shareholders. Free cash flow was $6,309m and adjusted free cash flow, after joint-venture and customer prepayment items, $5,696m. Sandisk bought back $5.0bn of shares and ended the quarter with $5.1bn of cash and no debt.
- Long-term contracts cover much of the next two years. About 50% of fiscal 2027 bits and two-thirds of fiscal 2028 bits are under long-term agreements that Sandisk calls NBMs. Visoso said: "Our NBM pipeline exceeds our supply throughout the end of the decade."
- A stock split is coming. Each shareholder of record on 9 November 2026 receives seven additional shares for each share held, and trading on a split-adjusted basis starts on 20 November.
- Our value: $1,972.97 a share, against a $1,075.08 close on 2 November 2026, up from $1,033.94 in our previous model. Scenarios range from $888.19, if revenue falls as in a past memory downturn, to $2,322.40; analysts' average target is $2,029.
- What to watch. Whether December-quarter revenue lands in the $12.2bn to $12.6bn range, how many more bits move under NBM contracts, the pace of NAND price rises in 2027 and whether margins hold near the 75% operating margin in Sandisk's long-term model.
Key numbers from Sandisk's Q3 2026 earnings
| Measure | Quarter to 2 Oct 2026 | Quarter to 3 Oct 2025 | Change |
|---|---|---|---|
| Revenue | $11,031m | $2,308m | +378% |
| Datacenter revenue | $4,802m | $269m | +1,685% |
| Edge revenue | $5,832m | $1,387m | +320% |
| Consumer revenue | $397m | $652m | -39% |
| GAAP gross margin | 85.0% | 29.8% | +55.2 points |
| GAAP operating income | $8,780m | $176m | n/m |
| GAAP net income | $8,101m | $112m | n/m |
| GAAP diluted earnings per share | $52.60 | $0.75 | n/m |
| Non-GAAP diluted earnings per share | $49.51 | $1.22 | n/m |
| Free cash flow | $6,309m | $438m | n/m |
Source: Sandisk fiscal first-quarter 2027 earnings release (Form 8-K, Exhibit 99.1) and SEC XBRL company facts. n/m: not meaningful.
Sandisk Q3 2026 earnings: what happened
Sandisk reported results for its first quarter of fiscal 2027 on 29 October 2026. Revenue was $11,031m, up 23% from $8,965m in the June quarter and up 378% from $2,308m a year earlier. Chief executive David Goeckeler said: "Our strategy is working, and our execution is delivering strong results."
Gross profit was $9,378m, an 85.0% GAAP margin. Operating expenses were $598m, about 5.4% of revenue, so GAAP operating income was $8,780m, a 79.6% margin. On a non-GAAP basis, which excludes items such as stock-based compensation, the gross margin was 85.1% and operating income $8,871m, an 80.4% margin.
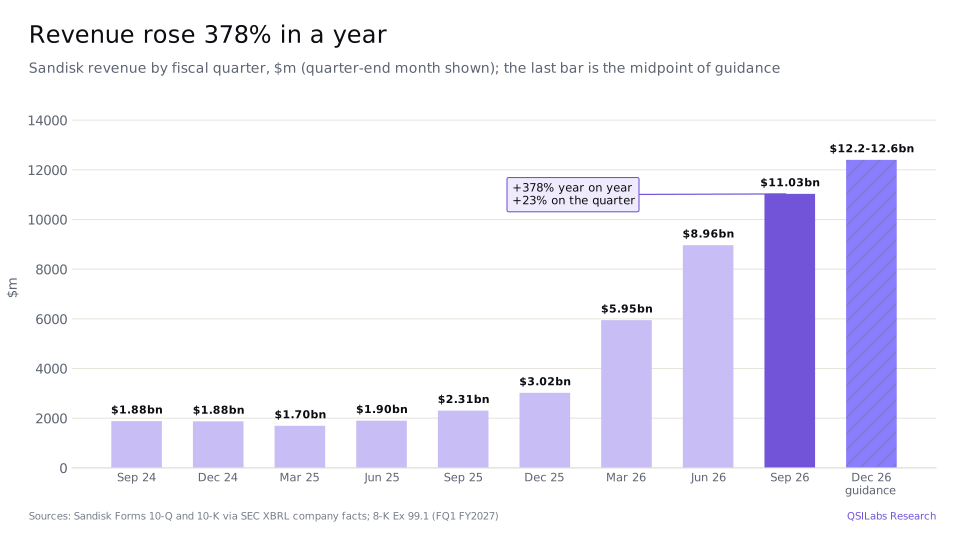
GAAP net income was $8,101m, or $52.60 a diluted share, against $0.75 a year earlier. It included a $513m gain on equity securities, mostly Sandisk's stake in the Taiwanese memory maker Nanya Technology, which was worth $2,289m at the end of the quarter. Tax was $1,218m, 13.1% of pre-tax income. Non-GAAP net income was $7,624m and non-GAAP earnings per share were $49.51, against $39.25 in the June quarter and guidance of $44 to $46.
For the December quarter, the second of fiscal 2027, Sandisk expects revenue of $12.2bn to $12.6bn, up 10.6% to 14.2% from the September quarter, and a non-GAAP gross margin of 84.5% to 85.5%, which includes what Visoso called "modest like-for-like price increases". It expects non-GAAP earnings per share of $55 to $57 on about 151m diluted shares, or $6.88 to $7.13 after the stock split.
- 21 Feb 2025Sandisk separates from Western Digital and starts trading on Nasdaq as SNDKForm 10-K
- 3 Dec 2025SNDK closes at $194.38, its 52-week closing lowYahoo Finance
- 25 Jun 2026SNDK closes at $2,335.00, its 52-week closing highYahoo Finance
- 3 Jul 2026Fiscal 2026 ends: revenue of $20.25bn, against $7.36bn in fiscal 2025Form 10-K
- 13 Aug 2026Investor Day: long-term model of mid-to-high-teens revenue growth and a non-GAAP operating margin of about 75% for fiscal 2028 to 2030Investor Day release
- 2 Oct 2026Fiscal first quarter of 2027 ends: revenue $11.03bn, datacenter $4.80bn8-K Ex 99.1
- 29 Oct 2026Results and guidance of $12.2bn to $12.6bn revenue for the December quarter; 8-for-1 stock split announced8-K; earnings call
- 30 Oct 2026Form 10-Q filed; SNDK closes at $1,150.89, down 13.5%Form 10-Q; Yahoo Finance
- 2 Nov 2026SNDK closes at $1,075.08, the price used in our valuationYahoo Finance
- 9 Nov 2026Record date for the stock split: holders receive seven additional shares for each share8-K Ex 99.1
- 20 Nov 2026Shares begin trading on a split-adjusted basis8-K Ex 99.1; earnings call
Why is datacenter revenue growing so fast?
Because AI systems need far more flash storage. Sandisk sells solid-state drives built from NAND flash memory, and Visoso said it sells to hyperscalers, AI model makers and "everybody" else in the market. Datacenter revenue was $269m in the quarter to September 2025, $2,977m in the June 2026 quarter and $4,802m in the September 2026 quarter. In fiscal 2026 as a whole it was $5,153m, against $960m in fiscal 2025.
Management said datacenter now accounts for about half of the industry's bits, up from 20% early in the decade, and expects it to be over 55% of the NAND market in calendar 2027, with datacenter bit demand growing about 40% "after more than doubling in 2026". Management expects the key-value cache that AI models use to keep context, rather than recompute it, to be about one-third of the AI datacenter flash market by the end of the decade.
The NBM contracts are what make this growth more visible than in past memory cycles. NBM stands for new business model: long-term agreements with structured volume and pricing, under which some customers pay in advance or give financial guarantees. Sandisk closed two NBMs in the quarter, had eight NBM customers at its August Investor Day and said 95% of its NBM agreements are with investment-grade companies. About 50% of fiscal 2027 bits and two-thirds of fiscal 2028 bits are covered.
Sandisk is also working on High Bandwidth Flash, or HBF, a memory for AI inference designed to complement HBM, the high-bandwidth DRAM that AI processors use, by bringing flash capacity closer to the processor. It completed the tape-out of its first HBF memory die in the quarter and expects to deliver samples next calendar year. Sandisk said HBF is not included in its long-term financial model, and it is not in ours.
What happened to edge and consumer revenue?
Edge revenue, flash sold for PCs, phones and other devices, rose 7% on the quarter to $5,832m and 320% on the year. Sandisk said this reflected resilience in premium and mainstream markets, partly offset by contraction at the lower end. Management expects unit sales at the low end to decline slightly next year, but said Sandisk's internal models show every segment of the NAND market, PCs, smartphones and datacenter, growing in exabytes because content per device keeps rising.
Consumer revenue fell 29% on the quarter to $397m and 39% on the year. It is now 3.6% of revenue, against 28.2% a year earlier.
How high can Sandisk's margins go?
They are already higher than Sandisk's own long-term model. The GAAP gross margin rose from 29.8% a year earlier to 50.9% in the December 2025 quarter, 78.4% in March, 84.6% in June and 85.0% in September. In its Investor Day release on 13 August 2026 Sandisk set a long-term model for fiscal 2028 to 2030 of revenue growth in the mid-to-high teens, "consistent with bit growth", a non-GAAP gross margin of about 80%, operating expenses of about 5% of revenue, a non-GAAP operating margin of about 75% and an adjusted free cash flow margin of about 50%.
Margins this high come from prices. NAND is a commodity and its price has swung widely in past cycles. Sandisk's fiscal 2025 shows the other side: revenue of $7,355m and an operating loss of $1,377m, which included a goodwill impairment. TrendForce estimated in May 2026 that the NAND flash market would grow 280.7% in 2026 to $270.6bn and that total memory revenue would rise 44% in 2027 to over $1.28tn. Goeckeler said Sandisk remains committed to bit growth in the mid-to-high teens and has not changed its fab plan to chase short-term demand, which limits the risk of oversupply from Sandisk itself.
How much free cash flow does Sandisk generate?
A lot, and very little of it goes back into fabs on Sandisk's own balance sheet. Cash flow from operations was $6,363m in the quarter and purchases of property, plant and equipment only $54m, so free cash flow was $6,309m. Over the past four quarters free cash flow was $17,365m.
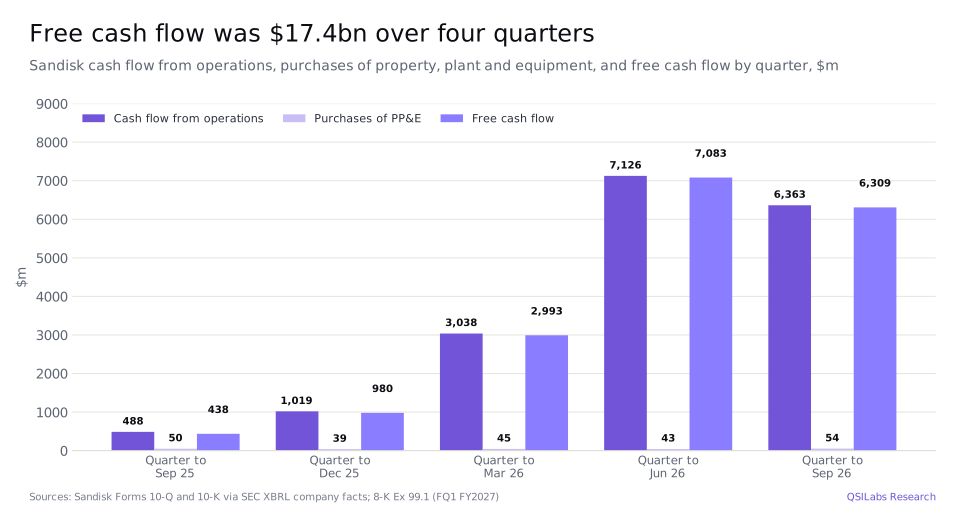
The small capital spending figure reflects how Sandisk makes its chips: most of its flash comes from Flash Ventures, three business ventures with Kioxia that run eight manufacturing facilities in Japan. Sandisk reports gross capital spending, including its share of the joint ventures, of $378m in the quarter, 3.4% of revenue, and guides to a mid-single-digit percentage of revenue for fiscal 2027. Adjusted free cash flow, which deducts $148m for Flash Ventures and $465m of NBM prepayments, was $5,696m, or 51.6% of revenue, against $5,035m in the June quarter.
Sandisk bought back $5.0bn of shares, 3.2m shares, in the quarter and about 6.0m shares, roughly 4% of the total, over two quarters. Its long-term model returns 100% of excess cash to shareholders. It ended the quarter with $5,136m of cash and no debt.
How has SNDK stock performed in 2026?
Very well, then badly. SNDK closed 2025 at $237.38. It reached a 52-week closing high of $2,335.00 on 25 June 2026, almost ten times that level, then fell to $1,214.83 at the end of July, recovered to $1,739.89 at the end of September and closed October at $1,150.89. After the results it fell 13.5% on 30 October and 6.6% on 2 November, to $1,075.08, 54.0% below the June high but still up 352.9% for the year. Its 52-week closing low was $194.38 on 3 December 2025.
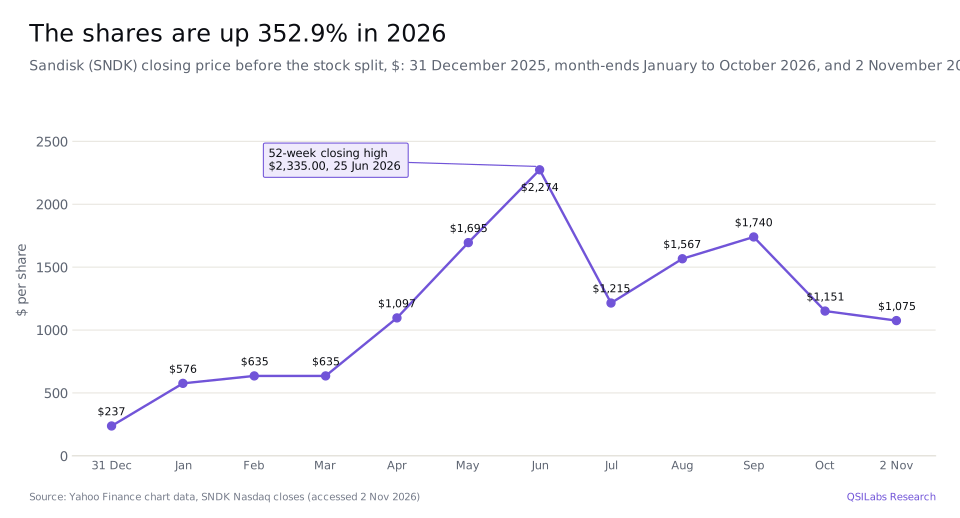
The fall came even though results and guidance beat expectations, and Fox Advisors downgraded the shares to Hold on 2 November. The size of the swings shows how uncertain investors are about how long memory prices will stay this high, rather than about the latest quarter.
Sandisk stock Q3 2026: is SNDK undervalued?
On our numbers, yes, but the answer depends on one question: how many years of very high margins you believe. Our discounted cash flow model values Sandisk at $1,972.97 a share, about 1.8 times the $1,075.08 close on 2 November 2026. At that price, on 151m diluted shares, the equity was worth about $162.3bn and the enterprise value, after deducting $5.1bn of cash and the $2.3bn Nanya stake, about $154.9bn. That is 7.4 times the $21.0bn of GAAP operating income Sandisk earned over the past four quarters, and the price is 4.7 times consensus fiscal 2027 earnings per share of $227.80.
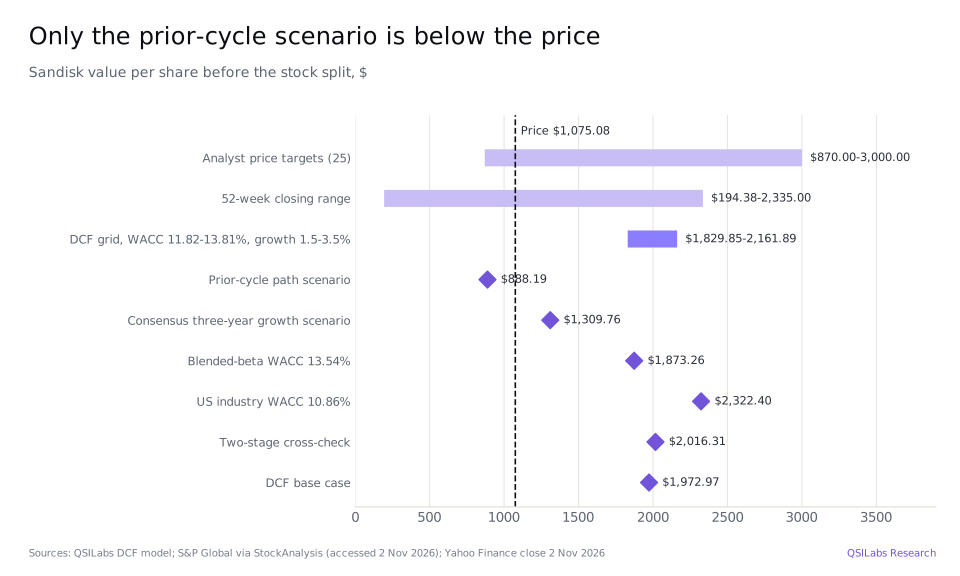
Our enterprise value is $287.9bn. Most of it, $204.9bn, comes from the cash flows we forecast to fiscal 2036; the terminal value after that is only 28.8%. So the result depends on the next five to eight years, not on the long run. A price of $1,075.08 is consistent with a downturn starting around fiscal 2029, between our consensus scenario at $1,309.76 and the prior-cycle scenario at $888.19.
Method
We discount forecast unlevered free cash flow at a cost of capital of 12.81%. This is a cost of equity alone, since Sandisk has no debt: a 5.12% risk-free rate plus a beta of 1.42, the global Computers/Peripherals industry beta from Damodaran with no debt to relever it, times an equity risk premium of 5.42%. The premium is weighted by where Sandisk earned revenue in fiscal 2026: 70.3% in Asia, at 5.72%; 21.1% in the Americas, at the US rate of 4.46%; and 8.6% in Europe, the Middle East and Africa, at about 5.3%. After fiscal 2036 we assume growth of 2.5% a year. Adding cash of $5.14bn, the $2.29bn Nanya stake and $2.56bn of cash we estimate Sandisk generated between 2 October and 2 November gives equity value of $297.9bn, or $1,972.97 a share on 151m diluted shares.
For fiscal 2027 we use the S&P Global consensus revenue of $49.56bn, up 144.8%. We take the $11.03bn reported for the first quarter and assume an operating margin of 79.17% for the rest of the year, the margin implied by GAAP guidance for the December quarter, giving 79.3% for the year. For fiscal 2028 we use consensus revenue of $60.59bn, up 22.3%. From fiscal 2029 to 2030 revenue grows 16.5% a year, the middle of the mid-to-high-teens range in Sandisk's long-term model. Growth then fades in equal steps to 2.5% in fiscal 2035. TrendForce's 44% growth in total memory revenue in 2027 supports the near years, but no public forecast we read goes beyond 2027.
The GAAP operating margin is 73.6% from fiscal 2028 to 2030: Sandisk's 75% non-GAAP target less the 1.4-point gap between its GAAP and non-GAAP guidance for the December quarter. From fiscal 2031 it falls in equal steps to 29.35% in fiscal 2035, our estimate of a mid-cycle margin, and stays there. Tax is 14.3%, the rate Sandisk guides to for the December quarter. Capital spending is 5% of revenue, $2.48bn in fiscal 2027, in line with the mid-single-digit guidance and the $2.5bn to $3bn an analyst on the call said it implies. Working capital rises with 25% of each extra dollar of revenue.
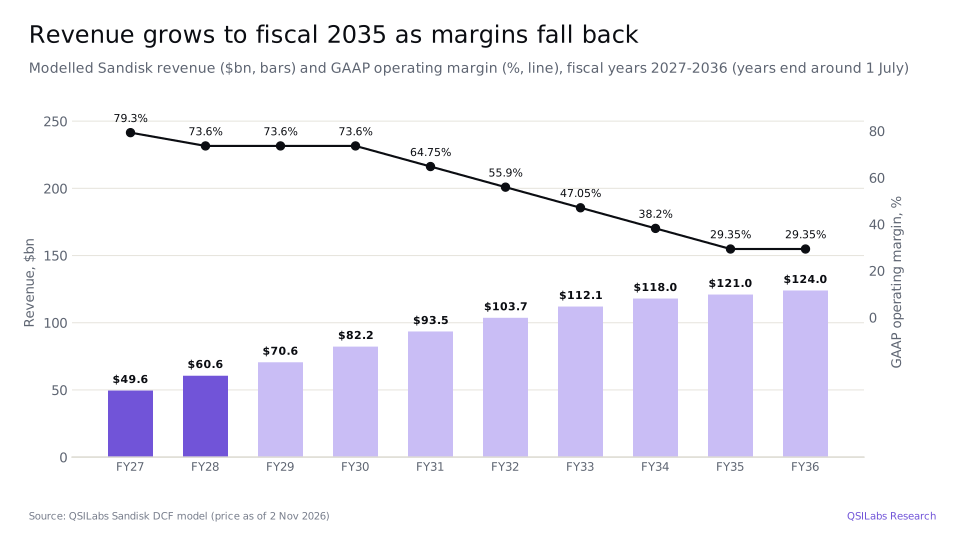
We forecast unlevered free cash flow of $24.1bn in fiscal 2027, $32.7bn in fiscal 2028 and $45.4bn in fiscal 2030, falling to $25.1bn in fiscal 2035 as margins come down; only the part of fiscal 2027 after 2 November is discounted. Free cash flow in fiscal 2028 is 53.9% of revenue, slightly above the roughly 50% adjusted free cash flow margin in Sandisk's model.
Our previous model, dated 20 October at a price of $1,365.38, gave $1,033.94. It assumed a past-style memory downturn: revenue growth of 18.9% in fiscal 2028, then falls of 36.3% in fiscal 2029 and 13.0% in fiscal 2030, taking revenue to $32.4bn, with the operating margin dropping from 68.7% in fiscal 2028 to 29.35% by fiscal 2032. That path came from neither consensus nor company guidance, so we replaced it with the consensus and long-term model path above, which has revenue of $82.2bn in fiscal 2030. We also raised the cost of capital from 10.86%, the US industry rate, to 12.81%, because most of Sandisk's revenue comes from Asia.
How the number moves if you argue with us
The table shows our value per share at different costs of capital and terminal growth rates. Because the terminal value is a small part of the total, the range is narrow: from $1,829.85 to $2,161.89.
| Cost of capital | Growth 1.5% | Growth 2.0% | Growth 2.5% | Growth 3.0% | Growth 3.5% |
|---|---|---|---|---|---|
| 11.82% | $2,112.20 | $2,123.10 | $2,134.90 | $2,147.77 | $2,161.89 |
| 12.31% | $2,032.34 | $2,040.89 | $2,050.08 | $2,060.01 | $2,070.80 |
| 12.81% | $1,959.20 | $1,965.87 | $1,972.97 | $1,980.57 | $1,988.75 |
| 13.31% | $1,891.94 | $1,897.09 | $1,902.52 | $1,908.26 | $1,914.38 |
| 13.81% | $1,829.85 | $1,833.77 | $1,837.85 | $1,842.12 | $1,846.61 |
The forecast path matters far more. If we keep the old downturn path, with today's balance sheet and cost of capital, the value is $888.19, below the share price. If revenue follows S&P Global's three-year forecast, which implies almost no growth in fiscal 2029, then grows 5% in fiscal 2030, slowing to 2.5% by fiscal 2035, while margins fall to 29.35% by fiscal 2033, the value is $1,309.76. A two-stage version of the model gives $2,016.31. Using the US industry cost of capital of 10.86% instead of the revenue-weighted rate gives $2,322.40, and a blended beta that gives 13.54% gives $1,873.26.
Two checks point lower. A semiconductor beta instead of the computers and peripherals beta would raise the cost of capital to about 15.0%, above every row in the table, and lower the value. And Sandisk earned 29.5% of its revenue in the Americas in the latest quarter, against 21.1% in fiscal 2026; that would lower the rate slightly, but the exposure to Asian customers and manufacturing in Japan stays high.
Our value and the market price can both be right only if NAND prices fall sharply within two or three years, as they have in past cycles. Sandisk's long-term contracts, the shift of demand to datacenters and its limited capacity growth argue against an early downturn. The share price says investors are not yet convinced.
Risks to the Sandisk investment case
- Memory prices. About 40% of the recent revenue increase came from higher prices. NAND prices have fallen sharply in past cycles, and fiscal 2025 brought an operating loss of $1,377m.
- Customer concentration. Sales to the top ten customers were 44% of revenue in fiscal 2026, and datacenter growth depends on a few hyperscalers and AI companies continuing to spend.
- Supply from rivals. Sandisk is holding bit growth to the mid-to-high teens, but competitors could add more capacity, which would push prices down.
- Joint venture and Asia exposure. Most of Sandisk's flash comes from Flash Ventures, its ventures with Kioxia in Japan, and 65.4% of revenue in the latest quarter came from Asia. Trade policy, tariffs or problems at the joint venture would hit supply or demand.
- Margins above the long-term model. The 79.6% operating margin is above the 75% in Sandisk's own model. Our forecast assumes 73.6% for three years before falling; an earlier fall would cut the value quickly.
- Valuation risk. The value depends far more on the forecast path than on the cost of capital: a downturn like the one in our previous model gives $888.19, below the share price.
FAQ
What value does QSILabs put on Sandisk stock?
Our discounted cash flow model gives $1,972.97 a share before the stock split, or about $246.62 after it, against a $1,075.08 close on 2 November 2026. Across costs of capital from 11.82% to 13.81% and terminal growth from 1.5% to 3.5% the value ranges from $1,829.85 to $2,161.89. If revenue follows a past-style memory downturn, the value falls to $888.19.
Should I buy Sandisk stock after its latest results?
We do not give personal advice. On our numbers the shares trade below the value of their cash flows, and the quarter showed fast growth, very high margins and strong cash generation. The case depends on NAND prices and margins staying high for several more years, so read the risks above before deciding.
Why did Sandisk shares fall after beating guidance?
SNDK fell 13.5% on 30 October and 6.6% on 2 November, although revenue, margins and earnings per share were above guidance. The company did not explain the move, and neither can we with certainty. The shares had already risen almost tenfold in the first half of 2026 and fell by almost half in July, which shows how much investors worry about how long high memory prices will last.
When does the Sandisk 8-for-1 stock split happen?
Shareholders of record at the close of business on 9 November 2026 receive seven additional shares for each share held. Sandisk expects to distribute the new shares after the close on 19 November, and the shares start trading on a split-adjusted basis on 20 November 2026. Guidance of $55 to $57 earnings per share equals $6.88 to $7.13 after the split.
What price target do analysts have for SNDK?
The 25 analysts tracked by S&P Global have an average target of $2,029, about 89% above the $1,075.08 close on 2 November 2026, with a median of $2,000, a low of $870 and a high of $3,000. Their consensus rating is Buy. Fox Advisors downgraded the shares to Hold on 2 November.
What is a Sandisk NBM agreement?
NBM stands for new business model. These are long-term partnership agreements with customers that set volumes and pricing, sometimes backed by prepayments or financial guarantees. Sandisk had eight NBM customers at its August 2026 Investor Day, said 95% of its NBM agreements are with investment-grade companies, and covers about half of fiscal 2027 bits and two-thirds of fiscal 2028 bits with them.
How much of Sandisk's revenue comes from AI datacenters?
Datacenter revenue was $4,802m in the quarter to 2 October 2026, 43.5% of the total, against 11.7% a year earlier. Sandisk reports datacenter revenue as a whole rather than an AI figure, but management said AI is driving the growth and that it sells to three US hyperscalers and to AI model makers.
Does Sandisk have any debt?
No. Sandisk had $5,136m of cash and no debt at 2 October 2026. It also held a stake in Nanya Technology worth $2,289m. Customer prepayments under NBM contracts are part of its cash, but Visoso said the vast majority of NBM support takes the form of financial guarantees held by third-party financial institutions, which are not on its balance sheet.
Who runs Sandisk?
David Goeckeler is chairman and chief executive of Sandisk, and Luis Visoso is chief financial officer. Sandisk became an independent company when it separated from Western Digital on 21 February 2025.
Sources
- Sandisk Corporation, first-quarter fiscal 2027 results (Form 8-K, Exhibit 99.1, 29 Oct 2026; accession 0001628280-26-068243) www.sec.gov
- Sandisk Corporation, Form 10-Q for the quarter ended 2 Oct 2026 (filed 30 Oct 2026; accession 0001628280-26-068601) www.sec.gov
- Sandisk Corporation, Form 10-K for the fiscal year ended 3 Jul 2026 (accession 0001628280-26-057406) www.sec.gov
- SEC XBRL company facts for Sandisk Corporation (CIK 2023554): quarterly revenue, gross profit, operating income and cash flow from Forms 10-Q and 10-K data.sec.gov
- Sandisk fiscal Q1 2027 earnings call transcript, 29 Oct 2026 (The Motley Fool; accessed 2 Nov 2026) www.fool.com
- Sandisk, Investor Day release on its growth strategy and long-term financial model, 13 Aug 2026 (accessed 2 Nov 2026) investor.sandisk.com
- StockAnalysis: Sandisk forecast and analyst ratings, S&P Global data (accessed 2 Nov 2026) stockanalysis.com
- StockAnalysis: Sandisk statistics (accessed 2 Nov 2026) stockanalysis.com
- TrendForce, memory market revenue forecast press release, 29 May 2026 www.trendforce.com
- Yahoo Finance chart data: SNDK closing prices (November 2025 to November 2026) query1.finance.yahoo.com
- Damodaran Online, January 2026 datasets: global industry betas, US industry cost of capital and country risk premiums (house copies in the QSILabs model)
- QSILabs Sandisk discounted cash flow model (internal; price as of 2 Nov 2026)
Disclaimer
This article is for information only and is not investment advice, a recommendation or an offer to buy or sell any security. QSI Labs and its authors may hold positions in the securities discussed. Forecasts and valuations are estimates that depend on assumptions that may prove wrong. Figures are taken from company filings and third-party sources believed to be reliable, but we do not guarantee their accuracy. Do your own research or consult a licensed adviser before investing.
More from QSI Labs
Related analysis: Micron stock Q3 2026: HBM and memory, Dell stock Q3 2026: AI servers, Lam Research stock Q3 2026: memory equipment and Applied Materials stock Q3 2026.
Read our white paper, QSI Labs: An AI-Native Trading Firm Built on a Training Loop (October 2026), available on request, or browse the research index.