Research / Earnings and valuation
Lam Research Stock Q3 2026:Revenue Up 54% to $8.2bn on Memory and AI Demand
As of: Figures are as of Lam Research's fiscal Q1 FY2027 results (the quarter ended 27 September 2026, reported 21 October 2026 in a Form 8-K) and its Form 10-Q for that quarter, filed 22 October 2026. Lam's fiscal year ends on the last Sunday of June, so fiscal Q1 FY2027 covers July to September 2026, the same months as calendar Q3 2026. The share price used in our valuation is the Nasdaq close of LRCX on 30 October 2026, $239.11; analyst data were accessed on 2 November 2026. Published 2 November 2026.
The short answer. Lam Research stock Q3 2026 rests on the company's fiscal Q1 FY2027, the quarter to 27 September 2026, which covers the same July-to-September months as calendar Q3. Revenue rose 54% to $8.22bn, GAAP operating margin reached 40.0% and diluted EPS rose 77% to $2.19, as chipmakers spent more on wafer fabrication equipment for AI-driven memory and foundry capacity. China supplied 35% of revenue, down from 43% a year earlier, while Korea's revenue more than doubled. Lam guided December-quarter revenue to $8.60bn, plus or minus $0.40bn. Our discounted cash flow model values LRCX at $111.41 a share, against a $239.11 close on 30 October 2026. The business is earning record profits, in the company's words; the share price assumes those profits keep growing for longer, and fade less, than we expect from a cyclical equipment maker.
Key takeaways
- Revenue up 54%. Fiscal Q1 FY2027 revenue was $8,219m, up from $5,324m a year earlier and $6,722m in the June quarter. Systems revenue rose 62% to $5,733m; customer support-related revenue and other rose 40% to $2,487m.
- Margins widened. GAAP gross margin was 52.3%, against 50.4% a year earlier, and GAAP operating margin 40.0%, against 34.4%. Net income rose 76% to $2,753m.
- Memory and Korea led. Memory customers took 46% of equipment and upgrade revenue, up from 34% a year earlier. Revenue from Korea rose 110% to $1,634m.
- China's share fell. China revenue rose 26% to $2,886m but fell to 35% of the total from 43%; it had been 26% in the June quarter.
- Cash flow doubled. Operating cash flow was $3,498m and operating cash flow less capital spending $3,240m, against $1,594m a year earlier. Lam spent $1,025m on buybacks and $325m on dividends, and raised the quarterly dividend to $0.33 from $0.26.
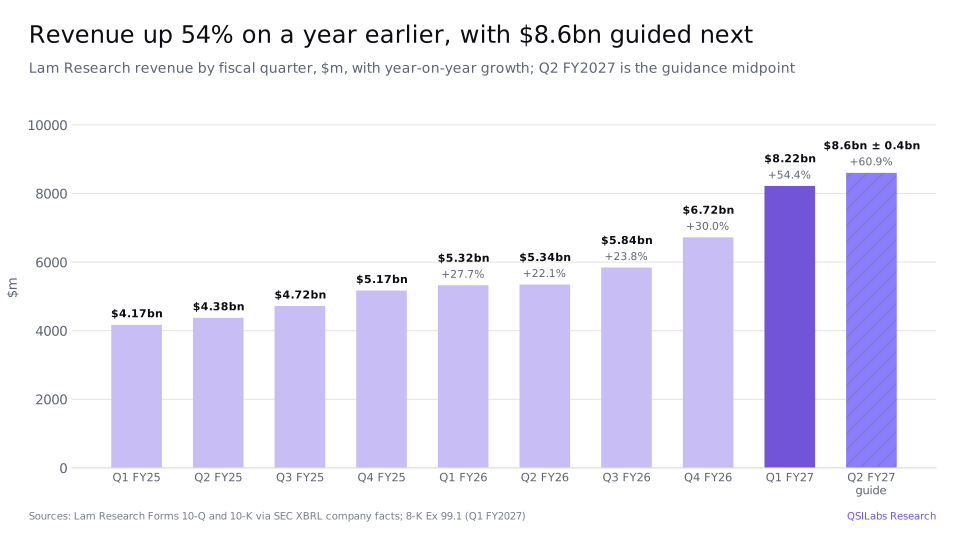
- Guidance. For the quarter to 27 December 2026 Lam expects revenue of $8.60bn plus or minus $0.40bn, a gross margin of 52.5%, an operating margin of 40.5% and EPS of $2.33 plus or minus $0.15. The midpoint is 61% above the December 2025 quarter.
- Our value: $111.41 a share, about 53% below the $239.11 close on 30 October 2026. A two-stage cross-check gives $114.21; analysts' average target is $364.03.
- What to watch. Whether wafer fabrication equipment spending holds up into 2027, how China revenue moves under US export controls, and whether margins stay near 40% as revenue growth slows.
Key numbers from Lam Research's Q1 FY2027 earnings
| Metric | Q1 FY2027 (Sep 2026) | Q1 FY2026 (Sep 2025) | Change |
|---|---|---|---|
| Revenue | $8,219m | $5,324m | +54% |
| Systems revenue | $5,733m | $3,548m | +62% |
| Customer support-related revenue and other | $2,487m | $1,777m | +40% |
| GAAP gross margin | 52.3% | 50.4% | +1.9 pts |
| GAAP operating income | $3,284m | $1,829m | +80% |
| GAAP operating margin | 40.0% | 34.4% | +5.6 pts |
| GAAP net income | $2,753m | $1,569m | +76% |
| Diluted EPS (GAAP) | $2.19 | $1.24 | +77% |
| China share of revenue | 35% | 43% | -8 pts |
| Memory share of equipment revenue | 46% | 34% | +12 pts |
| Operating cash flow | $3,498m | $1,779m | +97% |
| Operating cash flow less capital spending | $3,240m | $1,594m | +103% |
| Cash and cash equivalents (period end) | $7,437m | $6,693m | +11% |
Lam Research Q1 FY2027 earnings: what happened
Lam Research, the Fremont, California maker of the etch, deposition and clean machines used to build chips, reported results for its fiscal first quarter, the three months to 27 September 2026, on 21 October, and filed its Form 10-Q the next day. Its fiscal year ends on the last Sunday of June, so fiscal Q1 FY2027 lines up with calendar Q3 2026.
Revenue was $8,219m, up 22% from $6,722m in the June quarter and 54% from $5,324m a year earlier. Year-on-year growth, which had been 27.7%, 22.1%, 23.8% and 30.0% across the four quarters of fiscal 2026, accelerated to 54.4%. Revenue also came in above the $8.13bn that analysts expected before the release, according to Investing.com's pre-release consensus.
"With AI driving higher semiconductor demand and greater device complexity, our focus on operational execution helped Lam deliver record revenue, profit, and earnings per share in the September quarter," chief executive Tim Archer said in the results release. He added that the company's investments in technology inflections and manufacturing capacity were "strengthening our ability to outgrow the wafer fabrication equipment market as the industry expands".
Profit grew faster than revenue. GAAP gross margin, revenue less the cost of goods sold, was $4,299m, or 52.3% of revenue, against 51.7% in the June quarter and 50.4% a year earlier; the 10-Q attributes the improvement to favourable customer and product mix and to efficiencies from higher volumes. Operating expenses rose 19% from a year earlier to $1,015m, much more slowly than revenue: research and development was $666m, 8.1% of revenue against 10.8%, and selling, general and administrative costs were $349m. GAAP operating income was $3,284m, up 80%, a 40.0% margin.
Net income was $2,753m, or $2.19 a diluted share, against $1,569m, or $1.24, a year earlier; the effective tax rate rose to 16.9% from 15.6%. Non-GAAP EPS, which excludes a small number of items such as an $11.5m tax charge from a change in US tax law, was $2.20, against $1.82 in the June quarter, and above the pre-release consensus of $2.18. Diluted shares averaged 1,255.8m, down from 1,269.3m a year earlier because of buybacks.
- 20 Nov 2025LRCX closes at $139.59, its 52-week closing lowYahoo Finance
- Mar 2026$750m of senior notes mature and are repaid, lowering interest expenseForm 10-Q
- 28 Jun 2026Fiscal 2026 ends: revenue $23.23bn (+26%), GAAP operating income $8.20bnSEC XBRL (Form 10-K)
- 30 Jun 2026LRCX closes at $433.33, its 52-week closing highYahoo Finance
- Jul-Sep 2026Lam enters $1.0bn of accelerated share repurchase agreements, taking initial delivery of about 2.3m sharesForm 10-Q
- 23 Sep 2026Shares go ex-dividend for the $0.33 quarterly dividend, up from $0.26Form 10-Q; Yahoo Finance
- 27 Sep 2026Fiscal Q1 FY2027 ends: revenue $8,219m (+54%), GAAP operating margin 40.0%8-K Ex 99.1
- 21 Oct 2026Q1 FY2027 results and Q2 guidance of $8.60bn revenue; LRCX closes at $260.818-K Ex 99.1; Yahoo Finance
- 22 Oct 2026Form 10-Q filed; LRCX closes at $230.15, down 11.8% on the dayForm 10-Q; Yahoo Finance
- 30 Oct 2026LRCX closes at $239.11 on Nasdaq, the price used in our valuationYahoo Finance
- 2 Nov 2026LRCX closes at $227.56; Bernstein keeps a Buy rating and a $350 targetYahoo Finance; StockAnalysis
- 27 Dec 2026Fiscal Q2 FY2027 ends; the September 2026 ASRs are expected to settle by then8-K Ex 99.1; Form 10-Q
Why did Lam Research's systems revenue jump?
Lam reports two kinds of revenue. Systems revenue is the sale of new leading-edge equipment for deposition, etch, clean and other wafer fabrication steps. Customer support-related revenue and other covers services, spare parts, upgrades and non-leading-edge equipment sold under its Reliant product line.
Systems revenue was $5,733m in the September quarter, up $1.48bn, or 35%, from the June quarter, and up 62% from $3,548m a year earlier. The 10-Q says the sequential rise was "predominantly driven by increases in foundry as well as memory equipment spending", and the year-on-year rise by "higher levels of semiconductor demand leading to increased investments in both memory and non-memory market segments".
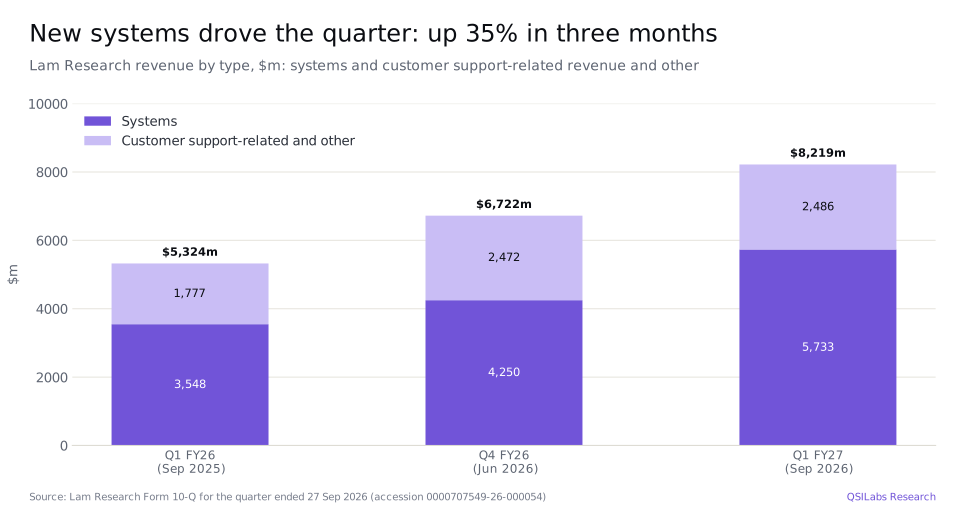
Customer support-related revenue and other was $2,487m, almost unchanged from $2,472m in the June quarter but 40% higher than a year earlier, which Lam puts down to customer investments in non-leading-edge equipment and higher spares revenue. This part of the business follows the installed base of Lam tools in customers' factories, so it tends to be steadier than systems sales through the industry cycle. It made up 30% of revenue in the quarter, down from 33% a year earlier, because systems grew so much faster.
Two balances give a sense of the work already in hand. Deferred revenue rose to $2.66bn at 27 September from $2.43bn at the end of June, mainly because of higher sales volume, partly offset by lower customer down payments. Shipments to customers in Japan, which are not counted as revenue until the customer accepts them, represented about $468.3m of estimated future revenue, against $490.2m in June.
How much of Lam Research's revenue comes from China?
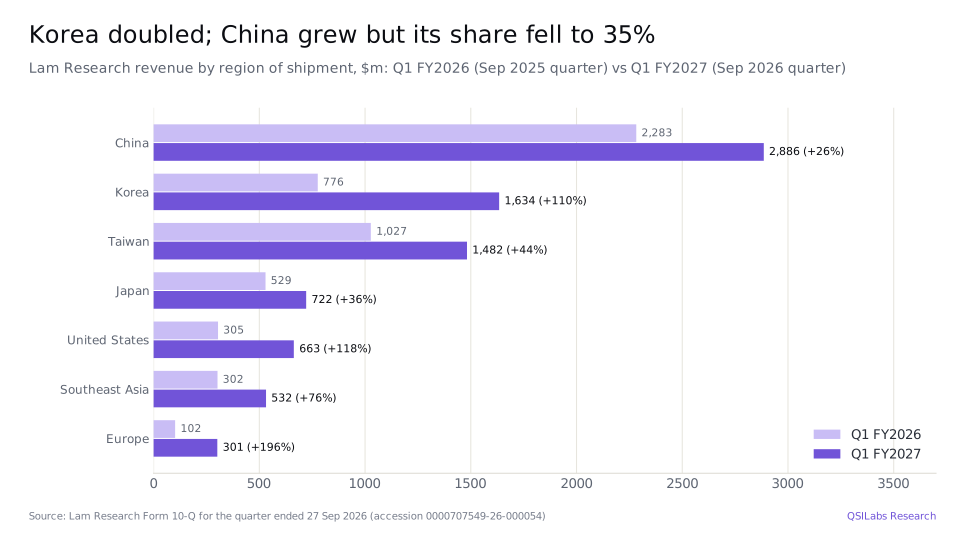
China is still Lam's largest market, but it is a smaller share than a year ago. Revenue shipped to customers in China was $2,886m in the September quarter, 35% of the total, up 26% from $2,283m, which was 43% of revenue a year earlier. In the June quarter China had been 26% of revenue. The 10-Q links the swing to "the timing of mature node investments within the China region", which also lifted the foundry share of equipment revenue in the quarter.
Every other region grew faster than China from a year earlier. Korea, home to Samsung and SK hynix, rose 110% to $1,634m, 20% of revenue. Taiwan rose 44% to $1,482m, 18% of revenue, though its share fell from 27% in the June quarter. Japan rose 36% to $722m, the United States 118% to $663m, Southeast Asia 76% to $532m and Europe 196% to $301m.
China matters for the investment case because of US export controls. The 10-Q's risk factors list "trade regulations, export controls (including entity listings, end use/user controls, technology controls, and foreign direct product rules), tariffs, trade disputes, and other geopolitical developments" as factors that "may inhibit our ability to sell our products or services". A wider spread of revenue across Korea, Taiwan and the United States reduces Lam's dependence on any one country, but China still supplied more than a third of sales in the quarter.
Is memory spending driving Lam Research's growth?
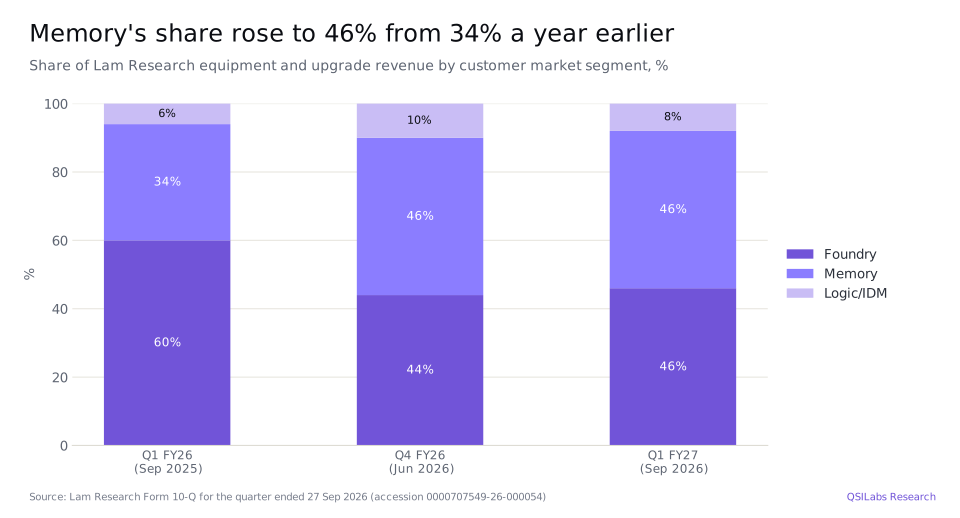
Yes, more than a year ago. Lam splits its equipment and upgrade revenue by customer type. Memory makers, which build DRAM, high-bandwidth memory and NAND flash, took 46% in the September quarter, the same as in June and up from 34% a year earlier. Foundries, which make chips to other companies' designs, took 46%, against 44% in June and 60% a year earlier. Logic and integrated device manufacturers took 8%.
The 10-Q says both foundry and memory revenue rose in dollars from a year earlier, "with the increase in the memory market segment revenue exceeding that of the foundry market segment". That fits the wider industry: AI accelerators use large amounts of high-bandwidth memory, and memory chips with more layers and more complex structures need more etch and deposition steps, Lam's core markets. Our Micron stock Q3 2026 analysis covers the memory boom from a chipmaker's side.
The 10-Q describes the backdrop plainly: "Wafer fabrication equipment investments have continued to grow in 2026 with the AI market driving higher semiconductor industry spending across both the memory and non-memory market segments." Over the longer term Lam expects 3D device scaling, multiple patterning and advanced packaging to raise demand for its deposition, etch and clean tools. It also warns that these trends "remain subject to volatility in the semiconductor industry environment from trade restrictions and tariffs".
Equipment demand is cyclical. Lam's revenue fell 14.5% in fiscal 2024, to $14.91bn, when memory makers cut spending, before rising 23.7% in fiscal 2025 and 26.0% in fiscal 2026, to $23.23bn. Our Applied Materials stock Q3 2026 analysis looks at the same cycle at Lam's largest US rival.
How profitable is Lam Research now?
More profitable than at any point in the last nine quarters. GAAP operating margin rose from 30.3% in Q1 FY2025 to 34.4% a year ago, 37.4% in the June quarter and 40.0% in the September quarter; the non-GAAP operating margin was 40.2%. Gross margin rose from 48.0% to 52.3% over the same period.
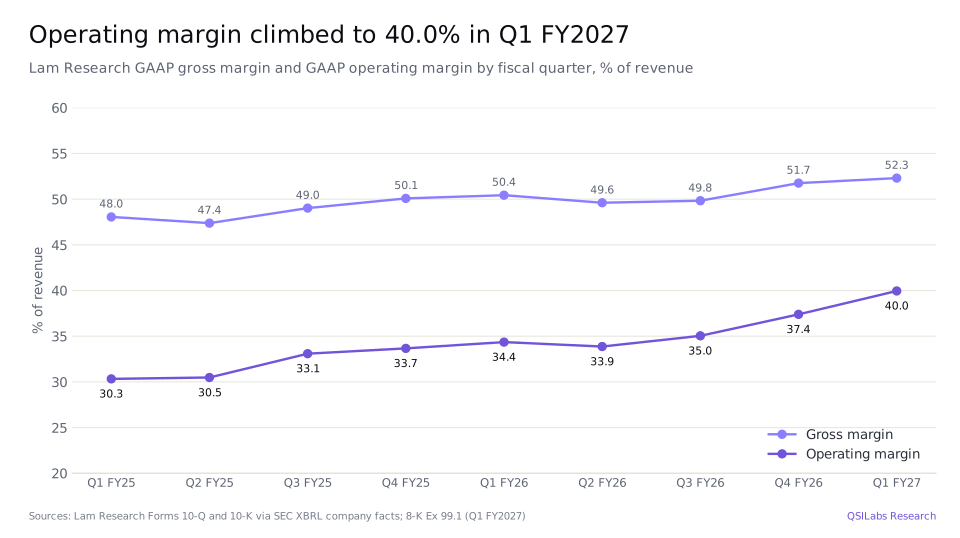
Two things drove the improvement. First, operating leverage: revenue rose 54% from a year earlier while operating expenses rose 19%, so research and development fell to 8.1% of revenue from 10.8% and selling and administrative costs to 4.2% from 5.2%. Second, mix: the 10-Q credits favourable customer and product mix for the higher gross margin. Equity-based compensation was $115m, 1.4% of revenue, so the gap between GAAP and non-GAAP profit is small at Lam, unlike at many technology companies.
Lam guided a gross margin of 52.5% and an operating margin of 40.5% for the December quarter, each plus or minus one point, so the company expects margins to hold near current levels. Over a full cycle they have been lower: GAAP operating margin was 28.6% in fiscal 2024 and 32.0% in fiscal 2025, on SEC XBRL data, and 35.3% in fiscal 2026.
How much cash does Lam Research return to shareholders?
Lam generated $3,498m of operating cash flow in the September quarter, against $1,779m a year earlier, helped by $535m of cash released from working capital. Capital expenditure and intangible assets took $258m, leaving operating cash flow less capital spending of $3,240m, about twice the $1,594m of a year earlier.
It returned $1,350m of that, about 42%. Treasury stock purchases, including excise tax, were $1,025m, and dividends paid were $325m. During the quarter Lam entered into $1.0bn of accelerated share repurchase agreements with two banks, taking initial delivery of about 2.3m shares; the agreements are expected to settle fully by the end of December. Including those, it bought about 2.3m shares in the quarter and had $3,032m of buyback authorisation left at 27 September.
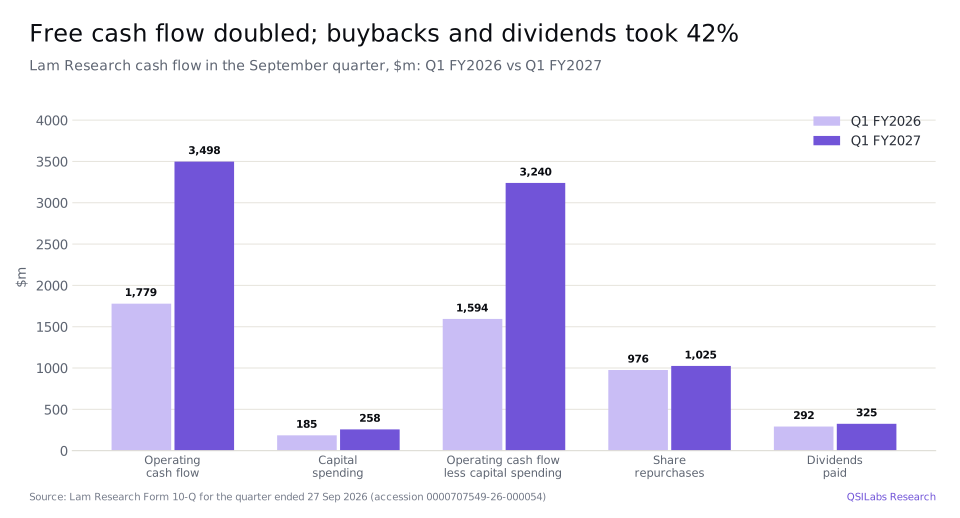
The dividend went up. Lam declared $0.33 a share in the September quarter, up 27% from $0.26, for a total of $412m that was payable after the quarter end. At $1.32 a year, the dividend yields about 0.6% at the 30 October price. The share count is falling slowly: 1,249.1m shares were outstanding on 20 October 2026, against 1,268.7m at the end of June 2025.
The balance sheet is conservative. Cash and cash equivalents were $7,437m at 27 September against total debt of about $3.74bn, which is net cash of about $3.70bn. Lam repaid $750m of senior notes when they matured in March 2026, which cut interest expense to $37m in the quarter from $42m a year earlier. Shareholders' equity was $13.9bn. Headcount was about 24,300.
What did Lam Research guide for Q2 FY2027?
For the quarter ending 27 December 2026, Lam expects:
- revenue of $8.60bn, plus or minus $400m;
- GAAP gross margin of 52.5%, plus or minus one point;
- GAAP operating margin of 40.5%, plus or minus one point;
- GAAP EPS of $2.33, plus or minus $0.15, on 1.253bn diluted shares.
The non-GAAP figures are almost identical, because the reconciling items are only about $3m. The revenue midpoint is 4.6% above the September quarter and 60.9% above the $5,345m of the December 2025 quarter; EPS of $2.33 would be 85% above the $1.26 of a year earlier. Before the release, analysts tracked by Investing.com had expected $8.54bn and $2.32 for the December quarter, so the guidance was slightly above consensus.
Adding the September quarter to the guided December quarter gives about $16.8bn for the first half of fiscal 2027. The consensus forecast for the full year, $35.39bn according to S&P Global data on StockAnalysis, implies about $18.6bn in the second half, or roughly $9.3bn a quarter. Lam gives guidance only one quarter ahead.
Why did Lam Research stock fall after earnings?
LRCX closed at $260.81 on 21 October, the day of the results, and fell 11.8% the next day to $230.15, even though revenue, EPS and guidance were all a little above consensus. Lam's filings do not explain share price moves, and we do not attribute the fall to any one cause. The shares recovered to $239.11 by 30 October and closed at $227.56 on 2 November.
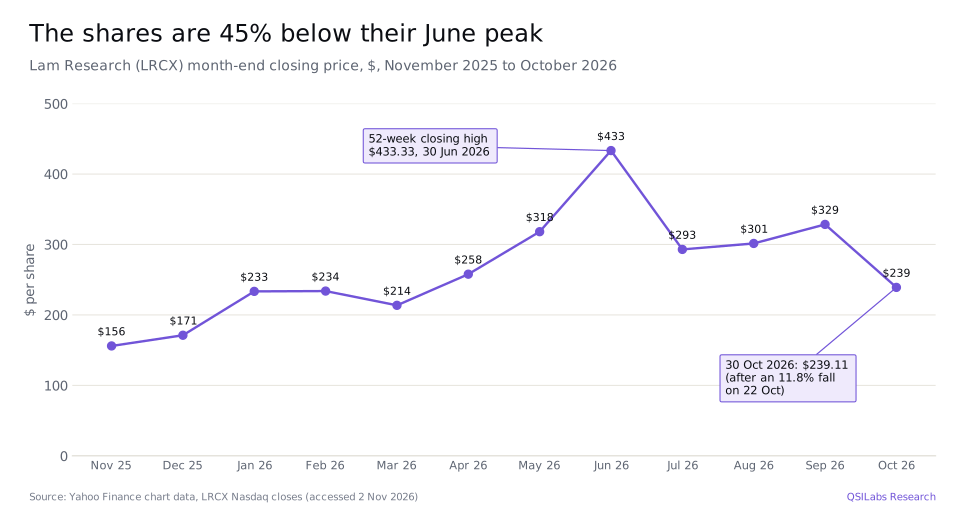
The post-results fall was part of a bigger move. LRCX rose from a 52-week closing low of $139.59 on 20 November 2025 to a closing high of $433.33 on 30 June 2026, then fell to $239.11, 44.8% below the high. It was still up 48% from $161.24 a year earlier. Daily moves of 6% or more were common through 2026, which shows how sensitive the shares are to news about chip demand and export rules.
Lam Research stock Q3 2026: is LRCX overvalued?
On our numbers, yes. Our discounted cash flow model values Lam Research at $111.41 a share, against a $239.11 close on 30 October 2026, about 53% lower. At that price the company's equity was worth about $299.6bn, on 1,253m diluted shares, and its enterprise value, after net cash of about $3.7bn, about $295.9bn. That is 8.4 times the consensus forecast of fiscal 2027 revenue, 24.8 times consensus fiscal 2027 EPS of $9.63 and 19.7 times consensus fiscal 2028 EPS of $12.15.
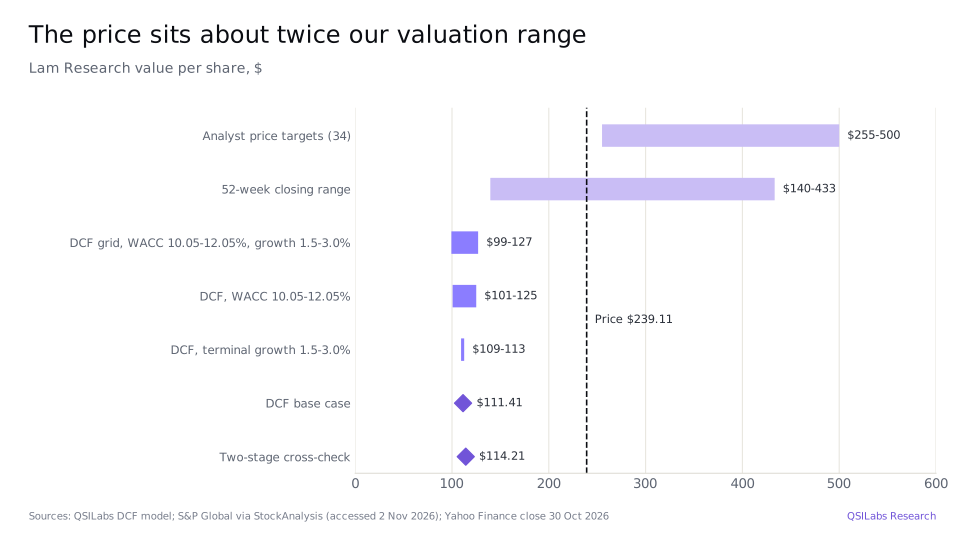
We are not saying the business is weak. Lam is growing revenue at more than 50%, earns a 40% operating margin and turns much of its profit into cash. We are saying the price assumes far more than our forecast: that growth stays well above the industry's long-run rate after fiscal 2028, that margins stay near today's level through the next downturn, or that investors should discount the cash flows at a much lower rate. Holding our forecast fixed, the share price implies a cost of capital of about 6.3%, against our 11.05%.
Analysts are much more optimistic. The 34 analysts tracked by S&P Global rate Lam a Strong Buy on average, with an average price target of $364.03, a median of $352.50 and a range from $255 to $500. Bernstein kept a Buy rating and a $350 target on 2 November, and Goldman Sachs ($380), UBS ($400, cut from $425) and Oppenheimer ($400) published targets on 22 October.
Method
We forecast revenue and GAAP operating margin year by year to fiscal 2036, apply a 16.5% tax rate, capital spending and working capital, and discount the cash flows at an 11.05% weighted average cost of capital. The cost of capital comes from Damodaran's January 2026 data for US semiconductor equipment companies: a beta of 1.40, a cost of equity of 11.35% and debt of about 5% of capital, with a 5.12% risk-free rate. After fiscal 2036 we assume growth of 2.5% a year and a 15% return on new investment; that terminal value is 44% of our enterprise value of $135.5bn. Adding net cash and other small items gives equity value of $139.6bn, or $111.41 a share on 1,253m shares.
For fiscal 2027 we use the consensus revenue of $35.39bn, up 52%, and a 40.4% operating margin, close to the 40.0% of the September quarter and the 40.5% guided for December. For fiscal 2028 we use consensus revenue of $42.60bn, up 20%, at a 40% margin. Growth then slows to 7% in fiscal 2029, 5% in 2030 and 3% from 2033, and the margin fades to 34% by fiscal 2032, close to Lam's fiscal 2026 margin of 35.3% and above its fiscal 2024 and 2025 margins. That reflects our view that equipment spending moves in cycles and that today's margin is near a peak.
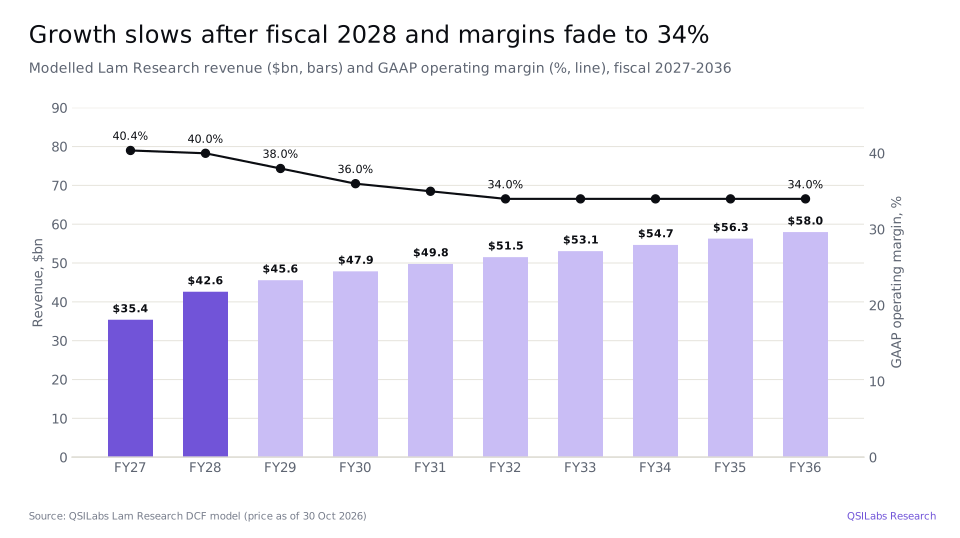
We forecast unlevered free cash flow of $8.2bn in fiscal 2027, against a consensus free cash flow forecast of $10.48bn, rising to $12.0bn in fiscal 2028 and about $13.6bn by fiscal 2036. Ours is lower mainly because we assume working capital grows with revenue: inventories of $4.55bn and receivables of $5.66bn at 27 September already tie up a large amount of cash.
How the number moves if you argue with us
The table shows our value per share at different costs of capital and terminal growth rates. Even at a 10.05% cost of capital, close to a bottom-up estimate using a beta of 1, and 3.0% terminal growth, the model reaches $126.99, about half the share price.
| Cost of capital | Growth 1.5% | Growth 2.0% | Growth 2.5% | Growth 3.0% |
|---|---|---|---|---|
| 10.05% | $121.77 | $123.32 | $125.04 | $126.99 |
| 10.55% | $115.23 | $116.45 | $117.80 | $119.31 |
| 11.05% | $109.38 | $110.35 | $111.41 | $112.58 |
| 11.55% | $104.13 | $104.89 | $105.72 | $106.63 |
| 12.05% | $99.38 | $99.98 | $100.63 | $101.33 |
The bigger levers are the length of the AI-driven upcycle and the margin Lam can hold through the next downturn. If revenue kept growing at double-digit rates beyond fiscal 2028, or the operating margin stayed near 40% for the whole forecast, our cash flows would be materially higher. To reach the share price with our cost of capital, the terminal value would need to be about 3.7 times what we assume.
Risks to the Lam Research investment case
- Cyclical risk. Equipment spending rises and falls with chipmakers' capacity plans. Lam's revenue fell 14.5% in fiscal 2024; a slowdown in memory or AI investment would hit systems revenue first.
- China and export controls. China supplied 35% of revenue in the quarter. Wider US export controls, entity listings or Chinese retaliation could cut that revenue quickly, and the 10-Q lists these among its main risks.
- Customer concentration. A small number of memory makers and foundries account for most of Lam's systems revenue, and Korea alone was 20% of revenue. Delays at one large customer can move a quarter.
- Margin risk. Today's 40% operating margin benefits from favourable mix and high volumes. The company's own guidance band is plus or minus one point, and margins were below 34% as recently as fiscal 2025.
- Valuation risk. At about 25 times consensus fiscal 2027 EPS, the shares price in continued growth. The 11.8% fall after a quarter that beat consensus shows how sharply they can react.
- Competition. Applied Materials, Tokyo Electron and other equipment makers compete with Lam in etch, deposition and clean, and customers can shift spending between suppliers from one technology generation to the next.
- Upside risk. If AI keeps lifting memory and advanced-logic investment for several more years, and Lam outgrows the equipment market as its chief executive expects, revenue and margins could beat our forecast and our value would rise.
FAQ
What value does QSILabs put on Lam Research stock?
QSILabs values Lam Research at $111.41 a share, based on a discounted cash flow model updated with fiscal Q1 FY2027 results and the Form 10-Q. That is about 53% below the $239.11 close on 30 October 2026. A two-stage cross-check gives $114.21; analysts' average price target is $364.03.
Is Lam Research stock a buy in Q3 2026?
Our model says LRCX trades well above what its cash flows justify, because the price assumes stronger growth and steadier margins after fiscal 2028 than we forecast for a cyclical equipment maker. The business is strong: revenue up 54% in the September quarter, a 40% operating margin and free cash flow that doubled. This is not investment advice.
Why does a Q3 2026 article cover Lam Research's fiscal Q1 2027?
Lam Research's fiscal year ends on the last Sunday of June, so fiscal Q1 FY2027 covers July to September 2026 and ended on 27 September. Those are the same months as calendar Q3 2026, which is why the quarter belongs in our Q3 2026 earnings series. The results were reported on 21 October 2026.
How much revenue did Lam Research make in its latest quarter?
Lam Research's revenue for fiscal Q1 FY2027, the quarter to 27 September 2026, was $8,219m, up 54% from $5,324m a year earlier and 22% from $6,722m in the June quarter. Systems revenue was $5,733m and customer support-related revenue and other $2,487m. Fiscal 2026 revenue was $23.23bn.
What does Lam Research make?
Lam Research makes wafer fabrication equipment, mainly machines for etch, deposition and clean, the steps that carve and layer the structures on a silicon wafer. It also sells services, spare parts and upgrades for its installed base, and older-generation equipment under its Reliant product line. Its customers are memory makers, foundries and logic chipmakers.
How exposed is Lam Research to US export controls?
China supplied 35% of Lam Research's revenue in the September 2026 quarter, $2,886m, down from 43% a year earlier. Lam's 10-Q says export controls, entity listings and foreign direct product rules may inhibit its ability to sell products or services, so tighter rules on China are one of the biggest risks to its revenue.
When does Lam Research report its next earnings?
Lam Research's fiscal Q2 FY2027 quarter ends on 27 December 2026, and results would follow in the new year; the company had not confirmed a date when we published. It has guided revenue of $8.60bn plus or minus $0.40bn and EPS of $2.33 plus or minus $0.15 for the quarter.
Does Lam Research pay a dividend?
Yes. Lam Research declared a quarterly dividend of $0.33 a share in the September 2026 quarter, up 27% from $0.26, or $1.32 a year, a yield of about 0.6% at the 30 October 2026 price. It paid $325m of dividends and spent $1,025m on buybacks in the quarter.
What price target do analysts have for Lam Research?
The 34 analysts tracked by S&P Global, as reported by StockAnalysis on 2 November 2026, have an average price target for Lam Research of $364.03, a median of $352.50, a low of $255 and a high of $500, with a consensus rating of Strong Buy. Our DCF value of $111.41 is far below all of them.
Sources
- Lam Research Corporation, results for the quarter ended 27 Sep 2026 (Form 8-K, Exhibit 99.1, 21 Oct 2026; accession 0000707549-26-000052) www.sec.gov
- Lam Research Corporation, Form 10-Q for the quarter ended 27 Sep 2026 (filed 22 Oct 2026; accession 0000707549-26-000054) www.sec.gov
- SEC XBRL company facts for Lam Research (CIK 707549): quarterly and annual revenue, gross margin, operating income and cash flow from Forms 10-Q and the fiscal 2026 Form 10-K (accession 0000707549-26-000037) data.sec.gov
- StockAnalysis: Lam Research forecast and analyst ratings, S&P Global data (accessed 2 Nov 2026) stockanalysis.com
- StockAnalysis: Lam Research statistics (accessed 2 Nov 2026) stockanalysis.com
- Yahoo Finance chart data: LRCX closing prices and dividends (November 2025 to November 2026) query1.finance.yahoo.com
- Damodaran Online: cost of capital by industry (US), January 2026 pages.stern.nyu.edu
- QSILabs Lam Research discounted cash flow model (internal; price as of 30 Oct 2026)
Disclaimer
This article is for information only and is not investment advice, a recommendation or an offer to buy or sell any security. QSI Labs and its authors may hold positions in the securities discussed. Forecasts and valuations are estimates that depend on assumptions that may prove wrong. Figures are taken from company filings and third-party sources believed to be reliable, but we do not guarantee their accuracy. Do your own research or consult a licensed adviser before investing.
More from QSI Labs
Related analysis: Applied Materials stock Q3 2026: DRAM and China, Micron stock Q3 2026: HBM, NVIDIA stock Q3 2026: Vera Rubin and Broadcom stock Q3 2026: custom AI chips.
Read our white paper, QSI Labs: An AI-Native Trading Firm Built on a Training Loop (October 2026), available on request, or browse the research index.