Research / Earnings and valuation
Palantir Stock Q3 2026:US Commercial Overtakes Government as Revenue Hits $2.3bn
As of: Figures are as of Palantir Technologies' Q3 2026 results (quarter ended 30 September 2026, reported 2 November 2026 in a Form 8-K and the Q3 2026 Business Update). The share price is the Nasdaq close of PLTR on 30 October 2026, $184.11. Published 2 November 2026.
The short answer. Palantir stock Q3 2026 results were the strongest in the company's history: revenue rose 96% to $2.31bn, US commercial revenue rose 148% to $984m and, for the first time, overtook US government revenue. GAAP operating income was $1.08bn, a 47% margin, and Palantir raised its 2026 revenue guidance to $8.530-8.534bn, 91% growth. Our discounted cash flow model, updated for the quarter, puts Palantir at $56.06 a share, up from $52.56, against a $184.11 close on 30 October 2026. The business is exceptional; the share price already assumes it stays exceptional for much longer than we do.
Key takeaways
- Revenue up 96%. Q3 2026 revenue was $2,313.4m, up from $1,181.1m a year earlier and 20% above Q2. It is the first quarter above $2bn.
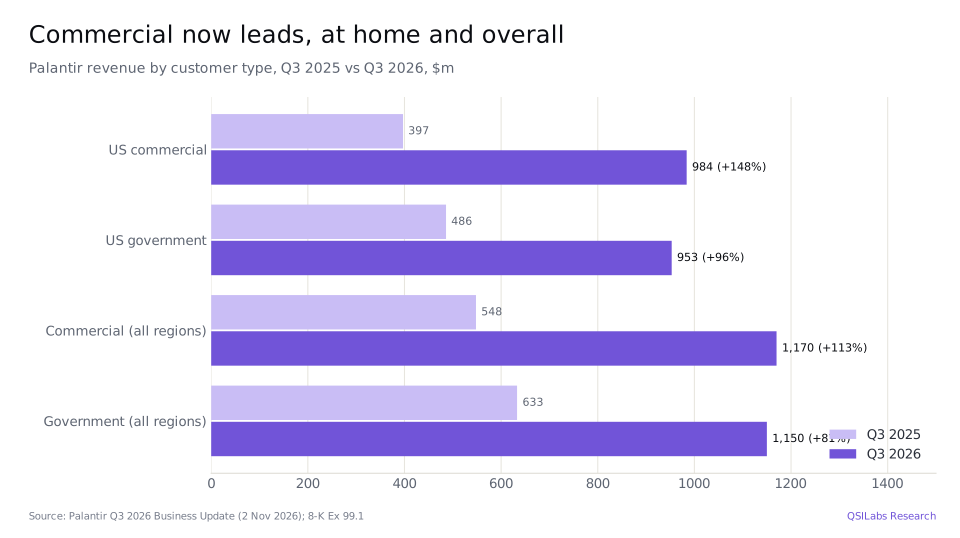
- US commercial passed US government. US commercial revenue was $984m (+148% year on year, +29% on Q2); US government revenue was $953m (+96%). US revenue as a whole was $1.937bn, 84% of the total.
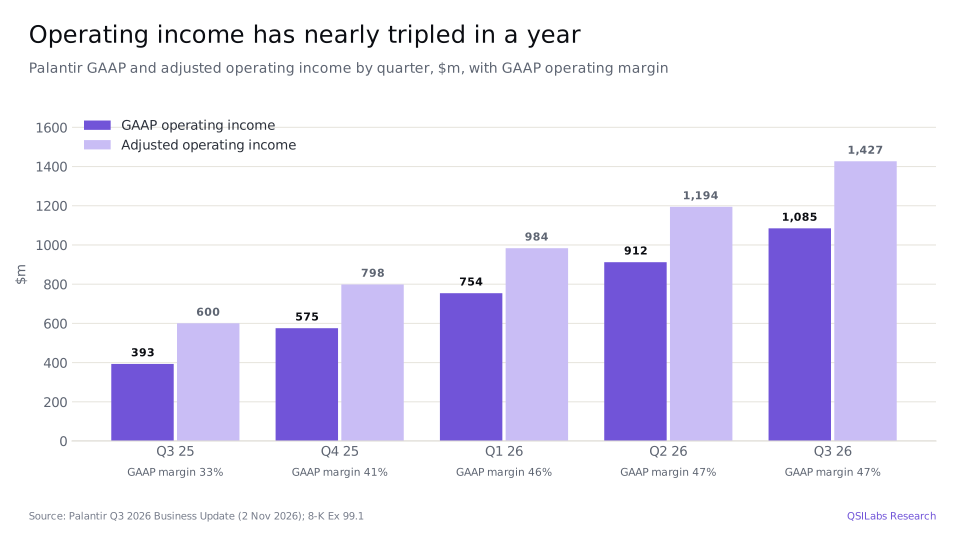
- Margins kept rising. GAAP operating income was $1,084.8m (47% margin, from 33%); adjusted operating income was $1,426.8m (62%). The Rule of 40 score was 158%.
- Cash. Adjusted free cash flow was $1,216.1m (53% margin). Cash and marketable securities were $10.56bn at 30 September, with no debt.
- Guidance raised again. 2026 revenue guidance rose to $8.530-8.534bn from $8.150-8.158bn; US commercial revenue to more than $3.559bn (at least 143% growth); adjusted operating income to $5.245-5.249bn.
- Our value: $56.06 a share, up $3.50, about 70% below the $184.11 close on 30 October. A two-stage cross-check gives $61.26; analysts' average target is $212.50.
- What to watch. Total contract value booked in Q3 rose only 6% year on year, to $2.918bn, while revenue nearly doubled. Bookings are the leading indicator for 2027 growth.
Key numbers from Palantir's Q3 2026 earnings
| Metric | Q3 2026 | Q3 2025 | Change |
|---|---|---|---|
| Revenue | $2,313.4m | $1,181.1m | +96% |
| US commercial revenue | $984m | $397m | +148% |
| US government revenue | $953m | $486m | +96% |
| Commercial revenue (all regions) | $1.17bn | $548m | +113% |
| Government revenue (all regions) | $1.15bn | $633m | +81% |
| GAAP operating income | $1,084.8m | $393.3m | +176% |
| GAAP operating margin | 47% | 33% | +14 pts |
| Adjusted operating income | $1,426.8m | $600.5m | +138% |
| Net income to shareholders | $1,128.0m | $475.6m | +137% |
| Diluted EPS (GAAP) | $0.44 | $0.18 | +144% |
| Adjusted free cash flow | $1,216.1m | $539.9m | +125% |
| Stock-based compensation | $318.9m | $172.3m | +85% |
| Net dollar retention | 165% |
Palantir Q3 2026 earnings: what happened
Palantir reported results for the quarter to 30 September 2026 after the market closed on 2 November. Revenue of $2,313.4m was about $150m above the top of the company's own Q3 guidance of $2,160-2,164m, set in August. Revenue growth has accelerated in every quarter since Q4 2024, reaching 96% against 93% in Q2.
The headline in Palantir's release is that US commercial revenue, at $984m, passed US government revenue, at $953m, for the first time. For most of its history Palantir was a government software company that also sold to businesses. In Q4 2024 US commercial was a $214m-a-quarter business; it is now more than four times that size, and it grew 29% in three months.
Chief executive Alex Karp framed the quarter around what he calls Sovereign AI: institutions that own their data, their workflows and, increasingly, their models. Palantir's pitch is that its Ontology, the data layer that maps an organisation's assets, people and decisions, lets customers plug in large language models, including fine-tuned open-weight models, and run them on real operations. In the Q3 business update NVIDIA's Jensen Huang describes the two companies "combining NVIDIA Nemotron models with Palantir's Ontology to reason, plan and orchestrate the journey from wafer to token."
Profit rose faster than revenue. Total operating expenses rose 46%, to $845.3m, while revenue rose 96%, so GAAP operating income nearly tripled to $1,084.8m. Net income to shareholders was $1,128.0m, or $0.44 a diluted share, against $475.6m and $0.18 a year earlier.
- 3 Aug 2026Q2 2026 results: revenue $1,935.5m; 2026 revenue guidance raised to $8.150-8.158bn, Q3 guidance $2.160-2.164bnQ2 2026 release
- 30 Sep 2026Quarter ends; US commercial revenue ($984m) passes US government revenue ($953m) for the first time8-K Ex 99.1
- 30 Oct 2026PLTR closes at $184.11 on Nasdaq, the price used in our valuationYahoo Finance
- 2 Nov 2026PLTR closes at $178.34 before the resultsYahoo Finance
- 2 Nov 2026Q3 2026 results after the close: revenue $2,313.4m (+96%); 2026 revenue guidance raised to $8.530-8.534bn8-K Ex 99.1
- 2 Nov 2026Q3 2026 Business Update published, including the Army TITAN production award and AIP EvolveQ3 2026 Business Update
How fast is Palantir's US commercial business growing?
US commercial revenue grew 148% year on year in Q3 2026 and has more than doubled year on year in each of the last four quarters. The business added $220m of quarterly revenue in Q3 alone, more than its entire quarterly revenue in Q4 2024.
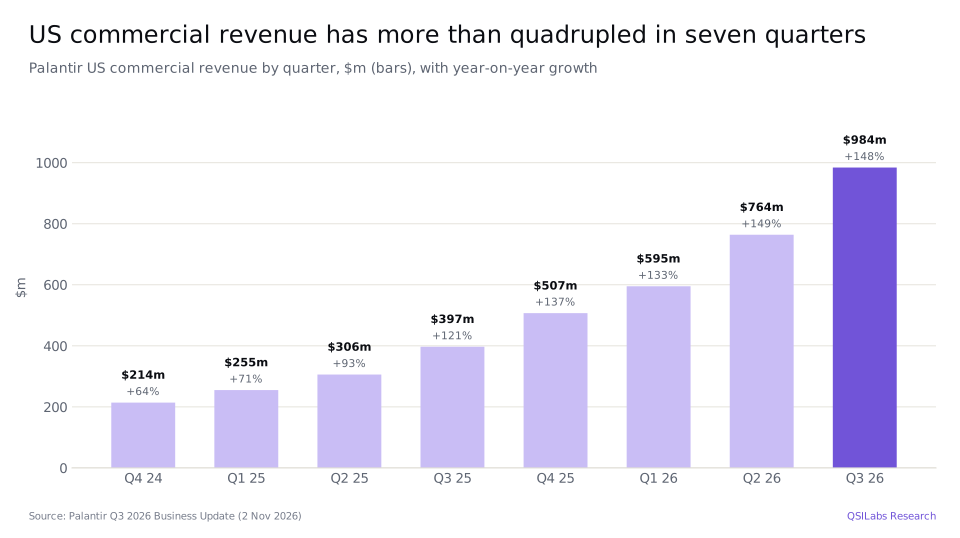
Three things drive it. First, more customers: Palantir had 686 US commercial customers over the twelve months to September 2026, up 29% year on year. Second, much bigger contracts: in Q3 it closed $1.463bn of US commercial total contract value (TCV), up 11%, and its US commercial remaining deal value, the value of contracts not yet recognised as revenue, reached $6.517bn, up 79%. Third, customers spend more each year once AIP is live: net dollar retention, which measures what last year's customers spend this year, reached 165% in Q3.
The case studies in the business update show where the money goes. Hexion, a chemicals maker founded 170 years ago, is rebuilding its operations around a single Ontology, with AI agents that turn customer demand signals into purchasing and pricing decisions. AIP Evolve, a new product, matches each workflow with the model that gives the best trade-off between speed, cost and accuracy; Palantir says fine-tuned open models beat frontier models on some tasks at a fraction of the cost.
Across all regions, commercial revenue was $1.17bn, up 113%. International commercial revenue was roughly $183m, and grew far more slowly than the US business; Palantir's growth story is still overwhelmingly American.
How did Palantir's government business do in Q3 2026?
Government revenue was $1.15bn across all regions, up 81% year on year. US government revenue rose 96% to $953m, and 18% from Q2. Outside the US, government revenue was roughly $194m.
The US Army is the anchor customer. Palantir's Q3 business update says the Army has awarded Palantir a prime agreement to produce eight TITAN systems, its next-generation AI-enabled ground station, moving TITAN from prototype to production. Civil agencies are adopting AIP too: the Federal Aviation Administration is using it to unify separate safety systems into one national picture of risk.
Government revenue is lumpier than commercial revenue. Agencies can cancel or decline to exercise options on many contracts, and Palantir notes in its filings that some contract value is subject to termination for convenience. Growth of 96% in the US is exceptional for a government software vendor and is unlikely to be the long-run rate. In our model, total government revenue grows 77% in 2026 and 43% in 2027, then slows each year after.
How profitable is Palantir? Margins, stock-based pay and the Rule of 40
Palantir's GAAP operating margin was 47% in Q3 2026, up from 33% a year earlier. Its adjusted operating margin, which excludes stock-based compensation and the employer payroll tax on it, was 62%, the same as in Q2. Gross margin was 83% on a GAAP basis.
Stock-based compensation was $318.9m in the quarter, up 85% year on year but down to 13.8% of revenue from 14.6%. We treat it as a real cost: shares issued to employees dilute existing holders as surely as a cash salary reduces profit. That is why we work from an operating margin of about 45% for 2027 onwards, rather than the 60%-plus adjusted margin, and it is one reason our value sits below the market price.
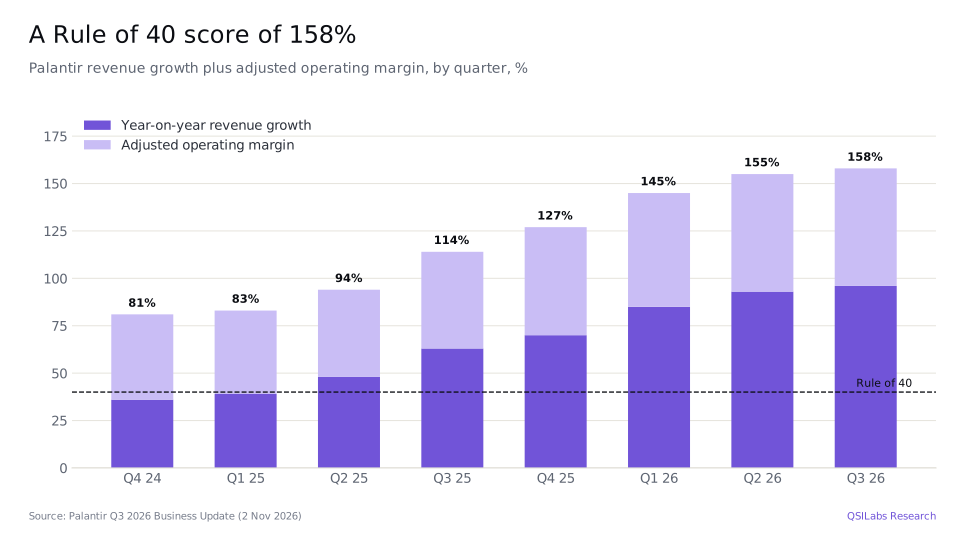
Palantir's preferred scorecard is the Rule of 40: revenue growth plus adjusted operating margin. A score above 40% is considered healthy for a software company. Palantir scored 158% in Q3 2026, made up of 96% revenue growth and a 62% adjusted margin, up from 114% a year earlier and 81% in Q4 2024.
Tax is low for now. The income tax provision was $13.6m on $1,148.0m of pre-tax income, a rate of about 1%, because of past losses and tax deductions from employee share awards. Palantir's own adjusted EPS assumes a 23% long-term rate. Our model uses 18%, rising towards the statutory rate as those deductions are used.
How much cash does Palantir generate?
Palantir generated $1,204.6m of cash from operations in Q3 2026 and $1,216.1m of adjusted free cash flow, a 53% margin. In the first nine months of 2026 operating cash flow was $3,319.9m, against $1,357.2m a year earlier. Capital spending is tiny: $30.0m in nine months.
Billings, revenue plus the change in contract liabilities, were $2,454.4m, up 100% year on year, so customers are paying ahead of revenue being recognised. Receivables also rose, to $1,883.5m from $1,042.1m at the end of 2025, as government and large commercial customers were invoiced for bigger contracts.
Cash, cash equivalents and marketable securities were $10,561.5m at 30 September, up from $7,177.0m at the end of 2025. Palantir has no debt and pays no dividend. It had 2,409m shares outstanding at the end of the quarter; diluted weighted shares were 2,573.9m, up only 0.1% from a year earlier, so net dilution has been small even as stock-based pay has risen.
Palantir's 2026 guidance: what changed?
Palantir raised every line of its 2026 guidance. The new revenue range of $8.530-8.534bn is $378m above the midpoint of the August range, more than double the size of the Q3 beat against guidance, so the company raised its implied Q4 as well. Q4 revenue guidance of $2.649-2.653bn implies growth of about 88% on Q4 2025's $1,406.8m.
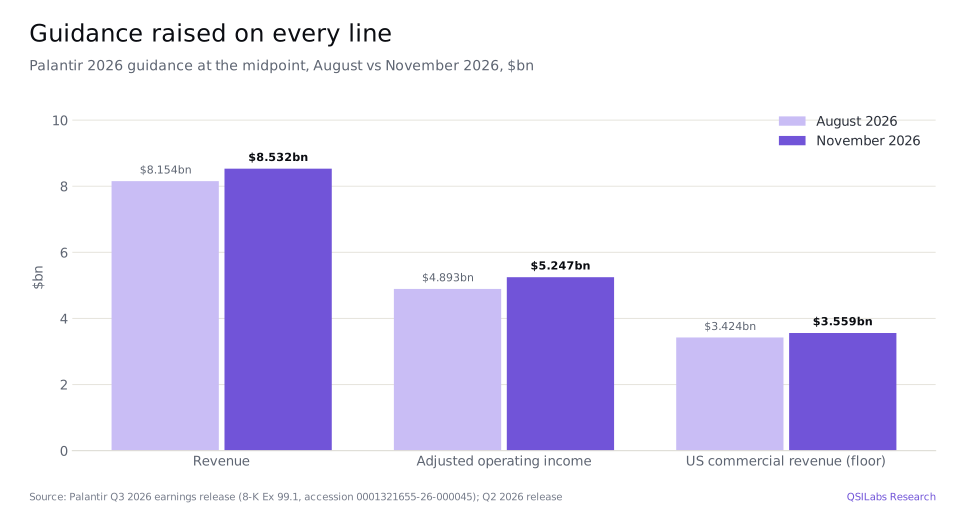
| 2026 guidance | August 2026 | November 2026 | Change at midpoint |
|---|---|---|---|
| Revenue | $8.150-8.158bn | $8.530-8.534bn | +$378m |
| US commercial revenue | more than $3.424bn | more than $3.559bn | +$135m |
| Adjusted operating income | $4.889-4.897bn | $5.245-5.249bn | +$354m |
| Adjusted free cash flow | $4.8-5.0bn | raised | |
| Q4 2026 revenue | $2.649-2.653bn | +88% on Q4 2025 | |
| Q4 2026 adjusted operating income | $1.640-1.644bn | 62% margin |
The guidance implies a 61.5% adjusted operating margin for the full year. Palantir also repeated that it expects GAAP operating income and net income in every quarter of 2026.
Palantir stock Q3 2026: is PLTR overvalued?
On our numbers, yes, by a wide margin. Our discounted cash flow model values Palantir at $56.06 a share, against a $184.11 close on 30 October 2026. At that price Palantir's equity was worth about $470bn and its enterprise value, after its $10.6bn of net cash, about $459bn. That is 54 times our 2026 revenue estimate and 36 times our 2027 estimate. On analysts' pre-results adjusted EPS forecasts of $1.61 for 2026 and $2.35 for 2027, the shares traded at 114 and 78 times earnings.
The share price fell to $178.34 on 2 November, before the results were published.
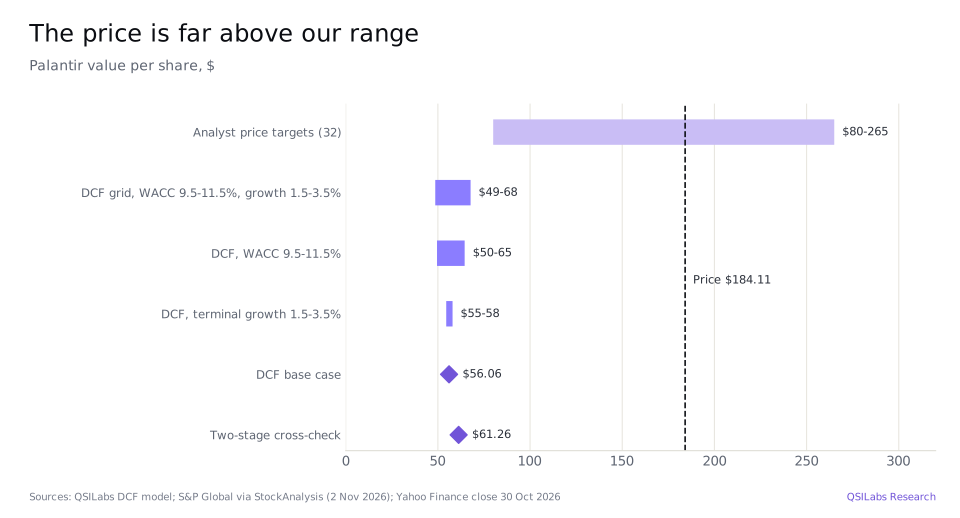
We are not saying the business is weak. A company growing 96% at a 47% GAAP operating margin is extraordinary. We are saying the price already assumes that growth persists for many more years and that margins hold above 45% for decades, and that a 10.5% cost of capital is the right hurdle for a business this concentrated in US government and US commercial demand. Our enterprise value of $132.3bn is less than a third of the market's.
Analysts are more optimistic. Of the 32 covering the stock tracked by StockAnalysis, the consensus rating is Buy, with an average price target of $212.50 and a range from $80 to $265, set before these results.
Method
We forecast revenue for government and commercial separately, then apply an operating margin that counts stock-based pay as a cost, a cash tax rate, capital spending and working capital, and discount the cash flows at a 10.5% weighted average cost of capital. The cost of capital comes from Damodaran's January 2026 data for US software companies: a beta of 1.28 and a cost of equity of 10.8%. After 2035 we assume growth of 2.5% a year; that terminal value is 60% of our enterprise value.
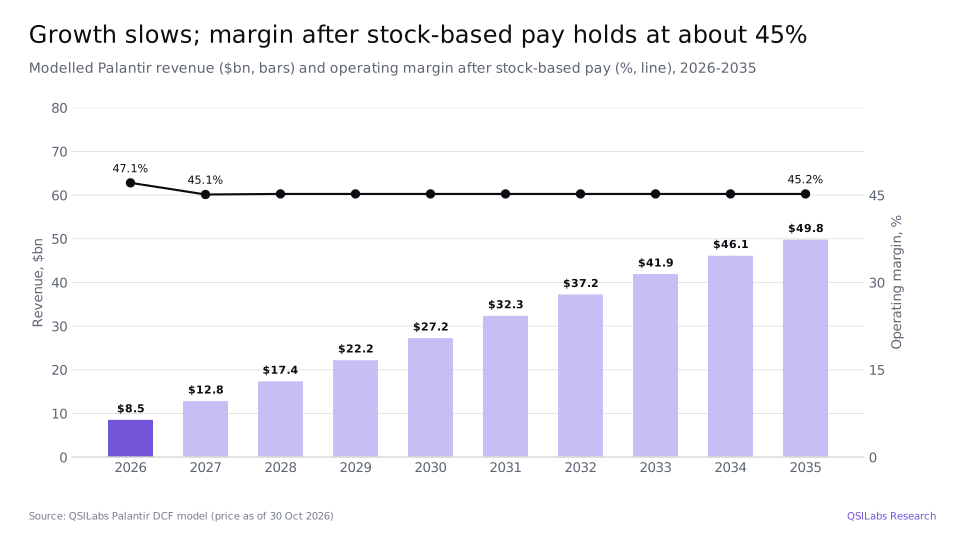
For 2026 we use nine months of reported results plus the midpoint of Palantir's Q4 guidance, giving revenue of $8,532m (+91%) and operating income after stock-based pay of $4,023m (47%). For 2027 we assume growth of 50.5%, in line with the analyst consensus for the year, to $12,844m: commercial +58% and government +43%. Growth then slows steadily, to 35% in 2028, 23% in 2030 and 8% in 2035, when revenue reaches $49.8bn.
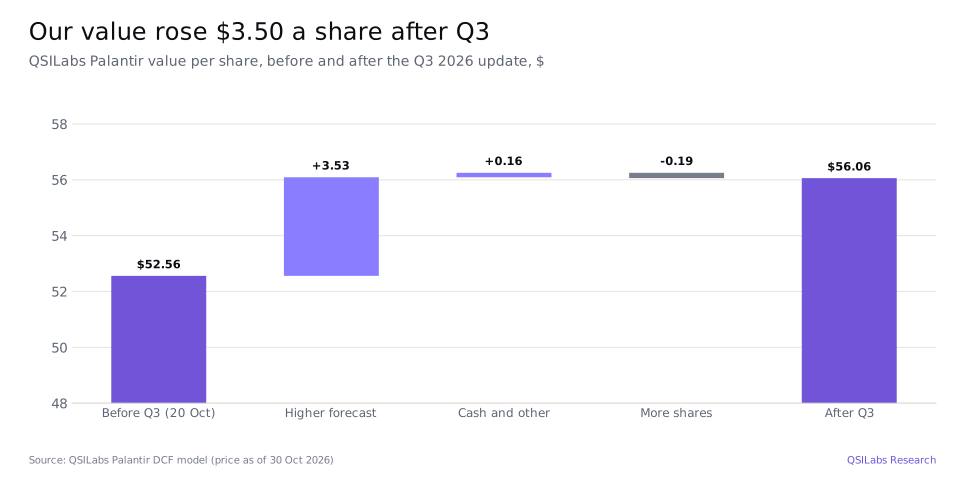
Our value rose $3.50 a share after Q3. A higher 2026 base, from the beat and the guidance raise, and faster 2027 growth added $3.53. Higher cash, net of a smaller allowance for cash earned between the balance sheet date and the valuation date, added $0.16. More shares, mainly from in-the-money options, took away $0.19.
How the number moves if you argue with us
The table shows our value per share at different costs of capital and terminal growth rates. Even at a 9.5% cost of capital and 3.5% terminal growth, the model reaches $67.74, well short of the share price.
| Cost of capital | Growth 1.5% | Growth 2.0% | Growth 2.5% | Growth 3.0% | Growth 3.5% |
|---|---|---|---|---|---|
| 9.5% | $62.05 | $63.21 | $64.52 | $66.01 | $67.74 |
| 10.0% | $58.06 | $58.97 | $60.00 | $61.15 | $62.47 |
| 10.5% | $54.53 | $55.25 | $56.06 | $56.95 | $57.96 |
| 11.0% | $51.39 | $51.96 | $52.59 | $53.29 | $54.07 |
| 11.5% | $48.58 | $49.03 | $49.53 | $50.07 | $50.67 |
The bigger lever is growth beyond 2027. To reach today's price, revenue would need to compound much faster than our path for longer, or margins would need to settle well above 45% after stock-based pay, or both. Our model is most sensitive to those assumptions, not to the discount rate.
Risks to the Palantir investment case
- Valuation risk. At 54 times this year's revenue, the shares price in years of very fast growth. Any slowdown in US commercial growth or a cut to guidance could lead to a large fall in the price.
- Bookings are slowing relative to revenue. Total contract value booked in Q3 rose 6% year on year, to $2.918bn, while revenue rose 96%. If bookings do not reaccelerate, revenue growth in 2027 will be lower than in 2026.
- Concentration in the US. About 84% of Q3 revenue came from the US. International revenue, both commercial and government, grew far more slowly.
- Government contracts. US government revenue depends on budgets, contract awards and options that agencies can choose not to exercise. A change in defence priorities or procurement rules would hit growth directly.
- Stock-based pay. Palantir paid $785.7m of stock-based compensation in the first nine months of 2026. If it rises faster than revenue, dilution will return.
- Competition in AI software. Hyperscalers, model developers and enterprise software vendors all want to own the layer where AI agents meet company data. Palantir's lead in that layer is real but not guaranteed.
- Upside risk. If net dollar retention stays above 150% and US commercial keeps doubling for two or three more years, revenue in 2028 and beyond would be well above our forecast, and our value would rise sharply.
FAQ
What is Palantir stock worth after Q3 2026 earnings?
QSILabs values Palantir at $56.06 a share, based on a discounted cash flow model updated for Q3 2026 results. That is about 70% below the $184.11 close on 30 October 2026. A two-stage cross-check gives $61.26; analysts' average price target is $212.50.
Is Palantir stock a buy after Q3 2026?
Our model says PLTR trades well above what its cash flows justify, even after a record quarter, because the price assumes very fast growth for many more years. The business is strong: revenue up 96%, a 47% GAAP operating margin and $10.6bn of cash with no debt. This is not investment advice.
How much revenue did Palantir make in Q3 2026?
Palantir's Q3 2026 revenue was $2,313.4m, up 96% from $1,181.1m a year earlier and 20% from Q2. US revenue was $1.937bn, of which US commercial was $984m and US government $953m.
Why did Palantir's US commercial revenue grow so fast?
Customers are adopting AIP, Palantir's AI platform, and expanding fast once it is live. US commercial customers rose 29% to 686, net dollar retention reached 165% and Palantir closed $1.463bn of US commercial contract value in the quarter.
Did Palantir raise its 2026 guidance?
Yes. Palantir raised 2026 revenue guidance to $8.530-8.534bn, 91% growth, from $8.150-8.158bn. It raised US commercial revenue guidance to more than $3.559bn and adjusted operating income guidance to $5.245-5.249bn.
How profitable is Palantir?
Very. GAAP operating income was $1,084.8m in Q3 2026, a 47% margin, and net income to shareholders was $1,128.0m. Adjusted operating income was $1,426.8m, a 62% margin, and adjusted free cash flow $1,216.1m, a 53% margin.
What is Palantir's Rule of 40 score?
Palantir's Rule of 40 score was 158% in Q3 2026: 96% revenue growth plus a 62% adjusted operating margin. It was 114% a year earlier.
Does Palantir pay a dividend?
No. Palantir pays no dividend and has no debt. It held $10.56bn of cash and marketable securities at 30 September 2026.
Sources
- Palantir Technologies Inc., Q3 2026 earnings release (Form 8-K, Exhibit 99.1, 2 Nov 2026; accession 0001321655-26-000045) www.sec.gov
- Palantir Technologies Inc., Q3 2026 Business Update (investor presentation, 2 Nov 2026) investors.palantir.com
- Palantir Technologies Inc., Q2 2026 earnings release (Form 8-K, Exhibit 99.1, 3 Aug 2026; accession 0001321655-26-000039) www.sec.gov
- Palantir Technologies Inc., Form 10-K for the year ended 31 Dec 2025 (segment revenue) www.sec.gov
- StockAnalysis: Palantir forecast and analyst ratings, S&P Global data (accessed 2 Nov 2026) stockanalysis.com
- Yahoo Finance chart data: PLTR closing prices (October and November 2026) query1.finance.yahoo.com
- Damodaran Online: cost of capital by industry (US), January 2026 pages.stern.nyu.edu
- QSILabs Palantir discounted cash flow model (internal; price as of 30 Oct 2026)
Disclaimer
This article is for information only and is not investment advice, a recommendation or an offer to buy or sell any security. QSI Labs and its authors may hold positions in the securities discussed. Forecasts and valuations are estimates that depend on assumptions that may prove wrong. Figures are taken from company filings and third-party sources believed to be reliable, but we do not guarantee their accuracy. Do your own research or consult a licensed adviser before investing.
More from QSI Labs
Related analysis: Microsoft stock Q3 2026, NVIDIA stock Q3 2026, Alphabet stock Q3 2026 and ExxonMobil stock Q3 2026: refining margins and buybacks.
Read our white paper, QSI Labs: An AI-Native Trading Firm Built on a Training Loop (October 2026), available on request, or browse the research index.