Research / Earnings and valuation
Goldman Sachs Stock Q3 2026:Equities Up 72% and EPS of $17.01
As of: Figures are as of Goldman Sachs' third-quarter 2026 results (the quarter ended 30 September 2026, reported 13 October 2026 in a Form 8-K with an earnings release and results presentation) and its Form 10-Q for the quarter, filed 2 November 2026. Goldman Sachs' fiscal year is the calendar year, so Q3 2026 is the July-September 2026 quarter. The share price is the NYSE close of GS on 30 October 2026, $894.55; on 2 November 2026 the shares closed at $898.72. Published 2 November 2026.
The short answer. Goldman Sachs stock Q3 2026 is a story of a very strong trading desk and a full price. In the three months to 30 September 2026, Goldman Sachs' net revenues rose 23% to $18.68bn, net earnings rose 29% to $5.29bn and diluted earnings per share rose to $17.01 from $12.25. Equities revenue jumped 72% to $6.44bn, investment banking fees rose 21% and Asset & Wealth Management revenue rose 14%. Our free-cash-flow-to-equity model values Goldman Sachs at $819.06 a share, 8.4% below the $894.55 close on 30 October 2026, so on our assumptions the shares already price in more than the quarter showed.
Key takeaways
- Revenue up 23%, EPS up 39%. Q3 2026 net revenues were $18,679m against $15,184m a year earlier. Net earnings rose to $5,294m from $4,098m and diluted EPS to $17.01 from $12.25. The firm calls it its second highest quarterly net revenues, and says nine-month net revenues of $56,244m are a record for the period (8-K Ex 99.1; 8-K Ex 99.2).
- Equities did the heavy lifting. Global Banking & Markets revenue rose 32% to $13,458m. Equities revenue was $6,441m, up 72%, with financing revenue nearly doubling; FICC was flat at $3,471m and investment banking fees rose 21% to $3,224m (8-K Ex 99.1).
- Asia revenue up 90%. Revenue booked in Asia rose to $3,800m from $2,001m, a fifth of the firm's total (8-K Ex 99.1).
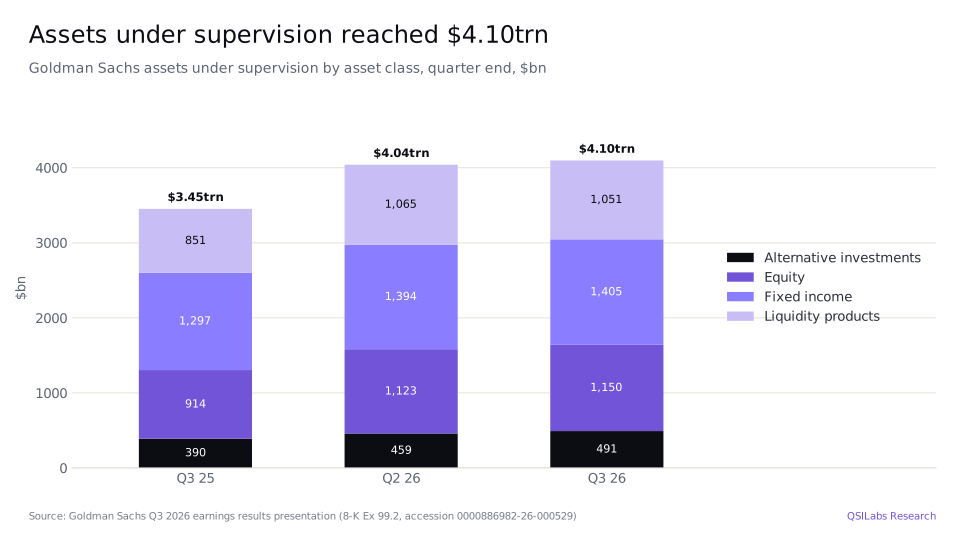
- Asset management fees rising. Management and other fees were $3,587m, up 22%, and assets under supervision reached $4.10trn, both described by Goldman as records (8-K Ex 99.2).
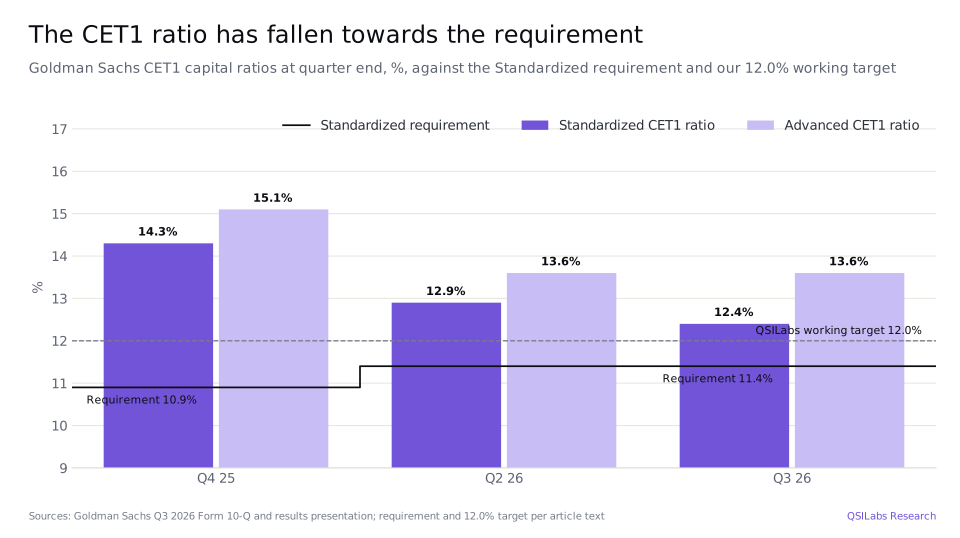
- Capital working harder. The Standardized CET1 ratio fell to 12.4% from 14.3% at the end of 2025, 1.0 point above the 11.4% requirement. The firm returned $4.49bn to shareholders in the quarter, including $3.00bn of buybacks at an average of $1,048.73 a share (8-K Ex 99.1; Form 10-Q).
- Our value: $819.06 a share, 8.4% below the $894.55 close on 30 October 2026, and up from $813.62 in our previous estimate. The average of the analyst price targets we track is $1,031 (StockAnalysis, S&P Global data).
- What to watch. Fourth-quarter results in January 2027, where consensus 2026 EPS of $71.50 implies about $16 a share for the quarter, and whether the investment banking backlog, which fell in the third quarter, recovers.
Key numbers from Goldman Sachs' Q3 2026 earnings
| Metric | Q3 2026 | Q3 2025 | Change |
|---|---|---|---|
| Net revenues | $18,679m | $15,184m | +23.0% |
| Global Banking & Markets net revenues | $13,458m | $10,168m | +32.4% |
| Asset & Wealth Management net revenues | $5,051m | $4,418m | +14.3% |
| Platform Solutions net revenues | $170m | $598m | -71.6% |
| Provision for credit losses | $368m | $339m | +8.6% |
| Operating expenses | $11,308m | $9,453m | +19.6% |
| Pre-tax earnings | $7,003m | $5,392m | +29.9% |
| Net earnings | $5,294m | $4,098m | +29.2% |
| Diluted EPS | $17.01 | $12.25 | +38.9% |
| Annualized return on equity | 18.7% | 14.2% | +4.5 pts |
| Efficiency ratio | 60.5% | 62.3% | -1.8 pts |
| Assets under supervision | $4,097bn | $3,452bn | +18.7% |
| Book value per share | $372.64 | $353.79 | +5.3% |
Goldman Sachs Q3 2026 earnings: what happened
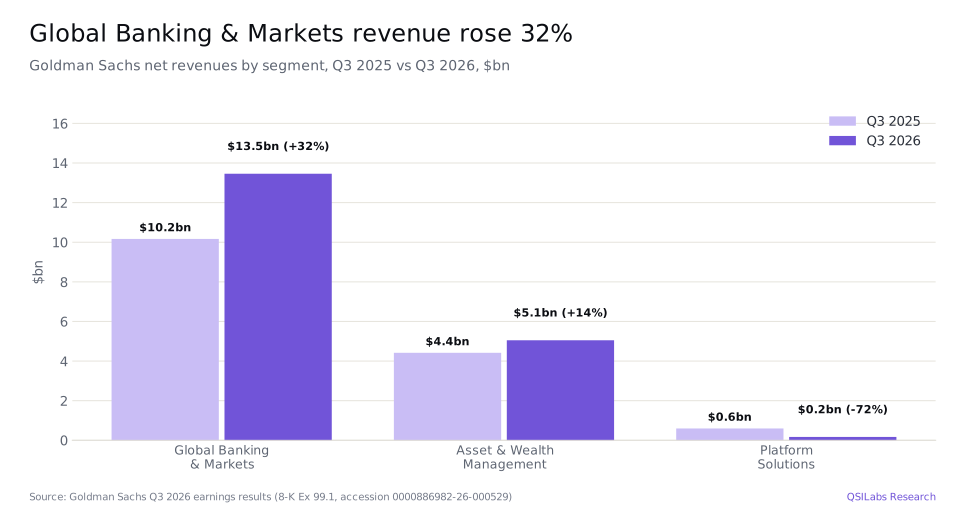
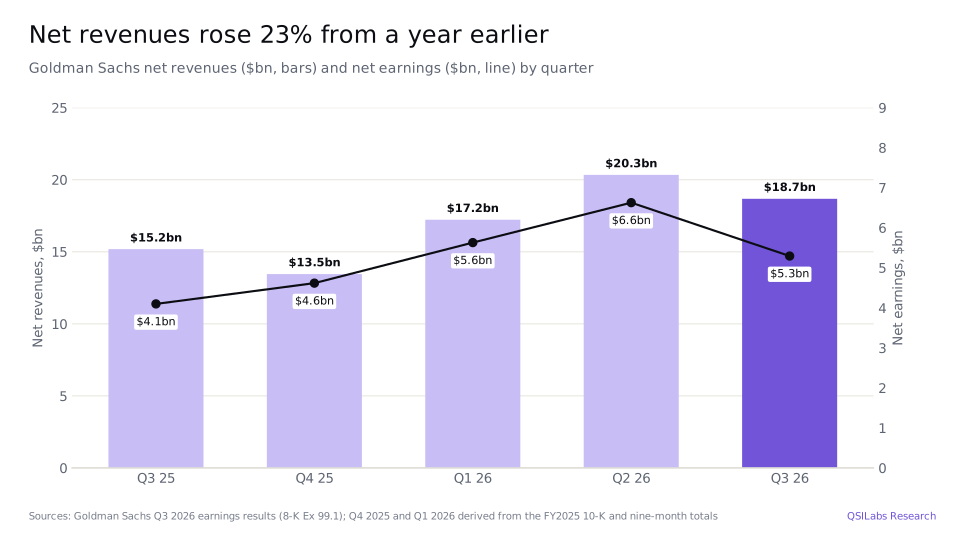
Goldman Sachs reported its third-quarter 2026 results on 13 October 2026. Net revenues were $18,679m, up from $15,184m a year earlier and down from $20,338m in the second quarter. Global Banking & Markets, the investment bank and trading business, brought in $13,458m; Asset & Wealth Management, the fund and private wealth business, brought in $5,051m; and Platform Solutions, the consumer and transaction platforms that include the Apple Card, brought in $170m (8-K Ex 99.1).
Costs grew more slowly than revenue. Operating expenses were $11,308m, up 20%. Compensation and benefits rose 9% to $5,122m, or 27.4% of net revenues against 30.8% a year earlier. Transaction-based expenses, the fees paid to exchanges and clearing houses that rise with trading volumes, were up 54% at $3,021m. Other expenses included about $450m of charitable contributions to Goldman Sachs Gives, which Goldman says cut diluted EPS by about $1.00 and annualized ROE by about 1.1 points. The efficiency ratio, expenses as a share of revenue, was 60.5%, against 62.3% a year earlier; for the first nine months it was 59.4% (8-K Ex 99.1; 8-K Ex 99.2).
The provision for credit losses was $368m, against $339m a year earlier and $102m in the second quarter, and mainly reflected impairments on wholesale loans. Net charge-offs were $154m, an annualized rate of 0.3%. Pre-tax earnings were $7,003m, up 30%, a pre-tax margin of 37.5%. After $1,709m of tax, net earnings were $5,294m and earnings for common shareholders $5,122m. Diluted EPS rose 39% to $17.01, faster than profit, because the average diluted share count fell 4% to 301.1m. The annualized return on equity was 18.7%, against 14.2% a year earlier and 23.5% in the second quarter (8-K Ex 99.1; 8-K Ex 99.2).
The first nine months were stronger still. Net revenues were $56,244m, up 25%; pre-tax earnings were $22,052m, up 38%; and diluted EPS was $55.56, against $37.33 in the first nine months of 2025, a rise of 49%. The nine-month return on equity was 20.7% and the pre-tax margin 39.2% (8-K Ex 99.1).
- 15 Jul 2026GS closes at $1,152.07, its highest close of the past yearYahoo Finance
- Aug 2026Agreements to buy NEOS Investments (up to about $2.25bn) and LCN Capital Partners (up to about $410m)Form 10-Q
- 1 Sep 2026Shares go ex-dividend for a $5.00 quarterly dividend, up from $4.50Yahoo Finance
- 30 Sep 2026Q3 2026 ends; GS closes at $900.36Yahoo Finance
- 12 Oct 2026Board declares a $5.00 dividend, record date 2 Dec, payable 30 Dec 20268-K Ex 99.1
- 13 Oct 2026Q3 results: net revenues $18.68bn, EPS $17.01. GS closes at $891.91, down 0.2%8-K Ex 99.1; Yahoo Finance
- 30 Oct 2026GS closes at $894.55, the price used in our valuationYahoo Finance
- 2 Nov 2026Form 10-Q for the quarter filed; GS closes at $898.72Form 10-Q; Yahoo Finance
- 30 Dec 2026$5.00 dividend payable8-K Ex 99.1
Why did Goldman Sachs' equities revenue rise 72%?
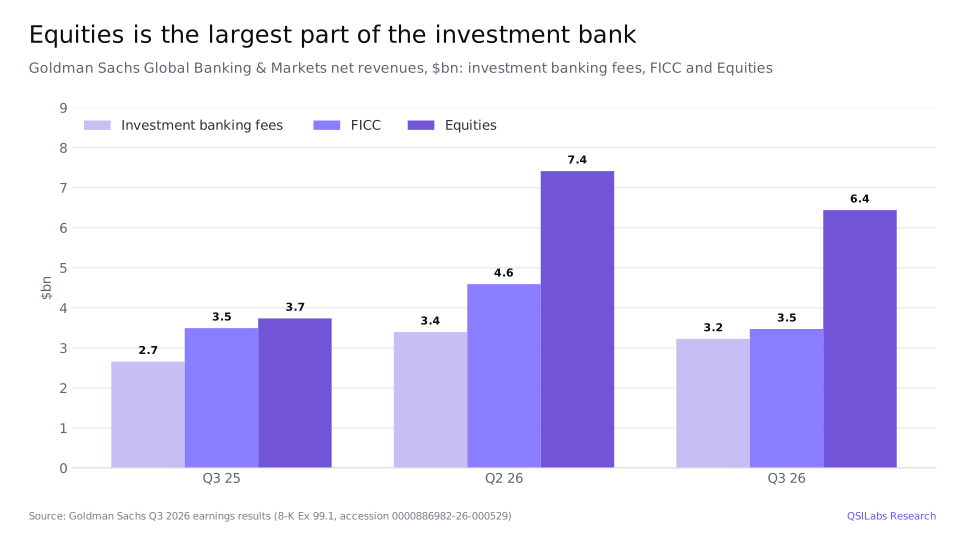
Equities, which covers trading in shares and equity derivatives and lending to hedge funds, earned $6,441m in the quarter, up from $3,736m. Both halves grew. Equities financing, mostly prime brokerage and portfolio financing for hedge funds and other investors, was $3,365m, up 96%, which Goldman describes as a record. Equities intermediation, the market-making side, was $3,076m, up 52%, mainly on derivatives (8-K Ex 99.1; 8-K Ex 99.2).
Fixed Income, Currency and Commodities, or FICC, was flat at $3,471m. FICC intermediation fell 7% to $2,264m on lower revenues in mortgages, credit and interest rate products, partly offset by currencies and commodities. FICC financing, which includes lending against mortgages and structured lending, rose 14% to $1,207m (8-K Ex 99.1).
Financing is the part of the trading business Goldman has been building because it is steadier than market-making: the firm earns a spread on balances rather than a profit on each trade. Across equities and FICC, financing revenue was $4,572m in the third quarter, 46% of the combined $9,912m, against 38% a year earlier (our calculation from 8-K Ex 99.1).
Global Banking & Markets' pre-tax earnings rose 36% to $5,782m, slightly faster than its revenue, and its return on average equity was 20.7% (8-K Ex 99.2).
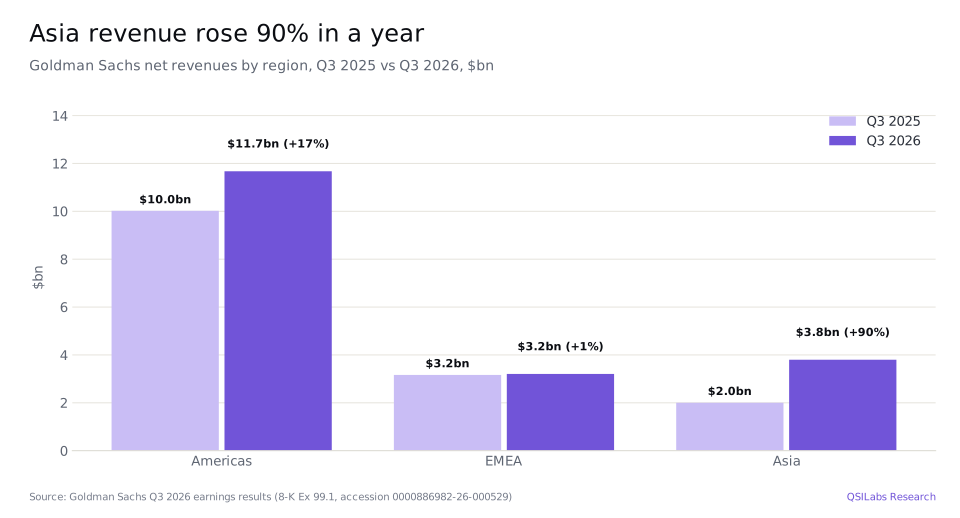
The geography is striking. Revenue booked in Asia was $3,800m, up 90% from $2,001m, and $10,458m over nine months, against $5,496m a year earlier. Asia made up 20% of firm revenue in the quarter, against 13% a year earlier. The Americas grew 17% to $11,674m, while Europe, the Middle East and Africa rose 1% to $3,205m (8-K Ex 99.1).
Investment banking fees, advisory and the backlog
Investment banking fees were $3,224m, up 21%. Advisory, the fees Goldman earns for advising on mergers, was $1,654m, up 18% on more completed deals; the firm calls it record Advisory net revenues. Equity underwriting rose 43% to $666m on more IPOs and secondary offerings, and debt underwriting rose 15% to $904m on investment-grade issuance (8-K Ex 99.1; 8-K Ex 99.2).
Goldman says it ranked first in announced and completed mergers and in equity and equity-related offerings in the first nine months of 2026, second in leveraged lending and third in high-yield debt, citing Dealogic (8-K Ex 99.2).
One caution: the firm's investment banking fees backlog fell from the end of the second quarter, mainly in Advisory, and is slightly lower than at the end of 2025. Fees in the first nine months were $9,459m, up 40%, so the comparison for the next few quarters is demanding (8-K Ex 99.1).
How did Asset & Wealth Management do in Q3 2026?
Asset & Wealth Management revenue was $5,051m, up 14%. Management and other fees, the recurring fees charged on client assets, were $3,587m, up 22% on higher average assets, which Goldman describes as a record. Incentive fees, the share of fund profits Goldman earns when funds distribute gains, were $587m against $76m. Private banking and lending revenue fell 22% to $827m because the year-earlier quarter included interest paid on a previously impaired loan, and Investments revenue fell to $50m from $342m, partly because of markdowns in debt investments (8-K Ex 99.1; 8-K Ex 99.2).
The segment's pre-tax earnings rose 14% to $1,316m, a pre-tax margin of 26%, and its return on average equity was 16.1%. For the first nine months the pre-tax margin was 24% (8-K Ex 99.2).
Assets under supervision rose $56bn in the quarter to $4.10trn, which Goldman calls a record, up 19% in a year. Long-term net inflows were $97bn: $47bn through wealth management, $31bn from institutions and $19bn through third-party distributors. Liquidity products, mostly money market funds, had $14bn of outflows, and market moves took off $27bn. Goldman says it was the 35th consecutive quarter of long-term fee-based net inflows (8-K Ex 99.2).
Alternatives are the growth engine. Alternative investments assets under supervision rose $32bn to $491bn, which the firm calls a record, management and other fees from alternatives were $860m, up 43%, and third-party fundraising was $37bn in the quarter and $122bn in the first nine months. In August 2026 Goldman agreed to buy NEOS Investments, a provider of options-based income exchange-traded funds, for up to about $2.25bn, and LCN Capital Partners, a real estate investment manager, for up to about $410m (8-K Ex 99.2; Form 10-Q).
Platform Solutions and the Apple Card exit
Platform Solutions revenue fell 72% to $170m and the segment made a pre-tax loss of $95m. The decline reflects markdowns on the Apple Card loans, which Goldman moved to held for sale in the fourth quarter of 2025 after agreeing in December 2025 to transfer the card programme to another issuer. Credit card loans were $20bn at 30 September 2026. The exit removes a loss-making consumer business, but until it closes the portfolio's value can still move the quarter's results (8-K Ex 99.1; 8-K Ex 99.2; Form 10-Q).
Goldman Sachs capital, CET1 ratio and buybacks
The Standardized CET1 ratio, common equity capital as a share of risk-weighted assets, was 12.4% at 30 September 2026, down from 12.9% at 30 June and 14.3% at the end of 2025. The ratio fell because risk-weighted assets grew faster than capital: they rose 12% in nine months to $815.8bn, while CET1 capital was $101.4bn against $104.3bn at the end of 2025. Goldman attributes the third-quarter decline mainly to higher market and credit risk-weighted assets. The Advanced ratio was 13.6% (Form 10-Q; 8-K Ex 99.2).
The requirement also rose. Goldman's Standardized CET1 requirement is 11.4%: the 4.5% minimum, a 3.4% stress capital buffer and a 3.5% surcharge for global systemically important banks, up from 3.0% in 2025. The ratio is therefore 1.0 point above the requirement, against 3.4 points at the end of 2025 (Form 10-Q).
In the third quarter the firm returned $4.49bn to common shareholders: $3.00bn of buybacks, 2.9m shares at an average of $1,048.73, and $1.49bn of dividends. That is 88% of the $5,122m earned for common shareholders. Basic shares were 295.6m, 4% fewer than a year earlier. On 12 October 2026 the board declared a dividend of $5.00 a share, payable on 30 December 2026 to holders of record on 2 December (8-K Ex 99.1).
We use a 12.0% Standardized CET1 ratio as a working target, about 0.6 points above the requirement. On that basis Goldman held about $3.5bn of surplus capital at 30 September 2026 (CET1 of $101.4bn less 12.0% of $815.8bn). That is much less room than a year ago, and it suggests buybacks will have to track earnings more closely unless capital rules ease.
Book value per share was $372.64, up 1.4% in the quarter and 4.2% this year, and tangible book value per share was $341.43. Deposits were $568bn and unsecured long-term borrowings $352bn (8-K Ex 99.1; 8-K Ex 99.2).
Goldman Sachs stock Q3 2026: is GS overvalued?
We value Goldman Sachs at $819.06 a share, 8.4% below the $894.55 close on 30 October 2026. At $894.55 the shares trade at 12.5 times consensus 2026 EPS of $71.50, 12.0 times 2027 EPS of $74.25 and 2.6 times tangible book value of $341.43, with a dividend yield of 2.2% on the $20 annual rate (StockAnalysis; 8-K Ex 99.2). The shares have fallen 22% from their highest close of the past year, $1,152.07 on 15 July 2026, and are 2% above where they ended 2025.
Method
We value Goldman Sachs on free cash flow to equity, the cash it could pay out each year after keeping enough capital to support its growth. Profit after tax is the starting point. From it we deduct the CET1 capital needed for growth: at a 12.0% CET1 ratio and today's ratio of risk-weighted assets to revenue, each extra dollar of revenue needs about $1.40 of retained equity. We discount the result at a 10.35% cost of equity, which is a 5.12% risk-free rate plus a beta of 1.17 times a 4.46% equity risk premium, the Damodaran average for brokerage and investment banking. Terminal growth is 2.5%, and the terminal value is 52% of the total.
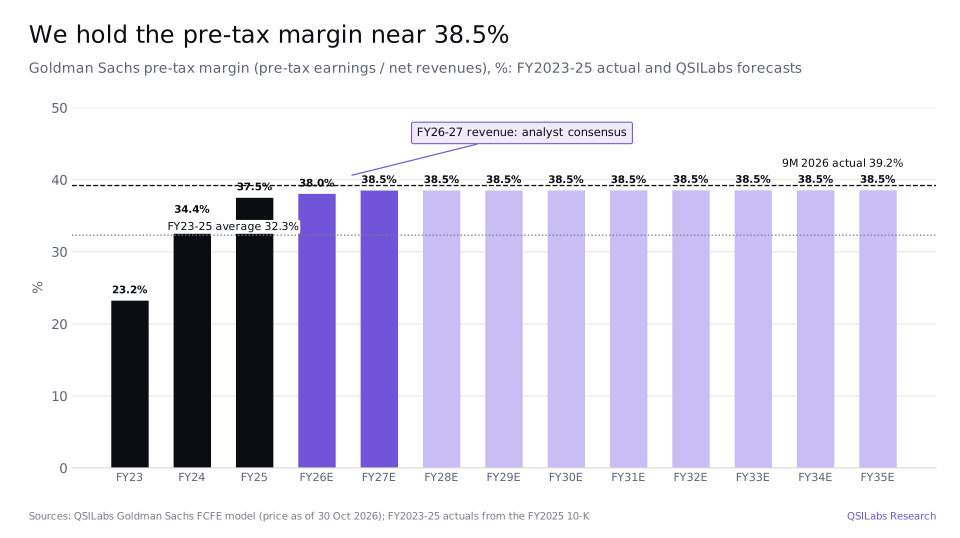
Revenue for 2026 is $71.96bn, up 23.5%, which is the $73.34bn analyst consensus restated to Goldman's reported basis, and for 2027 $72.87bn, up 1.3%, in line with consensus. After 2027 we assume growth of 4% a year, fading to 3% by 2033, which takes revenue to $95.96bn in 2035. The pre-tax margin is 38.0% in 2026 and about 38.5% from 2027, close to the 39.2% of the first nine months of 2026 but well above the 32.3% average of 2023 to 2025. That margin is the most important assumption in the model. Tax is 23%, against 20.4% in the first nine months of 2026.
The equity bridge adds the $3.5bn of surplus CET1 and about $0.6bn of cash we estimate the firm generated between the end of September and the valuation date, and deducts $14.8bn of preferred stock. We do not deduct deposits or Goldman's $352bn of unsecured long-term borrowings: for a bank and broker they are operating funding, and their cost is already in the profit we forecast. Dividing $246.0bn of equity value by 300.3m diluted shares gives $819.06.
Our new estimate is slightly above the previous $813.62, made at a price of $884.81 on 20 October 2026. It reflects the risk-weighted assets and share counts in the 10-Q filed on 2 November, refreshed consensus and a valuation date ten days later.
What would you have to believe to pay $894.55?
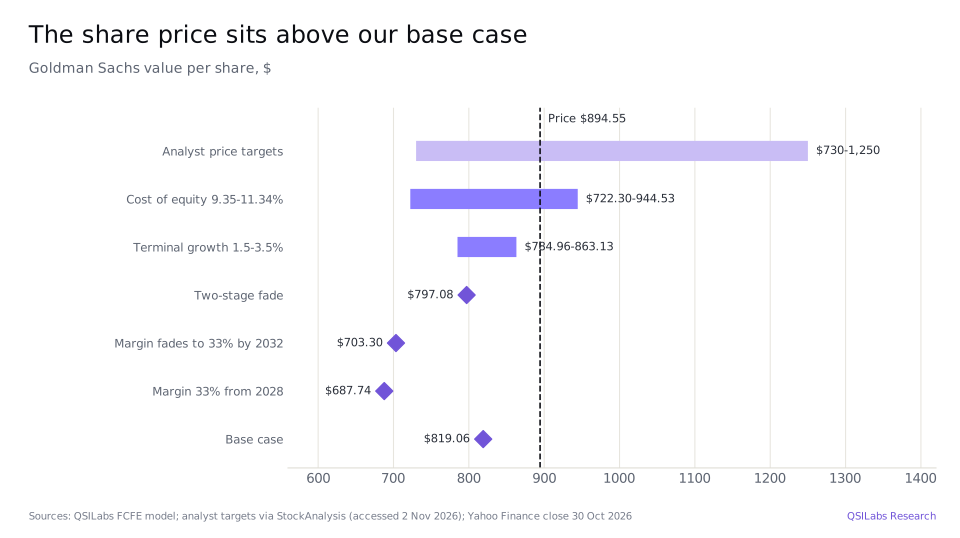
At $894.55 the market is pricing in more than our base case. Using our model's revenue path and cost of equity, the share price is consistent with a pre-tax margin of about 41.5% every year from 2027, above the 39.2% of the first nine months of 2026. Alternatively, holding our margins, the price implies a cost of equity of about 9.7% rather than 10.35%.
The downside cases are larger. If the margin fades to 33% by 2032, the value is $703.30; if it drops to 33% from 2028, $687.74; and at 35% from 2028, $735.21. Without the surplus-capital credit the value would be $807.25. At a cost of equity of 9.35% the value is $944.53 and at 11.34% it is $722.30. Changing terminal growth between 1.5% and 3.5% gives $784.96 to $863.13. A two-stage version that fades returns over another decade gives $797.08. In short, the shares look fully valued unless you believe today's margins hold and the discount rate falls below 10%.
Analysts are more positive than we are. StockAnalysis reports 26 analysts with a consensus Buy rating; their price targets average $1,031, with a median of $1,000, a low of $730 and a high of $1,250 (S&P Global data, page updated 23 October 2026).
Risks to the Goldman Sachs investment case
- Trading normalises. Equities revenue up 72% and Asia up 90% are unlikely to repeat every year. A quieter market for equity derivatives and prime brokerage would cut revenue quickly, as the 13% fall in Equities from the second quarter shows.
- Deal flow slows. The investment banking backlog fell in the quarter. Advisory and underwriting fees depend on confidence among chief executives and private equity sponsors, which can change fast.
- Margin assumption. Our value already assumes margins near 38.5%, close to the best Goldman has done. If revenue falls, costs such as technology and premises will not fall as quickly, and a margin of 33%, near the 2023-2025 average of 32.3%, would cut the value to about $688-705.
- Capital headroom. The CET1 ratio is 1.0 point above the requirement, against 3.4 points at the end of 2025. A higher stress capital buffer or further growth in risk-weighted assets could limit buybacks.
- Credit losses. Wholesale loan impairments drove the third-quarter provision. Loans have grown to $276bn from $222bn in a year, so a downturn would show up in provisions.
- Deals and the Apple Card exit. The NEOS and LCN acquisitions and the Apple Card transfer all carry execution risk, and the card portfolio's markdowns can still swing quarterly results until the transfer closes.
FAQ
What value does QSILabs put on Goldman Sachs stock after Q3 2026 earnings?
Our free-cash-flow-to-equity model values Goldman Sachs at $819.06 a share, 8.4% below the $894.55 close on 30 October 2026. The value rests on a pre-tax margin near 38.5% and a 10.35% cost of equity. With the margin back at 33% from 2028, it would be about $688.
Is Goldman Sachs stock a buy at about $895?
On our numbers it is fully valued rather than cheap: the price is 9% above our $819.06 value and implies a pre-tax margin of about 41.5% for years. Analysts are more positive, with an average target of $1,031. This is not investment advice.
How much did Goldman Sachs earn in the third quarter of 2026?
Goldman Sachs earned $5,294m in Q3 2026, or $17.01 per diluted share, against $4,098m and $12.25 a year earlier. Net revenues were $18,679m, up 23%, and the annualized return on equity was 18.7%.
What drove Goldman's trading revenue in Q3 2026?
Equities revenue rose 72% to $6,441m, with equities financing up 96% to $3,365m and intermediation up 52% on derivatives. FICC revenue was flat at $3,471m because lower mortgage and credit trading offset higher currency and commodity revenue.
Which Goldman Sachs businesses set records in Q3 2026?
Goldman described Advisory net revenues, equities financing, management and other fees, and assets under supervision of $4.10trn as records, and called its nine-month net revenues of $56.2bn a record for the period. The firm said Q3 net revenues were its second highest for a quarter.
How much capital does Goldman Sachs hold above its requirement?
Goldman's Standardized CET1 ratio was 12.4% at 30 September 2026, against a requirement of 11.4%, with $101.4bn of CET1 capital and $815.8bn of risk-weighted assets. At the end of 2025 the ratio was 14.3%.
What dividend does Goldman Sachs pay?
Goldman Sachs pays a quarterly dividend of $5.00 a share, up from $4.50 earlier in 2026. The next payment is on 30 December 2026 to holders of record on 2 December, a yield of about 2.2% at $894.55.
What is happening to Goldman's Apple Card business?
In December 2025 Goldman agreed to transfer the Apple Card programme to another issuer and moved the loans to held for sale. Markdowns on that portfolio cut Platform Solutions revenue by 72% to $170m in Q3 2026, and the segment lost $95m before tax.
Sources
- Goldman Sachs, third quarter 2026 earnings results (Form 8-K, Exhibit 99.1, 13 Oct 2026; accession 0000886982-26-000529) www.sec.gov
- Goldman Sachs, third quarter 2026 earnings results presentation (Form 8-K, Exhibit 99.2, 13 Oct 2026; accession 0000886982-26-000529) www.sec.gov
- Goldman Sachs, Form 10-Q for the quarter ended 30 Sep 2026 (filed 2 Nov 2026; accession 0000886982-26-000532) www.sec.gov
- Goldman Sachs, Form 10-K for the year ended 31 Dec 2025 (accession 0000886982-26-000091) www.sec.gov
- StockAnalysis: Goldman Sachs forecast and analyst ratings, S&P Global data (page updated 23 Oct 2026, accessed 2 Nov 2026) stockanalysis.com
- StockAnalysis: Goldman Sachs statistics (accessed 2 Nov 2026) stockanalysis.com
- Yahoo Finance chart data: GS closing prices and dividends (November 2025 to November 2026) query1.finance.yahoo.com
- Damodaran Online: cost of capital by industry, brokerage and investment banking pages.stern.nyu.edu
- QSILabs Goldman Sachs FCFE model (internal; price as of 30 Oct 2026)
Disclaimer
This article is for information only and is not investment advice, a recommendation or an offer to buy or sell any security. QSI Labs and its authors may hold positions in the securities discussed. Forecasts and valuations are estimates that depend on assumptions that may prove wrong. Figures are taken from company filings and third-party sources believed to be reliable, but we do not guarantee their accuracy. Do your own research or consult a licensed adviser before investing.
More from QSI Labs
Related analysis: Morgan Stanley stock Q3 2026: wealth and equities, JPMorgan stock Q3 2026: NII, buybacks and capital, Bank of America stock Q3 2026: NII and capital and Visa stock Q3 2026: cross-border growth.
Read our white paper, QSI Labs: An AI-Native Trading Firm Built on a Training Loop (October 2026), available on request, or browse the research index.