Research / Earnings and valuation
Boeing Stock Q3 2026:737-10 Certified and a $10bn Cash Flow Target
As of: Figures are as of The Boeing Company's third-quarter 2026 results (the quarter ended 30 September 2026, reported 27 October 2026 in a Form 8-K) and its Form 10-Q for that quarter, filed on 27 October 2026. Boeing's fiscal year is the calendar year, so its Q3 2026 covers July to September 2026. The share price used in our valuation is the NYSE close of BA on 2 November 2026, $175.40; analyst data were accessed on 2 November 2026. Published 2 November 2026.
The short answer. Boeing stock Q3 2026 is a story of a slow factory recovery set against a long climb to the cash flow the company has promised. In the three months to 30 September 2026, revenue rose 4% to $24,188m and Boeing made an operating profit of $354m, against a $4,781m loss a year earlier that included a charge on the 777X. Commercial Airplanes still lost $697m, but the 737-7 and 737-10 won certification, the US Navy picked Boeing for its F/A-XX fighter and free cash flow was $464m. Boeing said it expects about $2bn of free cash flow in 2026, about $3bn in 2027, about $6bn in 2028 and $10bn in 2029. Our discounted cash flow model gives $123.27 a share, against a $175.40 close on 2 November 2026; below we explain why it is lower and how far it moves when you change our assumptions.
Key takeaways
- Revenue rose 4% to $24.2bn. Defense, Space & Security grew 15% to $7,935m and Global Services 4% to $5,574m, while Commercial Airplanes fell 3% to $10,720m on a less favourable delivery mix.
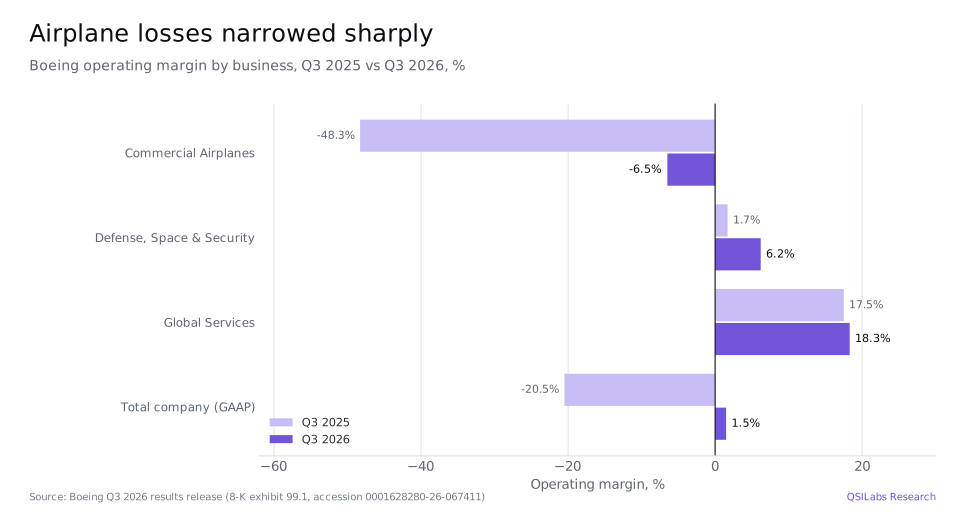
- Boeing made an operating profit. GAAP operating earnings were $354m, a 1.5% margin, against a $4,781m loss in the third quarter of 2025. The net loss narrowed to $116m, or $0.26 a share, from $5,339m.
- Airplane losses narrowed but did not end. Commercial Airplanes delivered 161 aircraft, including 124 737s and 22 787s, and lost $697m, a margin of minus 6.5%. Boeing expects that margin to reach breakeven in early 2028.
- Two certifications and a fighter. The 737-7 received amended type certification in the quarter and the 737-10 in October, and the Navy selected Boeing to design and build the F/A-XX, an order not yet in backlog.
- Cash flow targets were confirmed. Free cash flow was $464m in the quarter and minus $359m for nine months. Boeing expects about $3bn in 2027 and $10bn in 2029.
- Our value: $123.27 a share, 70% of the $175.40 close on 2 November 2026. Analysts' average target is $235.65. Our value is lower mainly because we use a 10.58% cost of capital; at the 8.73% US industry rate the same forecasts give $170.95.
- What to watch. The move to 52 737s a month in the second half of 2027, 787 output rising to 10 a month, 777X certification and first delivery in 2027, and whether 2027 cash flow reaches about $3bn.
Key numbers from Boeing's Q3 2026 earnings
| Measure | Q3 2026 | Q3 2025 | Change |
|---|---|---|---|
| Total revenue | $24,188m | $23,270m | +4% |
| Commercial Airplanes revenue | $10,720m | $11,094m | -3% |
| Defense, Space & Security revenue | $7,935m | $6,902m | +15% |
| Global Services revenue | $5,574m | $5,370m | +4% |
| Commercial airplane deliveries | 161 | 160 | +1% |
| GAAP operating earnings | $354m | -$4,781m | n/m |
| GAAP operating margin | 1.5% | -20.5% | +22.0 pts |
| Core operating earnings (non-GAAP) | $204m | -$5,049m | n/m |
| Net loss | -$116m | -$5,339m | n/m |
| Diluted loss per share | -$0.26 | -$7.14 | n/m |
| Core loss per share (non-GAAP) | -$0.34 | -$7.47 | n/m |
| Operating cash flow | $1,496m | $1,123m | +33% |
| Free cash flow (non-GAAP) | $464m | $238m | +95% |
| Total backlog | $745bn | n/a | n/a |
Boeing Q3 2026 earnings: what happened
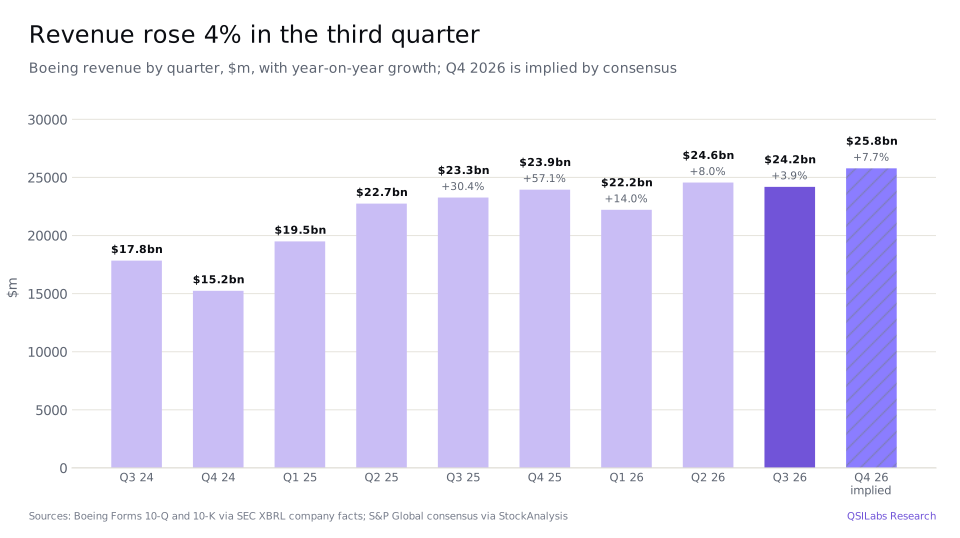
Boeing reported third-quarter results on 27 October 2026 and filed its Form 10-Q the same day. Revenue of $24,188m was 3.9% higher than a year earlier; for the first nine months revenue rose 8% to $70,965m, helped by 475 commercial deliveries against 440. The analysts' consensus for 2026 revenue, $96.75bn, implies fourth-quarter revenue of about $25.8bn, 7.7% more than in the fourth quarter of 2025.
The year-ago comparison flatters the profit line. In the third quarter of 2025 Commercial Airplanes took a charge on the 777X programme, which drove a $4,781m operating loss. This year Boeing earned $354m from operations. Chief executive Kelly Ortberg said: "Recent milestones, including certification of the 737-7 and 737-10 and selection to design and build the Navy's sixth-generation fighter aircraft, are important steps as we continue building on our progress." He added: "But we are not done."
Total backlog grew to $745bn, which Boeing calls a record, including more than 6,300 commercial airplanes valued at $612bn.
- 31 Dec 2025BA closes 2025 at $217.12; 2025 revenue was $89,463mYahoo; Form 10-K
- 23 Jan 202652-week closing high of $252.15Yahoo Finance
- 30 Jan 2026Form 10-K for 2025 filedSEC XBRL company facts
- Q3 2026737-7 receives amended type certification from the FAA; $252m gain on the HRL Laboratories sale8-K earnings release
- October 2026737-10 receives certification; Boeing selected by the US Navy for the F/A-XX fighter8-K earnings release
- 27 Oct 2026Q3 results and Form 10-Q: revenue up 4%, free cash flow of $464m; BA closes at $168.18, down 10.7%8-K; SEC; Yahoo
- 28 Oct 202652-week closing low of $167.14Yahoo Finance
- 2 Nov 2026BA closes at $175.40, the price used in our valuationYahoo Finance
- End of 2026787 production expected to move from 8 to 10 a monthQ3 2026 call
- 2027First 777X delivery; 737 at 52 a month in the second half; free cash flow of about $3bn8-K; Q3 2026 call
- Early 2028Commercial Airplanes margin expected to reach breakevenQ3 2026 call
- 2029$10bn free cash flow targetQ3 2026 call
How did each Boeing business perform?
Commercial Airplanes delivered 161 airplanes, one more than a year earlier, but revenue fell 3% to $10,720m. Boeing said the minus 6.5% margin reflects a less favourable delivery mix, higher projected costs from future production rate changes and higher estimated supply chain costs. The 737 programme is still working towards stable production of 47 a month and the 787 is building 8 a month. Commercial Airplanes booked 300 net orders, including from Turkish Airlines, Ethiopian Airlines and Lufthansa.
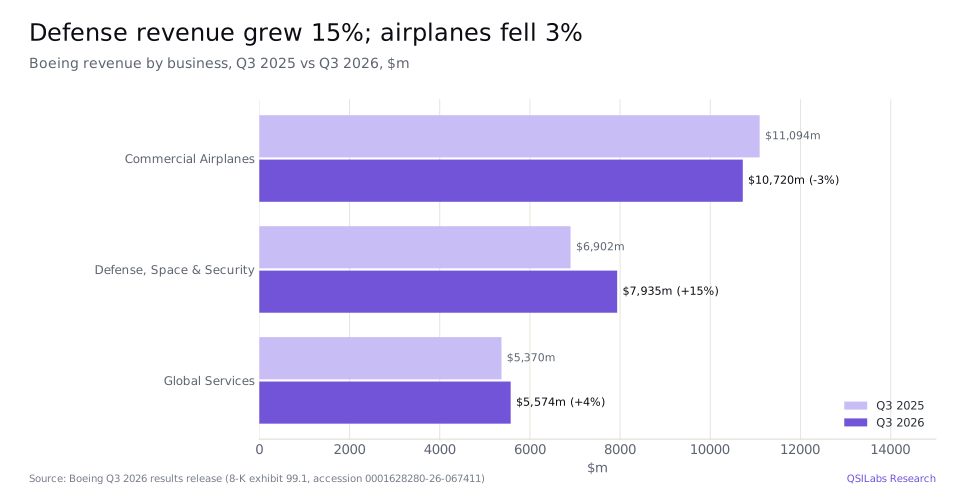
Defense, Space & Security revenue rose 15% to $7,935m on higher volume. Its 6.2% margin includes a $252m gain on the sale of HRL Laboratories; without the gain the margin would have been about 3.0%. Besides the F/A-XX selection, the unit won a seven-year award to expand PAC-3 Seeker production, and its backlog grew to $101bn, which Boeing calls a record, with 23% from customers outside the US. On the call management said it remains confident of a path to high single digit operating margins.
Global Services revenue rose 4% to $5,574m and its margin improved to 18.3% from 17.5% on favourable volume and mix. It won an award to maintain the US Army's AH-64 Apache fleet and ended the quarter with a $33bn backlog.
Where did the cash go in the quarter?
Operating cash flow was $1,496m, up from $1,123m, after about $0.7bn of payments under Boeing's settlement with the Department of Justice. Capital spending rose to $1,032m from $885m, mainly for the Charleston and St. Louis sites, so free cash flow was $464m. Over nine months operating cash flow was $2,681m and capital spending $3,040m, leaving free cash flow of minus $359m.
Boeing ended September with $20.7bn of cash and marketable securities, up from $20.0bn in June, and $45.9bn of debt, unchanged. Its $10.0bn of credit facilities remain undrawn. Interest and debt expense was $573m in the quarter.
What did Boeing say about cash flow to 2029?
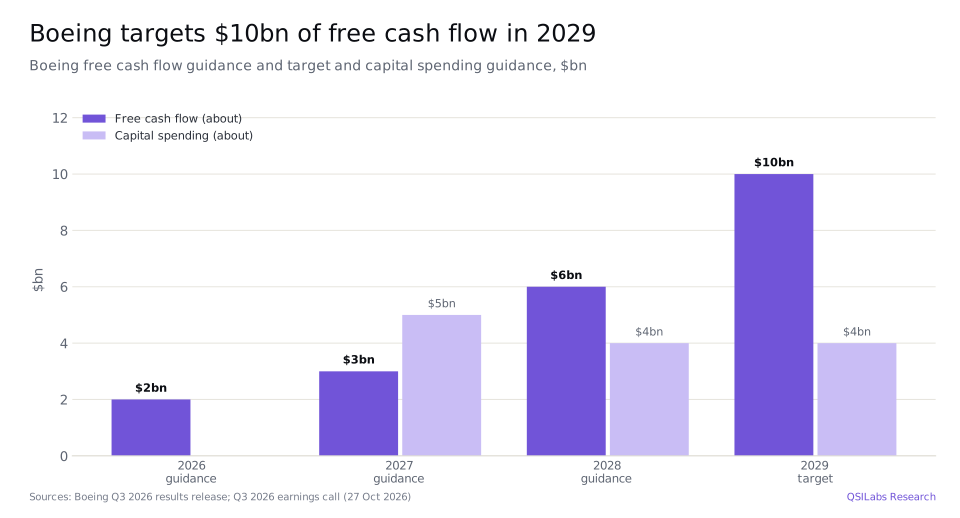
On the call Ortberg said Boeing had narrowed its range and expects about $2bn of free cash flow in 2026, supported by the timing of a KC-46A tanker order. He expects about $3bn in 2027, including about $1bn of extra capital spending for growth and recent awards such as the F/A-XX, about $6bn in 2028 and the $10bn target in 2029, and said Boeing continues to see "significant growth potential beyond $10 billion". The 2029 target assumes 737 production of 52 to 58 a month and 787 production of 12 a month.
On capital spending, management said: "for 27, about $5 billion... 2028 and 2029 would be around $4 billion each". Asked about cash taxes, chief financial officer Jesus "Jay" Malave said: "We will not start to have taxes kick in until the early 20 thirties."
On production, Boeing expects 737 deliveries in 2026 to fall short of its 500 target because it took longer to stabilise output at 47 a month, and plans to reach 52 a month in the second half of 2027. It expects 787 deliveries near the low end of its 90 to 100 range and 787 output to rise to 10 a month by the end of 2026. The 777X is being built at about one a month, and Boeing has provisioned for certification to slip to mid-2027 without exceeding its cost estimates; the first delivery remains planned for 2027. Management expects total commercial deliveries to rise by more than 10% in 2027.
Boeing stock performance in 2026
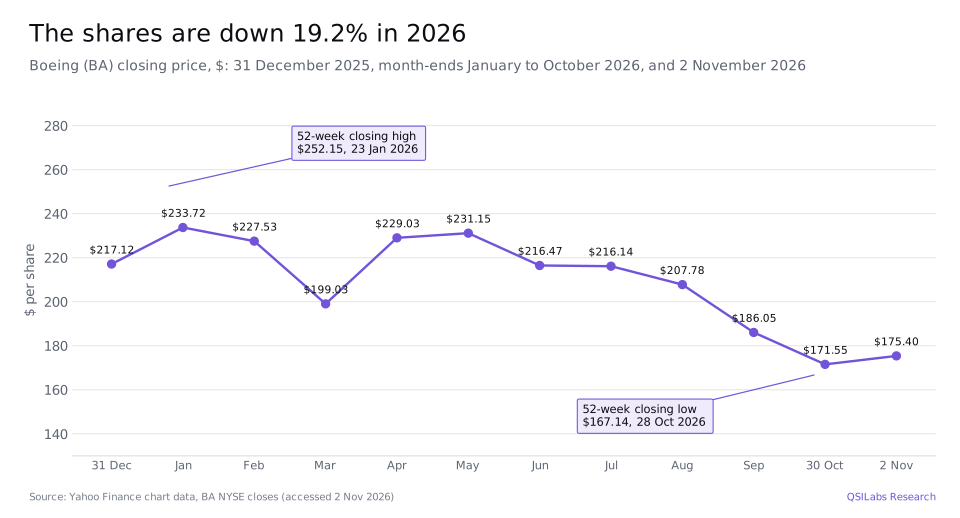
Boeing shares closed 2025 at $217.12 and reached a 52-week closing high of $252.15 on 23 January 2026. They fell 10.7% to $168.18 on 27 October, the day of the results, from $188.31, and hit a 52-week closing low of $167.14 the next day. On 2 November they closed at $175.40, down 19.2% for the year and 30.4% below the January high. Boeing pays no dividend. At $175.40 its market value is about $145.5bn on 829.4m shares, counting its mandatory convertible preferred shares as converted.
Boeing stock Q3 2026: is BA overvalued?
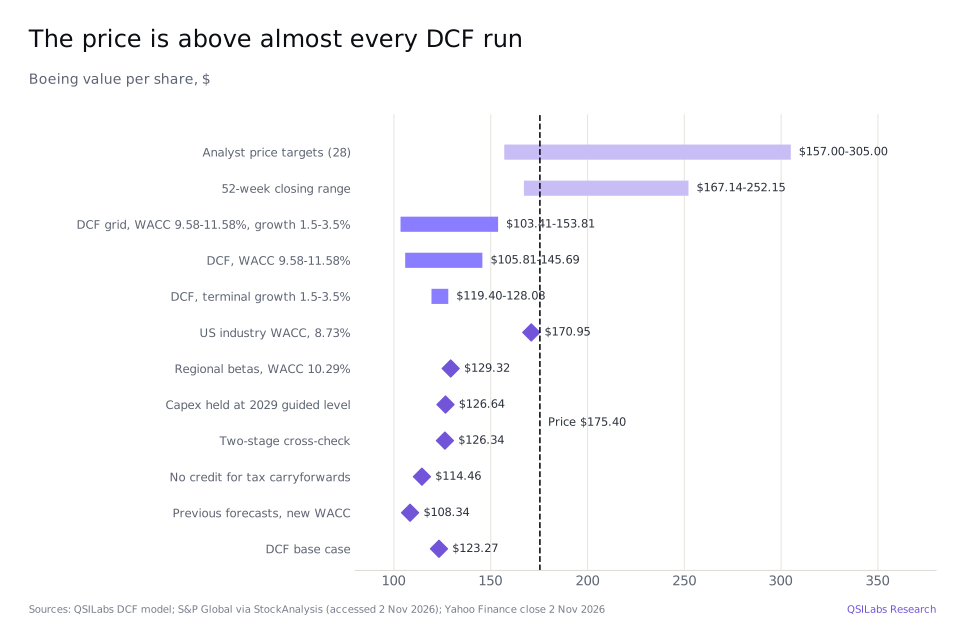
On our numbers, yes. Our discounted cash flow model gives $123.27 a share, 70% of the $175.40 close on 2 November 2026. The 28 analysts tracked by S&P Global disagree: their consensus rating is Strong Buy and their average price target is $235.65, about 34% above the share price, with a low of $157 and a high of $305.
Our value is below the share price for three plain reasons. First, our 10.58% cost of capital is high: it uses a global industry beta that, adjusted for Boeing's debt, is 1.40, and it charges a higher risk premium on the 46% of revenue earned outside the US. Damodaran's US aerospace and defence cost of capital is 8.73%, and at that rate our forecasts give $170.95, close to the share price. Second, we assume the operating margin reaches about 12%, the median of five large US aerospace and defence peers, and stays there. Third, the terminal value after 2035 is 7.0 times that year's operating profit before depreciation and amortisation (EBITDA). At $175.40 the shares trade at 73 times the 2027 consensus earnings of $2.39 a share.
Method
We forecast revenue, operating profit, tax, depreciation, capital spending and working capital for each year to 2035, discount the free cash flow at our cost of capital and assume growth of 2.5% a year after 2035. Only the part of 2026 after 2 November is discounted.
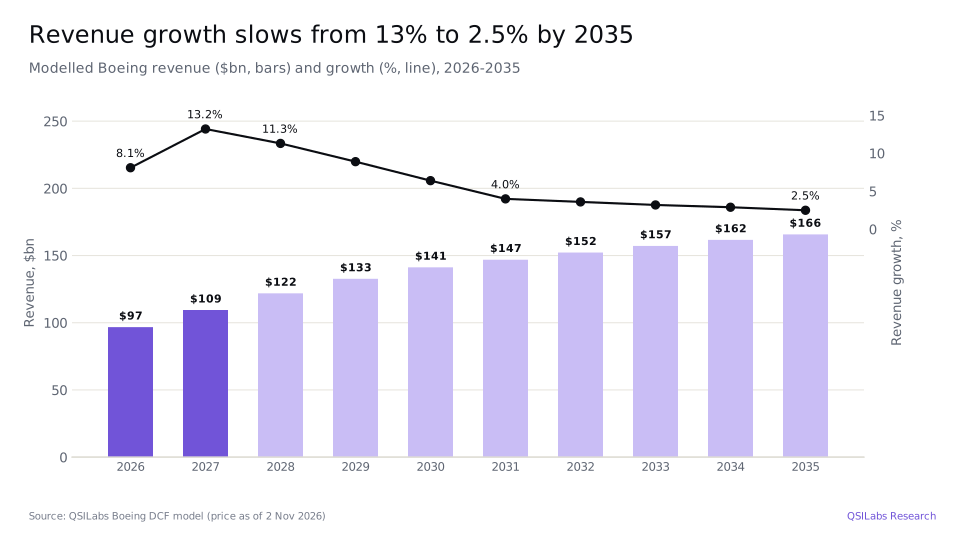
For 2026 revenue is $96,750m, the analysts' consensus. Operating profit is $1,674m: $958m reported for nine months and $716m for the fourth quarter, derived from the consensus. Revenue grows 13.2% in 2027, to the $109.50bn consensus, and 11.3% in 2028, in line with S&P Global's forecast of 10.86% annual growth over three years from 2025. Growth then slows to 4.0% in 2031, the passenger traffic growth Boeing's 2026 Commercial Market Outlook expects each year to 2045, and to 2.5% in 2035.
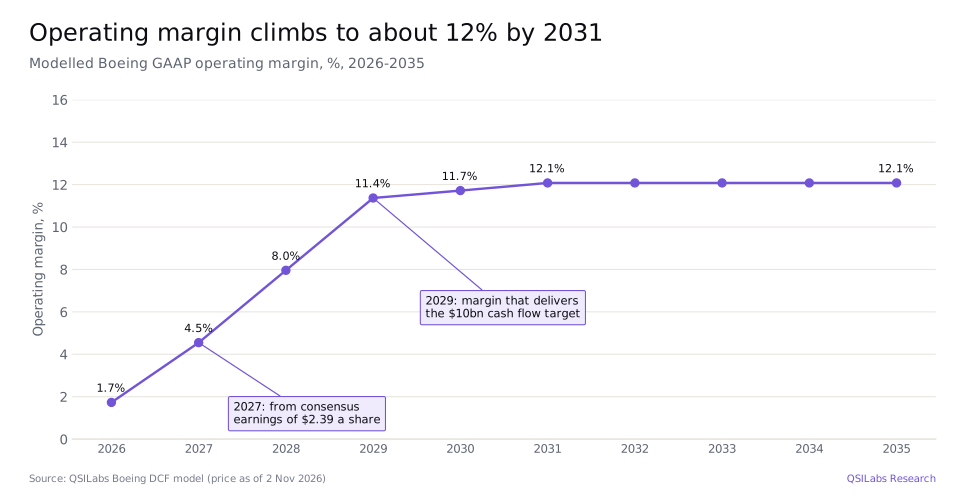
The 2027 operating margin, 4.55%, comes from the consensus earnings of $2.39 a share. For 2029 we set the margin, 11.37%, at the level at which free cash flow after interest equals Boeing's $10bn target. The margin is 7.96% in 2028 and 11.72% in 2030, and from 2031 it is 12.08%, the median of Lockheed Martin, General Dynamics, Northrop Grumman, RTX and Howmet Aerospace. Depreciation falls from 2.47% of revenue to 2.42%, the 2024-2026 average. Capital spending is $4,072m in 2026, nine months' actual spending plus the third-quarter level, then $5bn in 2027 and $4bn in each of 2028 and 2029, as guided. After that it rises to 4.0% of revenue by 2035, the level our house rule requires for 2.5% growth at a 15% return on new capital. Working capital is minus 0.9% of each year's extra revenue, Boeing's balance-sheet ratio. Free cash flow before interest is minus $0.30bn in 2026, $1.74bn in 2027, $11.27bn in 2029 and $13.18bn in 2035.
Our 2027 free cash flow is below the roughly $3bn Boeing expects because we do not forecast the customer advances and other working capital gains in its outlook, and because we charge the 21% US tax rate on profit. Boeing does not expect to pay much cash tax until the early 2030s, so we add the value of its tax losses and credits separately: tax at 21% on our forecast profit after interest from 2027, capped at the $9.75bn valuation allowance Boeing holds against its deferred tax assets and discounted at our cost of capital, which is $7.30bn.
The 10.58% cost of capital combines a 12.31% cost of equity with a 6.46% pre-tax cost of debt, 5.10% after tax, at a 24.0% debt weight, so no high-leverage flag applies. The cost of equity is a 5.12% risk-free rate plus a beta of 1.40 times an equity risk premium of 5.13%. The beta is Damodaran's January 2026 global aerospace and defence beta of 1.12 without debt, adjusted for Boeing's debt-to-equity ratio of 0.32. Boeing's own five-year beta is lower, at 1.26. The 5.13% premium weights Damodaran's regional premiums by where Boeing's 2025 revenue came from, with 53.7% from the US. The terminal value is 53.5% of our enterprise value of $124.36bn.
To get from enterprise value to equity we add cash and investments of $20,714m and deduct all $45,920m of debt and $15m of minority interests. We deduct $4,750m for pension and retiree health deficits after tax and $345m for the remaining dividends on the mandatory convertible preferred shares, add $916m for equity-method investments at book value and $7,300m for the tax losses and credits, and deduct $27m of other items. That gives equity value of $102.24bn, or $123.27 a share on 829.4m shares: 792.5m common shares, 3.4m for dilutive awards and 33.5m from the preferred shares.
Our previous model, dated 27 October and priced at $168.18, gave $154.39 using the 8.73% US industry cost of capital. Our new forecasts at that rate give $170.95, so the fall comes from the higher cost of capital; the old forecasts, without the tax credit, at the new rate, price and balance sheet give $108.34.
How the number moves if you argue with us
The table shows our value per share at different costs of capital and terminal growth rates. Only the US industry cost of capital brings the value near the share price; the highest value in the grid is $153.81.
| Cost of capital | Growth 1.5% | Growth 2.0% | Growth 2.5% | Growth 3.0% | Growth 3.5% |
|---|---|---|---|---|---|
| 9.58% | $139.44 | $142.38 | $145.69 | $149.46 | $153.81 |
| 10.08% | $128.82 | $131.14 | $133.73 | $136.65 | $139.97 |
| 10.58% | $119.40 | $121.23 | $123.27 | $125.53 | $128.08 |
| 11.08% | $110.98 | $112.43 | $114.03 | $115.79 | $117.76 |
| 11.58% | $103.41 | $104.56 | $105.81 | $107.19 | $108.70 |
We also ran the model with other assumptions. Giving no value to the tax losses and credits gives $114.46. Holding capital spending at its 2029 guided level of about 3.0% of revenue to 2035, instead of letting it rise, gives $126.64. A cost of capital of 10.29%, which uses a separate industry beta for each region, gives $129.32, and the US industry rate of 8.73% gives $170.95. A two-stage version of the model, which fades returns on new investment over a further ten years, gives $126.34.
The market and our model can both be right only if Boeing earns well above a 12% margin once production recovers, or deserves a cost of capital close to the US industry rate. Its $745bn backlog and 6,300 unbuilt airplanes show why investors expect a long recovery; on our numbers the price already assumes most of it.
Risks to the Boeing investment case
- Production. The cash flow targets depend on 737 output of 52 to 58 a month and 787 output of 12 a month by 2029. Boeing has already said 2026 737 deliveries will fall short of 500.
- Certification. The 777X still needs certification before its first delivery in 2027, and Boeing said its cost estimates allow for certification to slip to mid-2027.
- Supply chain and costs. Boeing blamed higher supply chain costs and production rate changes for part of the Commercial Airplanes loss, and 787 deliveries are held back by seat certification and engine supply.
- Fixed-price defence work. Boeing lists its reliance on fixed-price contracts among its risks, and 35% of its 2025 revenue came from the US government. The F/A-XX is not yet in backlog.
- Debt. Boeing carries $45.9bn of debt against $20.7bn of cash, and interest cost $573m in the quarter.
- Valuation risk. At $175.40 the shares trade at 73 times 2027 consensus earnings and 1.4 times our base case. A slower ramp or a higher cost of capital would widen the gap.
FAQ
What value does QSILabs put on Boeing stock?
$123.27 a share, from our discounted cash flow model priced on 2 November 2026, when the shares closed at $175.40. Across costs of capital of 9.58% to 11.58% and terminal growth of 1.5% to 3.5% the value ranges from $103.41 to $153.81; at the 8.73% US industry cost of capital it is $170.95.
Should I buy BA stock after the Q3 2026 results?
We do not give buy or sell advice. On our assumptions the shares trade above our value, but analysts are much more positive, with a Strong Buy consensus and an average target of $235.65. The answer depends on whether you think Boeing can reach its production rates and $10bn cash flow target, and what return you require.
How much revenue did Boeing make last quarter?
$24,188m in the quarter to 30 September 2026, up 4% from $23,270m. Commercial Airplanes contributed $10,720m, Defense, Space & Security $7,935m and Global Services $5,574m.
How many planes did Boeing deliver in Q3 2026?
Boeing delivered 161 commercial airplanes, up from 160, including 124 737s and 22 787s. In the first nine months it delivered 475, up from 440.
Is Boeing profitable again?
Partly. Boeing made a GAAP operating profit of $354m in the third quarter, but still reported a net loss of $116m, or $0.26 a share, because of $573m of interest expense. Commercial Airplanes lost $697m, while defence and services were profitable.
What is Boeing's free cash flow guidance?
About $2bn in 2026, about $3bn in 2027 and about $6bn in 2028, with a $10bn target for 2029. Boeing generated $464m of free cash flow in the third quarter and minus $359m in the first nine months.
What is the F/A-XX contract?
The US Navy selected Boeing in the third quarter to design, build and deliver the F/A-XX, its next-generation fighter. Boeing has not added the order to backlog while the source selection review is completed, and it plans extra capital spending for the programme from 2027.
What price target do analysts have for BA?
The 28 analysts tracked by S&P Global have an average target of $235.65, about 34% above the $175.40 close on 2 November 2026, with a low of $157 and a high of $305. Their consensus rating is Strong Buy, and they expect earnings of $2.39 a share in 2027 after a loss of $1.87 in 2026.
How did BA shares react to the results?
Boeing shares fell 10.7% from $188.31 to $168.18 on 27 October 2026, the day it reported, and closed at $167.14 the next day, their lowest close in a year. They closed at $175.40 on 2 November 2026.
Sources
- The Boeing Company, third-quarter 2026 earnings release (Form 8-K exhibit 99.1, 27 Oct 2026; accession 0001628280-26-067411) www.sec.gov
- The Boeing Company, Form 10-Q for the quarter ended 30 Sep 2026 (filed 27 Oct 2026; accession 0001628280-26-067508) www.sec.gov
- The Boeing Company, Form 10-K for the year ended 31 Dec 2025 (filed 30 Jan 2026; accession 0001628280-26-004357) www.sec.gov
- SEC XBRL company facts for The Boeing Company (CIK 12927): quarterly and annual revenue and operating profit from Forms 10-Q and 10-K data.sec.gov
- The Motley Fool: Boeing (BA) Q3 2026 earnings call transcript (accessed 2 Nov 2026) www.fool.com
- StockAnalysis: Boeing forecast and analyst ratings, S&P Global data (accessed 2 Nov 2026) stockanalysis.com
- StockAnalysis: Boeing statistics, S&P Global data (accessed 2 Nov 2026) stockanalysis.com
- Boeing Commercial Market Outlook 2026-2045 (accessed 2 Nov 2026) www.boeing.com
- Boeing press release: Global commercial fleet will top 50,000 airplanes in 20 years as passenger traffic doubles (2026; accessed 2 Nov 2026) investors.boeing.com
- Yahoo Finance chart data: BA closing prices (November 2025 to November 2026) query1.finance.yahoo.com
- Damodaran Online: betas and cost of capital by industry (global) and country risk premiums, January 2026 pages.stern.nyu.edu
- QSILabs Boeing discounted cash flow model (internal; price as of 2 Nov 2026)
Disclaimer
This article is for information only and is not investment advice, a recommendation or an offer to buy or sell any security. QSI Labs and its authors may hold positions in the securities discussed. Forecasts and valuations are estimates that depend on assumptions that may prove wrong. Figures are taken from company filings and third-party sources believed to be reliable, but we do not guarantee their accuracy. Do your own research or consult a licensed adviser before investing.
More from QSI Labs
Related analysis: GE Aerospace stock Q3 2026: LEAP, services and backlog, RTX stock Q3 2026: backlog and guidance, Caterpillar stock Q3 2026: power generation and backlog and Union Pacific stock Q3 2026: volumes and the Norfolk Southern merger.
Read our white paper, QSI Labs: An AI-Native Trading Firm Built on a Training Loop (October 2026), available on request, or browse the research index.