Research / Earnings and valuation
BlackRock Stock Q3 2026:Revenue Up 19% on $205bn of Net Inflows
As of: Figures are as of BlackRock, Inc.'s results for the quarter ended 30 September 2026, reported 14 October 2026 in a Form 8-K, and the 14 October 2026 earnings call. BlackRock's fiscal year is the calendar year, and its Form 10-Q for the quarter had not been filed by 2 November 2026, so balance-sheet figures are from 30 June 2026. The share price used in our valuation is the NYSE close of BLK on 2 November 2026, $1,167.15; analyst data were accessed on 2 November 2026. Published 2 November 2026.
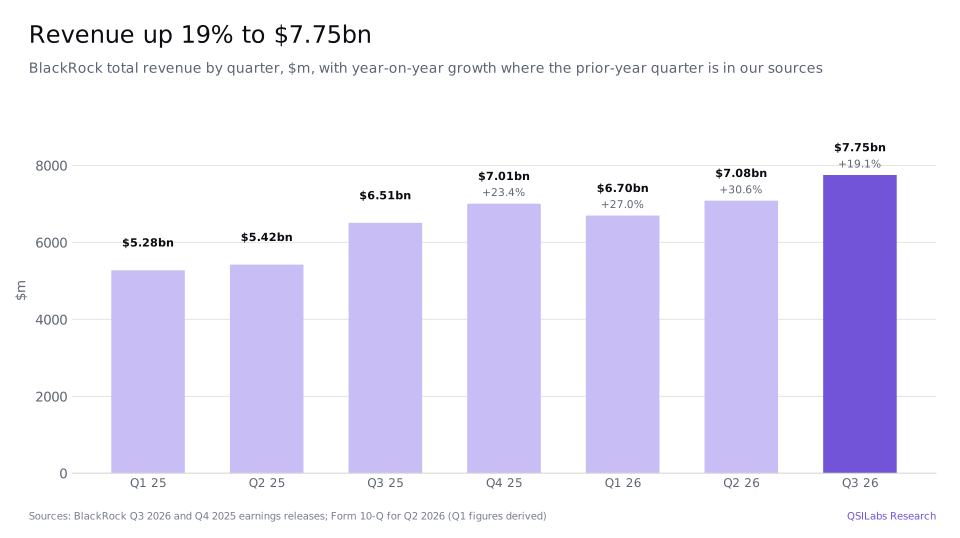
The short answer. BlackRock stock Q3 2026 comes down to a quarter in which clients added $205.5bn of new money to the world's largest asset manager and its higher-fee businesses, private markets, active ETFs and technology, kept growing faster than the rest. Revenue for the three months to 30 September 2026 rose 19% to $7.75bn, assets under management reached $15.49tn and as-adjusted EPS rose 38% to $15.93. Chief financial officer Martin Small said revenue, operating income and EPS were "all three measures reaching new records". GAAP operating margin stayed at 30.0% because of a $564m charge for acquisition earn-outs. Our discounted cash flow model values BlackRock at $1,350.10 a share, about 16% above the $1,167.15 close on 2 November 2026, and close to the analysts' median target of $1,350.
Key takeaways
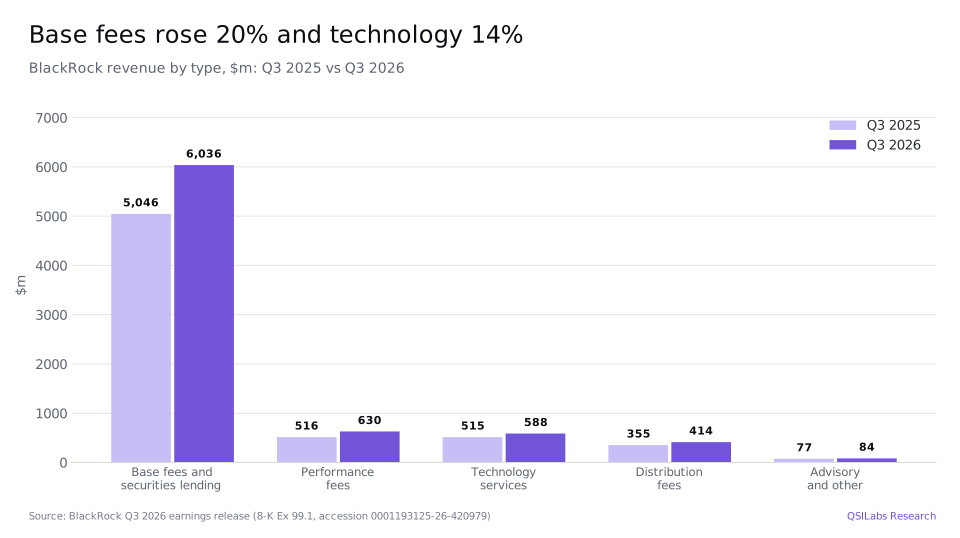
- Revenue up 19%. Third-quarter revenue was $7,752m, against $6,509m a year earlier and $7,084m in the June quarter. Base fees and securities lending revenue rose 20% to $6,036m and performance fees 22% to $630m.
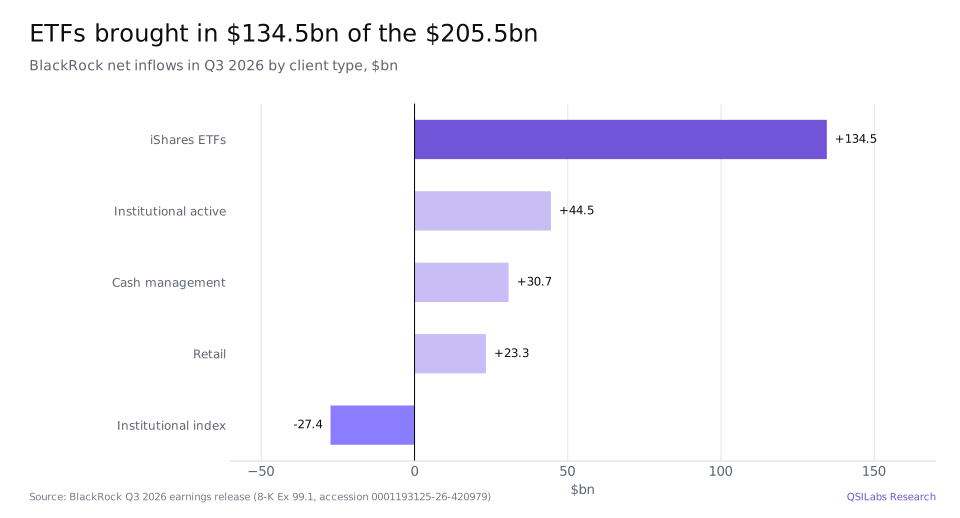
- $205.5bn of net inflows. iShares ETFs brought in $134.5bn and institutional active mandates $44.5bn, while institutional index mandates lost $27.4bn. Organic base fee growth was 11% annualised, the ninth quarter in a row at or above BlackRock's 5% target.
- Assets of $15.49tn. AUM rose 15% from $13.46tn a year earlier. Private markets were only 2% of assets but 11% of base fees.
- Wider adjusted margin. The as-adjusted operating margin rose to 47.8% from 44.6%. GAAP diluted EPS rose 25% to $10.57 and as-adjusted EPS 38% to $15.93.
- Technology growing. Technology services revenue, mostly Aladdin, rose 14% to $588m, and annual contract value grew 12%.
- Cash to shareholders. BlackRock paid a $5.73 quarterly dividend, 10% more than a year earlier, bought back $550m of shares and plans at least $550m more in the fourth quarter.
- Our value: $1,350.10 a share, against a $1,167.15 close on 2 November 2026. Our sensitivity grid runs from $1,075.04 to $1,958.86, and a two-stage cross-check gives $1,310.21. Analysts' average target is $1,359.
- What to watch. Market levels, which drive most fee revenue; earn-out charges from acquisitions; whether private markets fundraising keeps pace with BlackRock's $400bn goal for 2030; and fee pressure in index products.
Key numbers from BlackRock's Q3 2026 earnings
| Metric | Q3 2026 | Q3 2025 | Change |
|---|---|---|---|
| Total revenue | $7,752m | $6,509m | +19.1% |
| Base fees and securities lending | $6,036m | $5,046m | +19.6% |
| Performance fees | $630m | $516m | +22.1% |
| Technology services revenue | $588m | $515m | +14.2% |
| GAAP operating income | $2,328m | $1,955m | +19.1% |
| GAAP operating margin | 30.0% | 30.0% | 0.0pt |
| As-adjusted operating income | $3,330m | $2,621m | +27.1% |
| As-adjusted operating margin | 47.8% | 44.6% | +3.2pt |
| Net income attributable to BlackRock | $1,659m | $1,323m | +25.4% |
| GAAP diluted EPS | $10.57 | $8.43 | +25% |
| As-adjusted diluted EPS | $15.93 | $11.55 | +38% |
| Net inflows | $205.5bn | n/a | n/a |
| AUM at period end | $15.49tn | $13.46tn | +15.0% |
As-adjusted figures are BlackRock's non-GAAP measures; they exclude items such as the change in the fair value of contingent consideration and amortization of acquired intangible assets. Diluted share counts include Subco Units issued for the HPS acquisition.
BlackRock Q3 2026 earnings: what happened
BlackRock reported revenue of $7,752m for the quarter to 30 September 2026, 19.1% more than the $6,509m of a year earlier and 9.4% more than in the June quarter. Most of the increase came from base fees and securities lending revenue, which rose $990m to $6,036m. Small said that reflected higher markets lifting average AUM, organic growth and higher securities lending revenue, and that the annualised fee rate was "approximately flat" on the June quarter.
Total expenses rose 19.1% to $5,424m. Compensation was $2,440m, against $2,357m a year earlier; sales, asset and account expenses, mostly distribution costs and fund expenses that rise with assets, were $1,413m; general and administration expenses rose 6% to $731m. The largest swing was a $564m charge for the change in the fair value of contingent consideration, the earn-out payments BlackRock owes for acquisitions, against $93m a year earlier. GAAP operating income rose 19.1% to $2,328m. Non-operating income was $316m, including $353m of investment gains, and tax was $724m, a GAAP rate of 29.4%. Net income attributable to BlackRock rose 25.4% to $1,659m.
Over the first nine months of 2026 revenue was $21,534m, up 25.1%, GAAP operating income was $7,603m and as-adjusted EPS was $42.37. BlackRock's revenue was $17.86bn in 2023, $20.41bn in 2024 and $24.22bn in 2025, and consensus expects $29.51bn in 2026.
- 31 Dec 20252025 ends with revenue of $24.22bn, up 18.7%, and AUM of $14.04tn; BLK closes at $1,070.34Form 10-K; Q4 2025 release; Yahoo Finance
- 15 Jan 2026Q4 2025 results: revenue $7.01bn, as-adjusted operating margin 45.0%Q4 2025 release
- 12 Mar 2026BLK closes at $922.90, its 52-week closing lowYahoo Finance
- 30 Jun 2026Q2 2026 ends: revenue $7.08bn, AUM $15.34tnForm 10-Q; 8-K Ex 99.1
- 13 Aug 2026BLK closes at $1,182.84, its 52-week closing highYahoo Finance
- 30 Sep 2026Q3 2026 ends: revenue $7,752m, up 19%; net inflows $205.5bn; AUM $15.49tn8-K Ex 99.1
- 14 Oct 2026Results and call; BLK closes at $1,073.79, then rises 4.4% to $1,120.78 the next day8-K; call; Yahoo Finance
- 2 Nov 2026BLK closes at $1,167.15, the price used in our valuationYahoo Finance
- Q4 2026At least $550m of share repurchases planned; 25% as-adjusted tax rate expectedEarnings call
- 2030BlackRock aims for more than $35bn of revenue and $400bn of private markets fundraising, assuming flat markets2025 Annual Report
Which BlackRock businesses grew fastest?
Performance fees grew fastest, by 22% to $630m, including $110m from HPS, the private credit manager BlackRock bought in 2025. Base fees and securities lending revenue rose 19.6%: advisory and administration fees were $5,783m and securities lending $253m. Distribution fees rose 16.6% to $414m, and technology services revenue rose 14.2% to $588m. Advisory and other revenue was $84m.
By client type, iShares ETFs earned $2,762m of base fees, retail $1,396m, institutional active $1,231m, institutional index $293m and cash management $354m. Investment performance supports the active business: 92% of systematic equity assets were above their benchmark or peer median over one year and 95% over five years, and 85% of taxable fixed income assets over three years.
Where did BlackRock's $205bn of net inflows go?
Net inflows were $205.5bn, of which $174.8bn went into long-term funds and $30.7bn into cash management. iShares ETFs took $134.5bn. On the call BlackRock said index bond ETFs and its precision ETFs raised $61bn and $41bn and active ETFs $22bn; iShares active ETF assets have passed $160bn. Institutional active mandates added $44.5bn and retail $23.3bn, while institutional index mandates lost $27.4bn, mostly in low-fee index equity.
By asset class, fixed income took $78.2bn, equity $52.4bn, private markets $15.3bn, liquid alternatives $8.9bn, digital assets $7.9bn and multi-asset $5.1bn. By region, $125bn of long-term inflows came from the Americas, $31bn from Europe, the Middle East and Africa and $19bn from Asia-Pacific; BlackRock said about a third came from clients outside the US. Inflows over the past 12 months were $869bn, and organic base fee growth was 10%. Small said "BlackRock can sustainably deliver in that 6%-8% range", with higher growth in periods of strong client activity.
AUM rose by only $143.6bn in the quarter to $15.49tn because markets took $60.1bn off long-term and cash assets, mostly in fixed income. The industry is large and still growing: Boston Consulting Group puts global AuM at $147tn in 2025, up 11%.
How profitable is BlackRock?
On BlackRock's as-adjusted measure, operating margin was 47.8% in the third quarter, up 3.2 points on a year earlier and from 45.9% in the June quarter. Excluding performance fees and related pay, Small put the margin at 48.6%. BlackRock's through-the-cycle target is 45% or more.
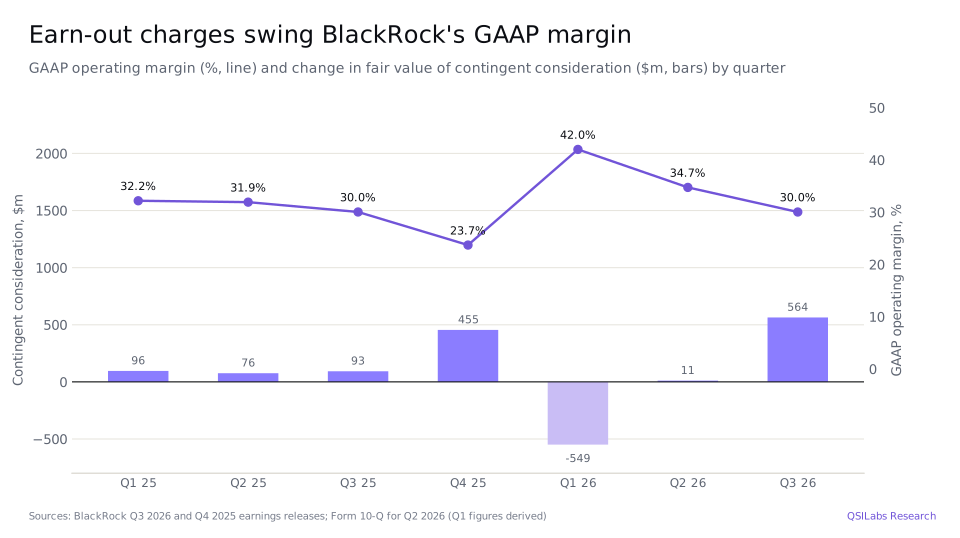
The GAAP margin moves much more. It was 30.0% in the third quarter, unchanged on a year earlier, and 34.7% in the June quarter. Changes in the fair value of contingent consideration were a $455m charge in Q4 2025, a $549m gain in Q1 2026 and a $564m charge in Q3 2026. Before that charge, third-quarter operating income was $2,892m, a margin of 37.3%, the level our model starts from. Amortization of acquired intangible assets was a further $276m, and the 10-K expects it to fall from $1,104m in 2026 to $809m in 2030.
Tax is steady. The GAAP rate was 24.0% over nine months, though 29.4% in the third quarter; the as-adjusted rate was 24.2%, and Small said 25% is "a reasonable projected tax run rate" for the fourth quarter. BlackRock expects a mid-single-digit percentage increase in full-year G&A expense.
What is BlackRock doing in private markets and technology?
Private markets had AUM of $336.0bn at 30 September and earned $668m of base fees in the quarter, 11% of the total. The supplement shows $68bn of gross fundraising and $88bn of deployment over the past 12 months, with $139bn of committed capital still to invest. BlackRock said it raised $25bn in private credit in its first full year with HPS, partnered with Meta on the financing of a planned $14bn data centre in Texas, and that its AI Infrastructure Partnership closed its first deal, Aligned Data Centers, at an enterprise value of about $40bn.
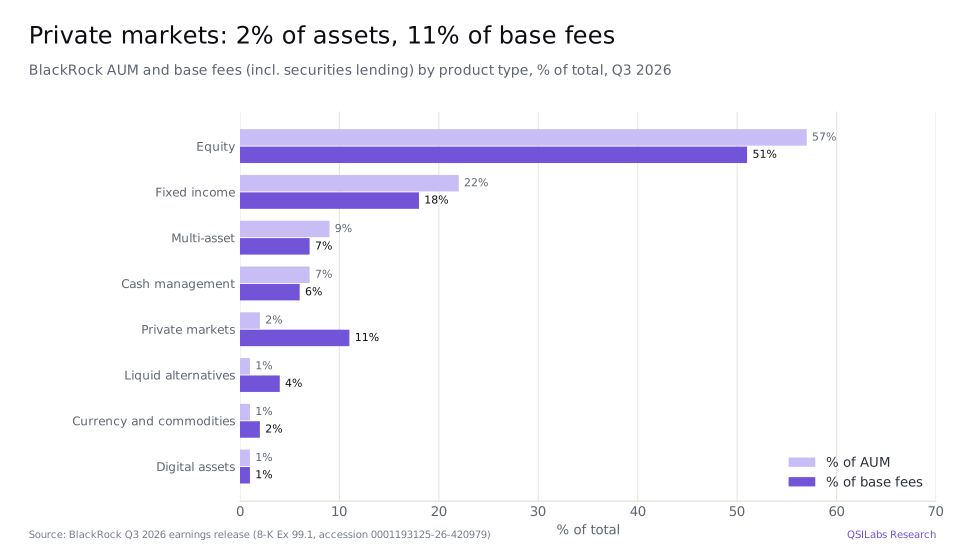
Chief executive Larry Fink said: "For the first time in my career, and that's 50 years of a career, I'm seeing genuine shortages of capital", as governments run large deficits and private demand for capital rises. Boston Consulting Group forecasts 12% annual growth in private market AuM up to 2030. BlackRock's goal is $400bn of private markets gross fundraising by 2030.
Technology services revenue rose 14% to $588m, and annual contract value, the recurring subscription value of contracts, grew 12%, inside BlackRock's low- to mid-teens target. Most of it comes from Aladdin, BlackRock's investment management and risk platform used by other institutions.
How does BlackRock return cash to shareholders?
BlackRock paid a dividend of $5.73 a share in the third quarter, against $5.21 a year earlier, or $22.92 a year, a yield of about 1.96% at $1,167.15. It bought back $550m of shares in the quarter and said it expects to repurchase at least $550m in the fourth quarter. Over nine months it declared $17.19 a share of dividends. BlackRock says it returned a record $5bn to shareholders in 2025. Shares outstanding including Subco Units fell to 162.2m from 163.2m a year earlier.
How has BLK stock performed?
BlackRock closed at $1,167.15 on 2 November 2026, 9.0% above its $1,070.34 close at the end of 2025 and close to its 52-week closing high of $1,182.84 on 13 August 2026. Its 52-week closing low was $922.90 on 12 March 2026. On results day, 14 October, the shares rose 0.7% to $1,073.79, and the next day they rose 4.4% to $1,120.78.
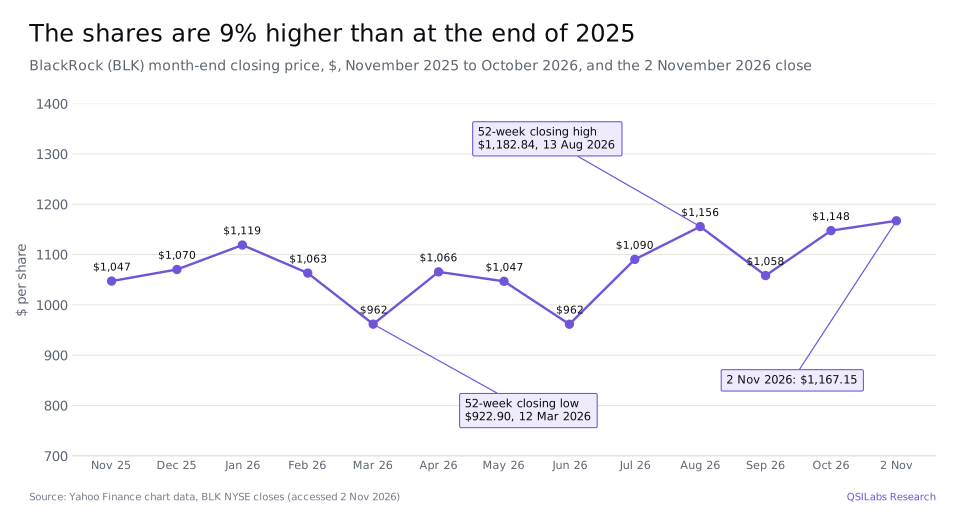
At $1,167.15 the market value is about $189.3bn on 162.2m shares including Subco Units. The shares trade at 20.2 times consensus 2026 EPS of $57.85 and 18.0 times 2027 EPS of $64.82.
BlackRock stock Q3 2026: is BLK undervalued?
On our model, modestly. Our base case is $1,350.10 a share, 15.7% above the $1,167.15 close; put the other way, the price is 13.6% below our value. That is close to the analysts' median target of $1,350 and their average of $1,359.
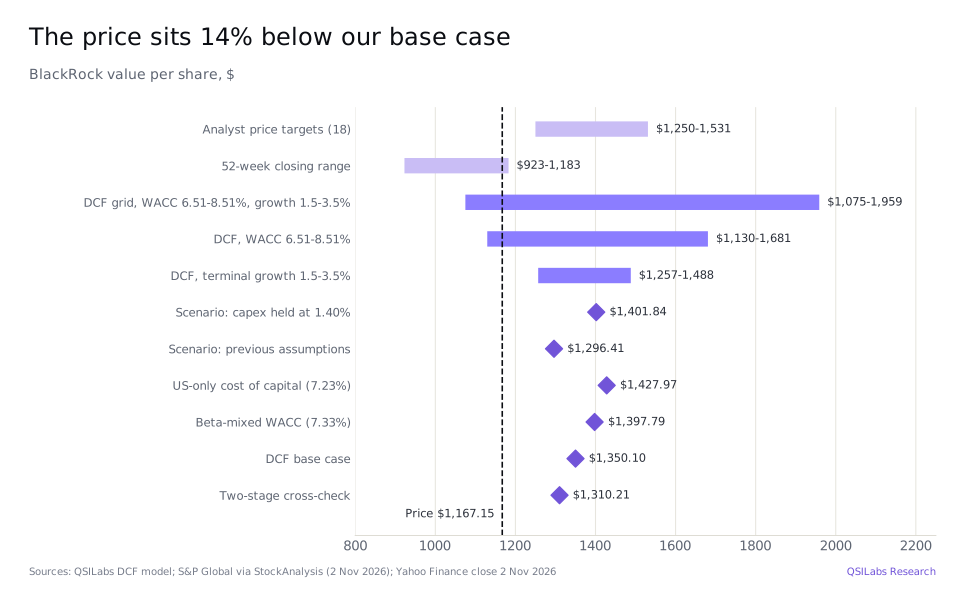
The 18 analysts tracked by S&P Global have price targets from $1,250 to $1,531. In October 12 rated BlackRock a Strong Buy, 5 a Buy and 1 a Hold. Recent targets include $1,531 from Morgan Stanley, $1,449 from Goldman Sachs, $1,405 from TD Cowen and $1,350 from BMO.
Most of the gap between our value and the price comes from the cost of capital. At our 7.51% WACC and 2.5% terminal growth the value is $1,350.10; the price matches a WACC between 8.0% and 8.5%.
Method
We forecast revenue and operating margin year by year to 2035, apply a 24.0% tax rate, BlackRock's GAAP effective rate for the first nine months of 2026, and deduct capital spending and working capital to reach unlevered free cash flow. We discount those cash flows at a 7.51% weighted average cost of capital. The cost of equity is 7.70%: a 5.12% risk-free rate plus a beta of 0.54 times an equity risk premium of 4.75%. The beta is Damodaran's global unlevered beta of 0.516 for investment and asset management companies, relevered at BlackRock's debt-to-equity ratio of 6.7%. The equity risk premium is weighted by where BlackRock made its 2025 revenue: 65.9% in the Americas, 29.6% in Europe and 4.5% in Asia-Pacific. Debt is 6.3% of capital at an after-tax cost of 4.68%. After 2035 we assume growth of 2.5% a year; that terminal value is 63.3% of our enterprise value of $222.9bn.
To reach equity value of $222.1bn we add cash of $10.16bn outside consolidated funds, $6.95bn of corporate investments, $1.37bn of net carried interest and about $3.50bn of cash generated between 30 June and 2 November, and deduct $12.84bn of notes, the $8.44bn contingent consideration liability, the $0.93bn of third-quarter dividends and $0.55bn of buybacks. Divided by 164.5m diluted shares, that gives $1,350.10.
For 2026 and 2027 we use S&P Global consensus revenue of $29.51bn, up 21.9%, and $32.79bn, up 11.1%. For 2028 we apply consensus three-year revenue growth of 14.42% a year from 2025, which gives $36.28bn. Growth then slows evenly to 5.1% in 2032, the industry's annual revenue growth from 2010 to 2025 measured by Boston Consulting Group, and to 2.5% in 2035, when revenue is $52.8bn. Our 2030 revenue of $42.7bn is above BlackRock's own goal of more than $35bn because that goal assumes flat markets.
The operating margin is BlackRock's GAAP margin before contingent consideration. We hold it at the third-quarter level of 37.3% and hold EBITDA at 42.6% of revenue, so the margin rises from 37.9% in 2027 to 40.0% by 2035 as amortization of acquired intangibles rolls off. Capital spending is 1.40% of revenue in 2026 and 2027, BlackRock's average in 2024 and 2025, and then rises to 7.58% by 2035, the reinvestment our method requires for 2.5% growth after 2035 at a 15% return on new capital. That is far above BlackRock's actual spending and is one reason our value is conservative.
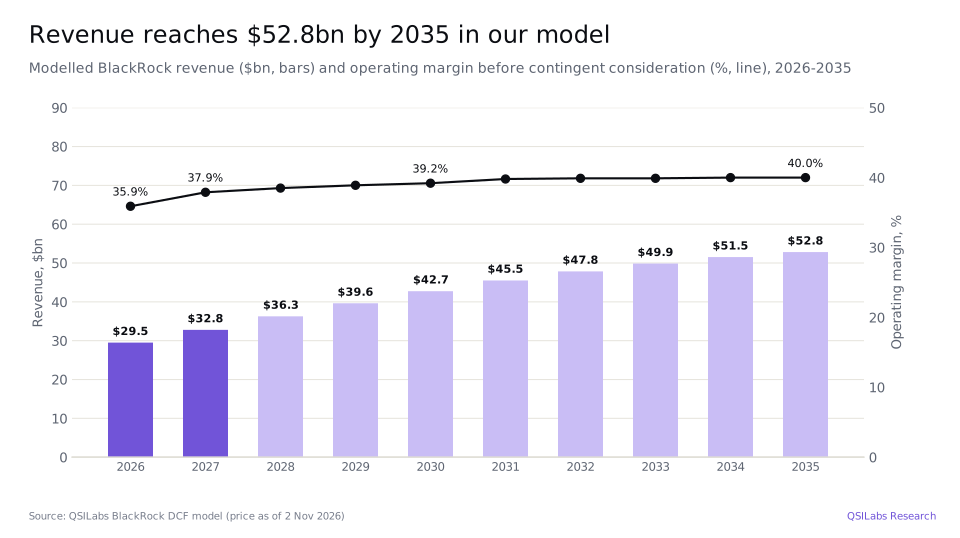
We forecast unlevered free cash flow of $9.01bn in 2026, $10.40bn in 2027 and $11.18bn in 2028, rising to $12.48bn in 2030 and $13.38bn in 2035. Our previous model, priced at the $1,128.68 close on 20 October and using a US equity risk premium, gave $1,364.93. It used product growth rates without sources, such as iShares growth slowing from 11% in 2027 to 4.5% in 2035, a flat 37.5% margin and capital spending of $450m and $480m. We have replaced those assumptions with the sourced paths above and weighted the equity risk premium by region.
How the number moves if you argue with us
The table shows our value per share at different costs of capital and terminal growth rates. At an 8.51% cost of capital and 2.5% terminal growth, the value is $1,129.71, below the share price.
| Cost of capital | Growth 1.5% | Growth 2.0% | Growth 2.5% | Growth 3.0% | Growth 3.5% |
|---|---|---|---|---|---|
| 6.51% | $1,512.36 | $1,587.43 | $1,680.79 | $1,800.26 | $1,958.86 |
| 7.01% | $1,372.91 | $1,428.96 | $1,497.07 | $1,581.73 | $1,690.04 |
| 7.51% | $1,256.90 | $1,299.42 | $1,350.10 | $1,411.66 | $1,488.16 |
| 8.01% | $1,158.90 | $1,191.57 | $1,229.88 | $1,275.52 | $1,330.93 |
| 8.51% | $1,075.04 | $1,100.39 | $1,129.71 | $1,164.07 | $1,204.98 |
We also ran four scenarios through the model. Holding capital spending at 1.40% of revenue every year, rather than rising to 7.58%, gives $1,401.84. Our previous assumptions, with today's price, balance sheet and cost of capital, give $1,296.41. A cost of capital built only from US data, 7.23%, gives $1,427.97, and one built from separate betas for each region, 7.33%, gives $1,397.79. A two-stage version of the terminal value gives $1,310.21.
Risks to the BlackRock investment case
- Markets. Most revenue is a percentage of assets, so falling markets cut fees quickly. Boston Consulting Group found that more than 80% of the industry's revenue growth in 2025 came from rising markets, and BlackRock's 2030 goals assume flat markets.
- Fees. Boston Consulting Group says institutional fees have fallen 3% a year and that industry costs grew faster than revenue from 2010 to 2025. Institutional index mandates lost $27.4bn in the quarter.
- Earn-outs. Contingent consideration cost $564m in the quarter and the liability was $8.44bn at 30 June; it can swing GAAP profit by hundreds of millions of dollars a quarter.
- Private credit and AI financing. Growth increasingly depends on private credit and infrastructure deals such as Aligned Data Centers. President Rob Kapito said: "We are expecting more volatility until we can find a balance that right now suggests slightly higher rates, especially in the longer end of the curve."
- Cost of capital. Our beta of 0.54 comes from the global asset management industry; StockAnalysis puts BlackRock's own five-year beta at 1.42. At that beta the cost of equity would be about 11.9%, and the value would be below the lowest figure in our grid, $1,075.04.
- Upside risks. Active ETFs, systematic equity, which BlackRock said is approaching $500bn of assets, and mandates such as the $80bn Dutch construction-industry pension fund, which named BlackRock its preferred candidate, could keep organic growth above the 6%-8% range.
FAQ
What value does QSILabs put on BlackRock stock?
$1,350.10 a share in our base case, from a discounted cash flow model priced on 2 November 2026, when the shares closed at $1,167.15. Our sensitivity grid ranges from $1,075.04 to $1,958.86, and a two-stage cross-check gives $1,310.21. Our previous model, priced on 20 October, gave $1,364.93.
Is BlackRock stock a buy after its Q3 2026 results?
The results were strong: revenue up 19%, as-adjusted EPS up 38% and $205.5bn of net inflows. On our model the shares trade about 14% below our value, close to where analysts' median target sits, but the result depends heavily on the cost of capital. 17 of 18 analysts rate it a Buy or Strong Buy. This is not investment advice.
How much revenue did BlackRock make in Q3 2026?
$7,752m in the quarter to 30 September 2026, up 19.1% from $6,509m a year earlier. Base fees and securities lending provided $6,036m, performance fees $630m and technology services $588m. Consensus expects $29.51bn for the full year.
How much money does BlackRock manage?
$15.49tn at 30 September 2026, up 15% from $13.46tn a year earlier. Equity was $8.98tn, fixed income $3.35tn, multi-asset $1.34tn, cash management $1.10tn and private markets $336bn.
What does BlackRock do?
BlackRock manages money for pension funds, insurers, governments, financial advisers and individuals through iShares ETFs, mutual funds, separate accounts and private markets funds. It also sells technology, mainly the Aladdin investment and risk platform, to other financial institutions.
What dividend does BlackRock pay?
$5.73 a share each quarter, or $22.92 a year, a yield of about 1.96% at $1,167.15. The quarterly dividend was $5.21 a year earlier. BlackRock also bought back $550m of shares in the September quarter.
What price target do analysts have for BLK?
The 18 analysts tracked by S&P Global have an average price target of $1,359, a median of $1,350, a low of $1,250 and a high of $1,531, according to StockAnalysis on 2 November 2026.
What is Aladdin and how fast is it growing?
Aladdin is BlackRock's investment management and risk platform, which it licenses to other institutions. Technology services revenue, mostly Aladdin, rose 14% to $588m in the third quarter, and annual contract value grew 12%.
Why did BlackRock's GAAP margin stay at 30%?
A $564m charge for the change in the fair value of contingent consideration, the earn-outs owed for acquisitions, offset higher fees. Before that charge the margin was 37.3%, and BlackRock's as-adjusted margin was 47.8%.
What are BlackRock's 2030 targets?
In its 2025 Annual Report BlackRock aims for more than $35bn of revenue by 2030, nearly double its 2024 adjusted operating income, organic base fee growth of 5% or more, an adjusted operating margin of 45% or more and $400bn of private markets fundraising, all assuming flat markets.
Sources
- BlackRock, Inc., third quarter 2026 earnings release (Form 8-K, Exhibit 99.1, 14 Oct 2026; accession 0001193125-26-420979) www.sec.gov
- BlackRock, Inc., third quarter 2026 supplemental information (Form 8-K, Exhibit 99.2, 14 Oct 2026) www.sec.gov
- BlackRock, Inc., fourth quarter 2025 earnings release (Form 8-K, Exhibit 99.1, 15 Jan 2026; accession 0001193125-26-013503) www.sec.gov
- BlackRock, Inc., Form 10-Q for the quarter ended 30 Jun 2026 (accession 0001193125-26-337177) www.sec.gov
- BlackRock, Inc., Form 10-K for 2025 (accession 0001193125-26-071966): revenue by region, intangible amortization schedule and capital spending www.sec.gov
- BlackRock, Inc., 2025 Annual Report (SEC filing, accession 0001308179-26-000264): 2030 targets www.sec.gov
- BlackRock Q3 2026 earnings call transcript, 14 Oct 2026, via The Motley Fool (accessed 2 Nov 2026) www.fool.com
- StockAnalysis: BlackRock forecast and analyst ratings, S&P Global data (accessed 2 Nov 2026) stockanalysis.com
- StockAnalysis: BlackRock statistics (accessed 2 Nov 2026) stockanalysis.com
- Boston Consulting Group, Global Asset Management Report 2026: An Imperative for Growth www.bcg.com
- Boston Consulting Group, press release on private markets in wealth management, 31 Mar 2025 www.bcg.com
- Yahoo Finance chart data: BLK closing prices and dividends (November 2025 to November 2026) query1.finance.yahoo.com
- Damodaran Online: global industry betas and country equity risk premiums, January 2026 pages.stern.nyu.edu
- QSILabs BlackRock discounted cash flow model (internal; price as of 2 Nov 2026)
Disclaimer
This article is for information only and is not investment advice, a recommendation or an offer to buy or sell any security. QSI Labs and its authors may hold positions in the securities discussed. Forecasts and valuations are estimates that depend on assumptions that may prove wrong. Figures are taken from company filings and third-party sources believed to be reliable, but we do not guarantee their accuracy. Do your own research or consult a licensed adviser before investing.
More from QSI Labs
Related analysis: Morgan Stanley stock Q3 2026: wealth and equities, Goldman Sachs stock Q3 2026: advisory and equities, JPMorgan stock Q3 2026: NII and buybacks and Citigroup stock Q3 2026: services and RoTCE.
Read our white paper, QSI Labs: An AI-Native Trading Firm Built on a Training Loop (October 2026), available on request, or browse the research index.