Research / Earnings and valuation
KLA Stock Q3 2026:Revenue Up 29% as AI Lifts Process Control
As of: Figures are as of KLA Corporation's results for the quarter ended 30 September 2026, its first quarter of fiscal 2027, reported 28 October 2026 in a Form 8-K, and its Form 10-Q for that quarter, filed 29 October 2026. KLA's fiscal year ends in June, so the July to September 2026 quarter, calendar Q3 2026, is its Q1 FY2027. The share price used in our valuation is the Nasdaq close of KLAC on 2 November 2026, $153.11; analyst data were accessed on 2 November 2026. Published 2 November 2026.
The short answer. KLA stock Q3 2026 comes down to a quarter in which demand for chip inspection and measurement tools ran ahead of what KLA could ship. Revenue for the three months to 30 September 2026, KLA's first quarter of fiscal 2027, rose 28.9% to $4.14bn, which chief executive Rick Wallace called "another record". GAAP operating margin reached 45.0%, GAAP diluted EPS rose 38.8% to $1.18 and free cash flow rose 25.4% to $1.34bn. KLA guided December-quarter revenue to $4.7bn, plus or minus $0.2bn, and said it expects the wafer equipment market to exceed $200bn in calendar 2027. Our discounted cash flow model values KLA at $85.55 a share, about 44% below the $153.11 close on 2 November 2026. The share price assumes faster growth for longer, or a lower cost of capital, than our model, which follows consensus to fiscal 2029 and KLA's own 2030 targets.
Key takeaways
- Revenue up 28.9%. Q1 FY2027 revenue was $4,136m, against $3,210m a year earlier and $3,658m in the June quarter. Product revenue rose 33.3% to $3,286m and services rose 14.2% to $851m.
- Inspection led. Wafer Inspection revenue rose 37.3% to $2,111m, 51% of the total, and Patterning rose 29.2% to $863m. KLA expects advanced packaging process control revenue of at least $1.1bn in calendar 2026, up more than 70%.
- China's share fell. China was 34.5% of revenue, against 39.5% a year earlier, although sales there still rose 12.5% to $1,426m. North America more than doubled to $618m and Korea rose 66.1% to $497m.
- Margins rose. GAAP gross margin was 61.9% and GAAP operating margin 45.0%, against 41.7% a year earlier. On KLA's non-GAAP measure operating margin was 46.1%, which Wallace said was above 46% "for the first time ever".
- Guidance points higher. KLA guided December-quarter revenue to $4.7bn, 42.5% above a year earlier, and GAAP EPS to $1.41, plus or minus $0.11. Chief financial officer Bren Higgins said "I am still behind in supply".
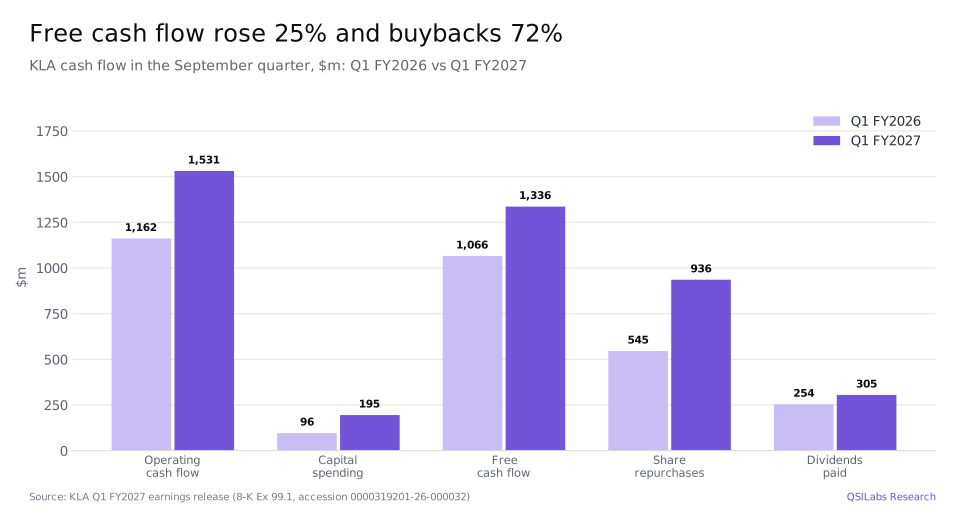
- Cash returned. KLA bought back $936m of shares and paid $305m of dividends in the quarter, 93% of its $1,336m of free cash flow. The dividend is $0.23 a share a quarter.
- Our value: $85.55 a share, against a $153.11 close on 2 November 2026. A two-stage cross-check gives $87.67, and the highest value in our sensitivity grid is $100.96. Analysts' average target is $217.58.
- What to watch. Lead times of about 12 months, the cost of memory chips used in KLA's tools, the China share of revenue, which KLA expects at 27% to 29% in the December quarter, and whether the wafer equipment market passes $200bn in 2027.
Key numbers from KLA's Q3 2026 earnings
| Metric | Q1 FY2027 (Sep 2026) | Q1 FY2026 (Sep 2025) | Change |
|---|---|---|---|
| Revenue | $4,136.0m | $3,209.7m | +28.9% |
| Product revenue | $3,285.5m | $2,465.0m | +33.3% |
| Service revenue | $850.5m | $744.7m | +14.2% |
| GAAP gross margin | 61.9% | 61.3% | +0.6pt |
| GAAP operating income | $1,861.6m | $1,337.1m | +39.2% |
| GAAP operating margin | 45.0% | 41.7% | +3.3pt |
| Net income | $1,548.6m | $1,121.0m | +38.1% |
| GAAP diluted EPS | $1.18 | $0.85 | +38.8% |
| Non-GAAP diluted EPS | $1.22 | $0.88 | +38.6% |
| Cash flow from operations | $1,530.9m | $1,161.6m | +31.8% |
| Free cash flow | $1,336.2m | $1,065.7m | +25.4% |
| Share repurchases | $935.8m | $545.1m | +71.7% |
GAAP operating income here is revenue less costs of revenues, research and development (R&D) and selling, general and administrative (SG&A) expenses, as reported in the 10-Q. Per-share figures reflect KLA's ten-for-one stock split of 11 June 2026.
KLA Q3 2026 earnings: what happened
KLA reported revenue of $4,136.0m for the quarter to 30 September 2026, 28.9% more than the $3,209.7m of a year earlier and 13.1% more than the $3,657.6m of the June quarter. KLA's fiscal year ends in June, so this calendar third quarter is its first quarter of fiscal 2027. Wallace opened the call by saying "Revenue was another record at $4.14 billion".
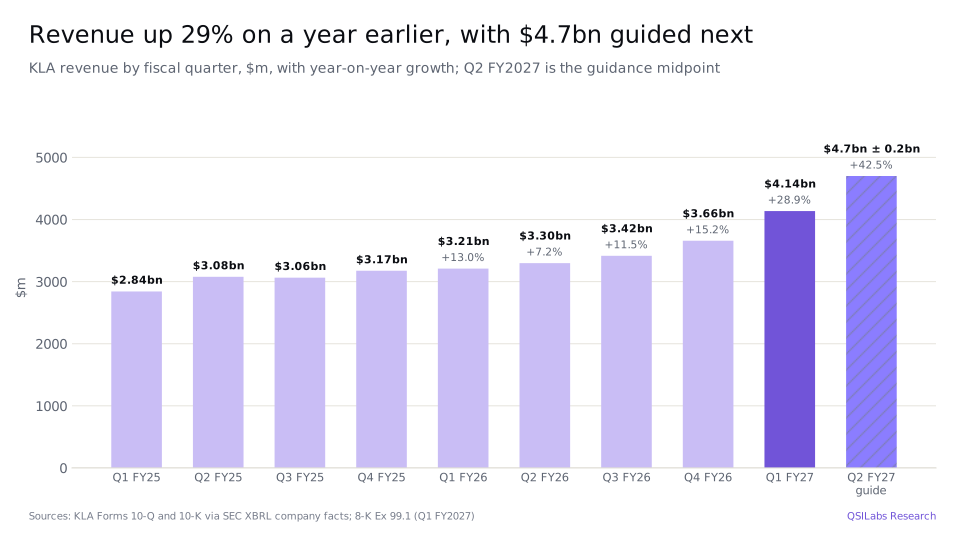
KLA sells the tools chipmakers use to find defects and measure patterns on wafers, masks and packages, which it calls process control, and that business made up almost all of the growth. The Semiconductor Process Control segment had revenue of $3,754.3m, up 29.5%, and a segment profit of $1,796.1m, up 37.4%. The Specialty Semiconductor Process segment, which sells etch and deposition tools for specialty chips, grew 16.5% to $139.5m, and the PCB and Component Inspection segment, which serves printed circuit board and display makers, grew 27.8% to $242.2m.
Costs grew more slowly than revenue. Costs of revenues rose 26.9% to $1,577.8m, R&D rose 9.6% to $395.1m and SG&A rose 12.1% to $301.5m. GAAP operating income rose 39.2% to $1,861.6m. Tax was $275.5m on pre-tax income of $1,824.1m, an effective rate of 15.1%, against 14.4% a year earlier, and net income rose 38.1% to $1,548.6m. GAAP diluted EPS rose 38.8% to $1.18, helped by a 1.0% fall in the diluted share count to 1,311.1m, and non-GAAP EPS, which excludes acquisition-related charges of $43.0m among other items, was $1.22.
- 21 Nov 2025KLAC closes at $109.71 (split-adjusted), its 52-week closing lowYahoo Finance
- 12 Mar 2026Investor Day: KLA sets a 2030 target model of $26bn revenue, plus or minus $2.5bn, and a 45% to 47% non-GAAP operating margin2030 target model; Investor Day transcript
- 11 Jun 2026Ten-for-one stock split takes effectForm 10-Q
- 30 Jun 2026Fiscal 2026 ends with revenue of $13.58bn; KLAC closes at $301.71, its 52-week closing highSEC XBRL; Yahoo Finance
- 14 Jul 2026SEMI forecasts wafer fab equipment spending of $143.9bn in 2026, up 23.1%, and growth of 21.8% in 2027SEMI
- 30 Sep 2026Q1 FY2027 ends: revenue $4,136m, up 28.9%; GAAP operating margin 45.0%8-K Ex 99.1
- 28 Oct 2026Results and call: December-quarter guidance of $4.7bn; KLA expects the wafer equipment market to exceed $200bn in 2027; KLAC closes at $158.778-K; call; Yahoo
- 29 Oct 2026Form 10-Q filed; KLAC closes at $167.43Form 10-Q; Yahoo Finance
- 2 Nov 2026KLAC closes at $153.11, the price used in our valuationYahoo Finance
- Mid to late 2027KLA expects its gross margin to move back into its 63% to 64% target rangeQ1 FY2027 call
- 2030Target model year: revenue of $26bn, plus or minus $2.5bn2030 target model
Two customers accounted for 21% and 13% of revenue in the quarter, according to the 10-Q. KLA does not name them in the filing.
Which KLA products grew fastest?
Wafer Inspection, the tools that scan wafers for defects, was the largest and one of the fastest-growing lines, with revenue up 37.3% to $2,111.2m, 51% of the total. Patterning, which covers reticle inspection and the metrology tools that measure the size and alignment of chip features, rose 29.2% to $862.5m. PCB and Component Inspection grew 42.8% to $167.5m, Specialty Semiconductor Process 13.3% to $113.6m and Services 14.2% to $850.5m. Other revenue fell 28.3% to $30.7m.
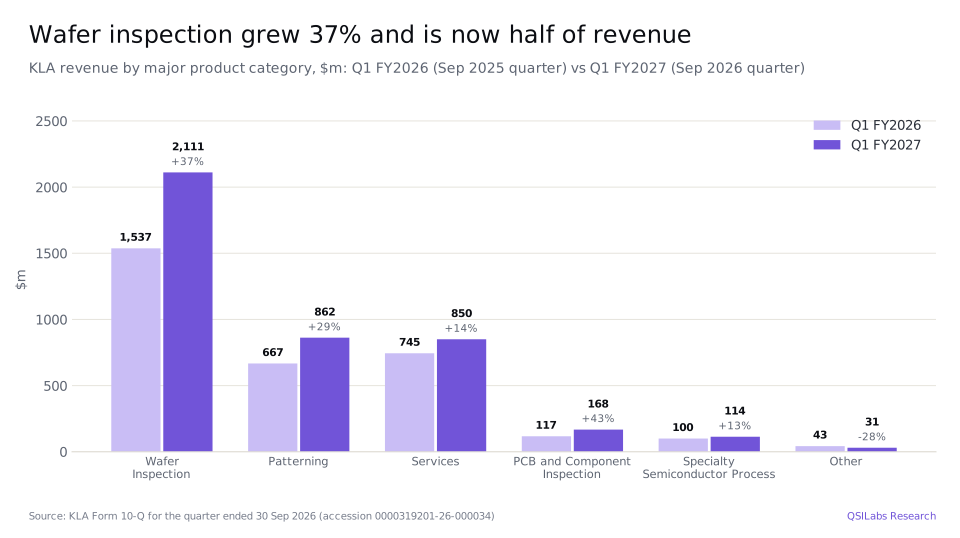
KLA linked the growth to investment in artificial intelligence infrastructure and to rising process control intensity at advanced chip nodes, and Wallace said DRAM is approaching the inspection intensity of leading-edge logic because high-performance computing chips need higher yields. KLA expects advanced packaging process control revenue of at least $1.1bn in calendar 2026, growth of more than 70%, which Wallace said is nearly twice the growth rate of the advanced packaging market. Services revenue of $850m grew 14%, and KLA's 2030 target model assumes services grow 13% to 15% a year.
Where does KLA's revenue come from?
KLA reports revenue by the location its tools are shipped to. China, KLA's largest market, provided $1,425.7m, up 12.5% from $1,267.2m a year earlier and 49.0% more than the $956.7m of the June quarter, but its share of revenue fell to 34.5% from 39.5%. KLA said on the call it expects China to be 27% to 29% of revenue in the December quarter.
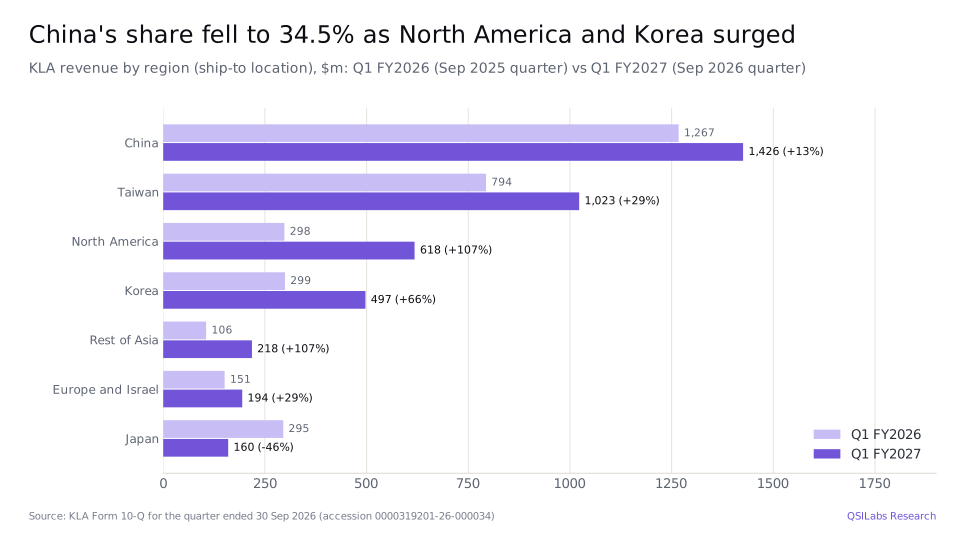
The fastest growth came elsewhere. North America rose 107.5% to $618.0m and the rest of Asia 106.8% to $218.2m, while Korea, where the large memory makers are based, rose 66.1% to $497.2m. Taiwan, home to the largest contract chipmaker, rose 28.9% to $1,022.7m, and Europe and Israel 28.7% to $194.3m. Japan was the only region to shrink, falling 45.9% to $159.8m.
The split between kinds of customer is shifting toward memory. For the December quarter, KLA expects foundry and logic customers to account for about 60% of semiconductor process control system revenue and memory about 40%, with DRAM 84% of the memory share and NAND 16%.
How profitable is KLA?
KLA is one of the most profitable equipment makers. Its GAAP gross margin was 61.9% in the September quarter, against 61.3% a year earlier and 61.4% in the June quarter, and on KLA's non-GAAP measure it was 62.7%. Operating expenses grew far more slowly than revenue, so GAAP operating margin rose to 45.0%, from 41.7% a year earlier and 42.5% in the June quarter. Non-GAAP operating margin was 46.1%, 240 basis points higher than in the June quarter.
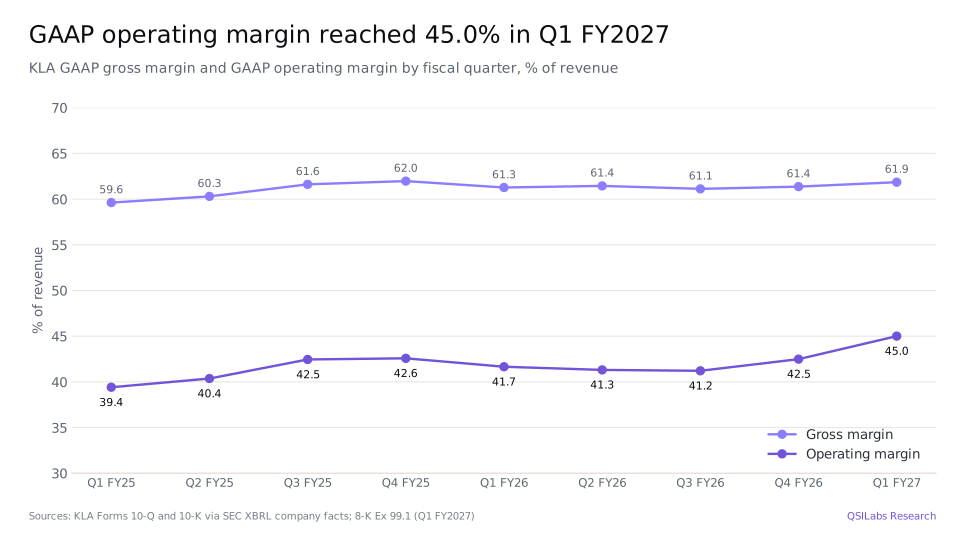
Higgins said KLA plans for 40% to 50% of each extra dollar of revenue to become operating profit, its incremental margin framework,. The gross margin is held back by what Higgins called "persistently high memory costs", since KLA's tools contain memory chips whose prices have risen with AI demand. KLA's target gross margin is 63% to 64%, and Higgins expects to return to that range in the middle to the end of calendar 2027 and into 2028.
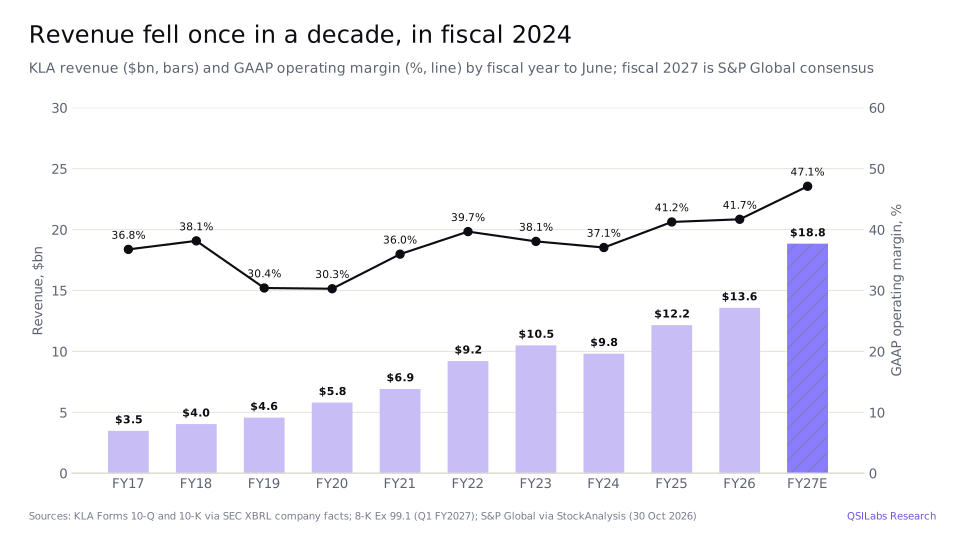
Over a longer period KLA has been steadily profitable through a cyclical industry. Its GAAP operating margin has been between 30.3% and 41.7% in each of the past ten fiscal years, and revenue fell in only one of them, fiscal 2024, when it dropped 6.5% to $9.81bn. The S&P Global consensus for fiscal 2027 is revenue of $18.83bn, up 38.7%, and operating income of $8.87bn, a 47.1% margin.
What is KLA guiding for the December quarter and 2027?
KLA guided revenue of $4.7bn, plus or minus $0.2bn, for the quarter to December 2026, which would be 42.5% above the $3,297.1m of a year earlier and 13.6% above the September quarter. It guided GAAP gross margin to 61.8%, plus or minus one point, and non-GAAP gross margin to 62.5%, GAAP diluted EPS to $1.41, plus or minus $0.11, and non-GAAP EPS to $1.44, on about 1,306m diluted shares.
For the industry, KLA expects wafer fab equipment spending of approximately the mid-$150bn range in calendar 2026, and Wallace said: "We currently expect the wafer equipment market to exceed $200 billion in calendar 2027." That is above the trade group SEMI's mid-year forecast, published 14 July 2026, of $143.9bn of wafer fab equipment in 2026, up 23.1%, and growth of 21.8% in 2027 and 14.1% in 2028, which takes the market to about $200bn a year later than KLA expects. Wallace described sales funnel visibility as "unprecedented".
The limit is supply rather than demand. Higgins said lead times are about 12 months, with optical components the bottleneck, and that he expects sequential revenue growth "for the next several quarters". KLA expects the second half of calendar 2026 to be about 25% above the first half. Capital spending will be $600m to $800m a year, or 2% to 3% of revenue, Higgins said; a large part of the September-quarter spending was a land purchase for a new campus in India. The planning tax rate is 14.5%.
At the Investor Day on 12 March 2026, before it raised its view of the 2027 market, KLA set a 2030 target model of revenue of $26bn, plus or minus $2.5bn, a growth rate of about 13% to 17% a year, and a non-GAAP operating margin of 45% to 47%. The target assumes the semiconductor industry grows about 11% a year from 2025 to 2030 and wafer equipment about one point faster, to $215bn, plus or minus $20bn.
How much cash does KLA return to shareholders?
KLA generated $1,530.9m of cash from operations in the quarter, up 31.8%, spent $194.8m on capital projects, about double a year earlier, and had free cash flow of $1,336.2m, up 25.4%. In the twelve months to September 2026 free cash flow was $4,037.6m. KLA returned $3,789.4m to shareholders over those twelve months, including $1,240.9m in the latest quarter: $935.8m of share repurchases and $305.1m of dividends.
The quarterly dividend is $0.23 a share, or $0.92 a year, a yield of 0.60% at $153.11; StockAnalysis records 16 consecutive years of dividend growth. KLA ended September with cash and marketable securities of $4,741.2m and senior notes with a principal value of $5,950.0m, maturing from 2029 to 2062, so net debt was about $1.2bn. A $1.5bn revolving credit facility was undrawn. Inventories rose 12.1% in the quarter to $4,090.4m.
How has KLAC stock performed in 2026?
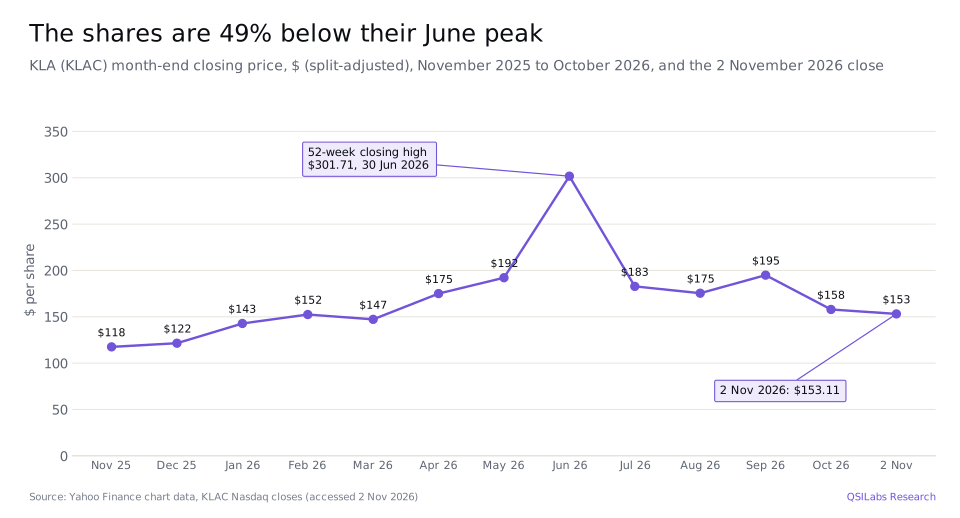
KLAC closed at $153.11 on 2 November 2026, up 26.0% from $121.51 at the end of 2025 but 49.3% below its 52-week closing high of $301.71 on 30 June 2026. Its 52-week closing low was $109.71 on 21 November 2025. On the day of the results, 28 October, the shares closed at $158.77; they rose 5.5% to $167.43 the next day and closed at $153.11 on 2 November, down 3.0% on the day. All prices are adjusted for the ten-for-one split on 11 June 2026.
At $153.11, KLA's equity was worth about $199.5bn on the 1,302.96m shares outstanding on 26 October, and its enterprise value, adding debt and deducting cash, about $200.7bn. That is 26.7 times the consensus fiscal 2027 EPS of $5.74 and 22.6 times consensus fiscal 2027 operating income of $8.87bn. StockAnalysis puts the trailing price-earnings ratio at 38.4 and the forward ratio at 24.7.
KLA stock Q3 2026: is KLAC overvalued?
On our numbers, yes. Our discounted cash flow model values KLA at $85.55 a share, about 44% below the $153.11 close on 2 November 2026; put another way, the price is 1.79 times our value. Our enterprise value of $112.6bn is 12.7 times consensus fiscal 2027 operating income, against 22.6 times for the market's enterprise value.
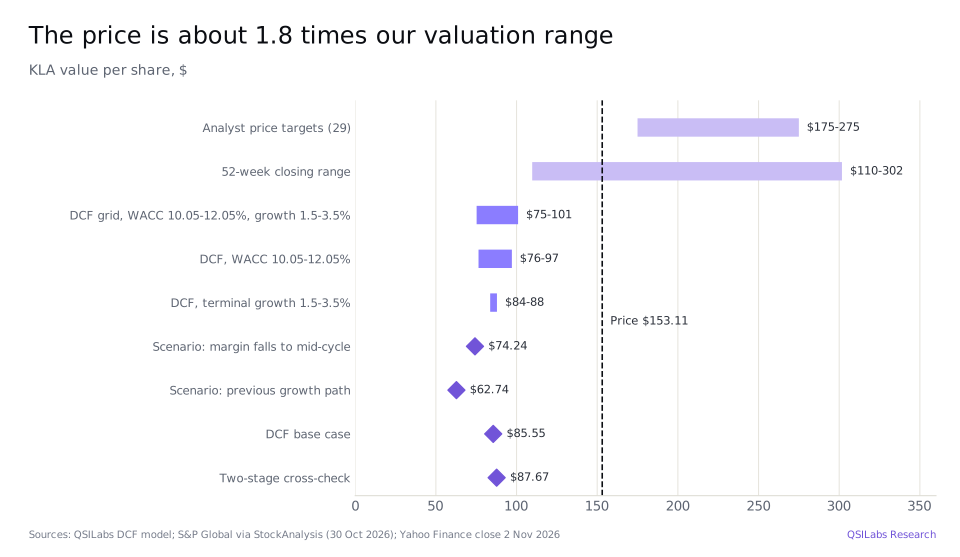
Analysts are much more positive than our model. The 29 analysts tracked by S&P Global rate KLA a Buy on average, with an average price target of $217.58, a median of $220 and a range from $175 to $275. In October 15 rated it a Strong Buy, 5 a Buy and 9 a Hold, and none rated it a Sell.
The gap comes from what happens after the current upswing. Our model grows revenue in line with consensus to fiscal 2029, to the top of KLA's 2030 target range, and then slows it by 1.5 points a year to 2.5% from fiscal 2035, with a cost of capital of 11.05%. The share price implies that KLA keeps growing quickly for longer than that, keeps margins above its own target range, or deserves a lower cost of capital. Semiconductor equipment has been cyclical, and our model includes no downturn, so a downturn would lower our value further.
Method
We forecast revenue and GAAP operating margin year by year to fiscal 2035, apply a 14.5% tax rate, KLA's planning rate, and deduct capital spending and working capital to reach unlevered free cash flow. We discount those cash flows at an 11.05% weighted average cost of capital, Damodaran's January 2026 figure for US semiconductor equipment companies: equity is 95.4% of capital at a cost of 11.35%, using an industry beta of 1.40, and debt is 4.6% at an after-tax cost of 4.85%. After fiscal 2035 we assume growth of 2.5% a year; that terminal value is 51.5% of our enterprise value of $112.6bn. Adding cash and marketable securities of $4.74bn and about $0.55bn of cash generated between 30 September and 2 November, and deducting the $5.95bn principal of KLA's senior notes, gives equity value of $112.0bn, or $85.55 a share on 1,308.7m diluted shares.
For fiscal 2027, the year to June 2027, we use the S&P Global consensus revenue of $18.83bn, up 38.7%, and GAAP operating income of $8.87bn, a 47.1% margin. The September quarter and KLA's guidance for December add up to about $8.84bn, so consensus implies about $10.0bn in the second half. For fiscal 2028 we use consensus revenue of $22.31bn, up 18.5%. Growth of 16.2% in fiscal 2029, in line with S&P Global's three-year growth forecast, and 10.0% in fiscal 2030 takes revenue to $28.5bn, the top of KLA's 2030 target range of $26bn, plus or minus $2.5bn. We use the top because KLA set that range before it raised its view of the 2027 market. Growth then slows by 1.5 points a year to 2.5% in fiscal 2035, when revenue reaches $37.2bn.
The GAAP operating margin falls from 47.1% in fiscal 2027 to 44.3% in fiscal 2030 and stays about 44.5% to 2035. Before amortisation of acquired intangible assets, which we keep at its current dollar amount, that is a margin of 45%, the low end of KLA's 2030 non-GAAP target of 45% to 47%. Capital spending is $700m in fiscal 2027 and $750m in fiscal 2028, inside the $600m to $800m range Higgins gave, and then rises to $2.86bn by 2035, 7.7% of revenue, the reinvestment our method requires for 2.5% growth after 2035 at a 15% return on new capital. That is well above KLA's guide of 2% to 3% of revenue and is one reason our value is conservative. Working capital rises by 22.6% of each year's increase in revenue, which takes $1.19bn of cash in fiscal 2027.
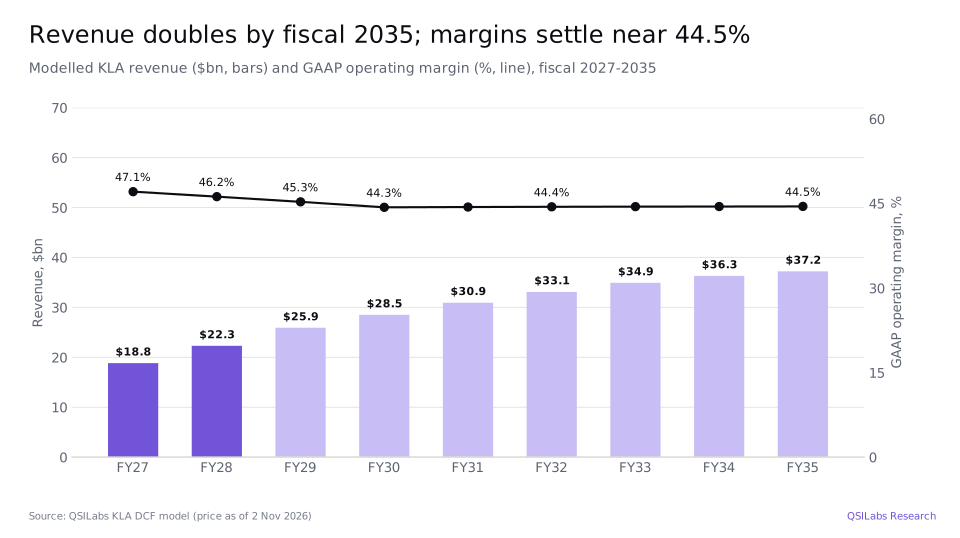
We forecast unlevered free cash flow of $6.15bn in fiscal 2027 and $7.82bn in fiscal 2028, rising to $9.62bn in fiscal 2030 and $12.03bn in fiscal 2035. Our previous model, dated 28 October and priced at $158.77, gave $54.87. It assumed revenue growth would slow from 38.7% in fiscal 2027 to 6% in fiscal 2028 and then fade to 2.5%, and that operating margin would fall back toward KLA's ten-year average. GAAP operating margin averaged 36.9% from fiscal 2017 to 2026. We have replaced those assumptions with consensus to fiscal 2029, KLA's 2030 targets and the fade described above, and we have raised the tax rate to KLA's 14.5% planning rate from 13.8%.
How the number moves if you argue with us
The table shows our value per share at different costs of capital and terminal growth rates. Even at a 10.05% cost of capital and 3.5% terminal growth, the model gives $100.96, about 34% below the share price.
| Cost of capital | Growth 1.5% | Growth 2.0% | Growth 2.5% | Growth 3.0% | Growth 3.5% |
|---|---|---|---|---|---|
| 10.05% | $94.09 | $95.52 | $97.11 | $98.91 | $100.96 |
| 10.55% | $88.58 | $89.72 | $90.97 | $92.37 | $93.94 |
| 11.05% | $83.67 | $84.56 | $85.55 | $86.64 | $87.86 |
| 11.55% | $79.25 | $79.96 | $80.74 | $81.59 | $82.53 |
| 12.05% | $75.26 | $75.83 | $76.44 | $77.10 | $77.82 |
We also ran two scenarios through the model. If GAAP operating margin falls from 47.1% in fiscal 2027 to about 37% by fiscal 2032, close to KLA's ten-year average, with the same revenue path, the value is $74.24. If revenue growth instead slows to 6% in fiscal 2028 and fades to 2.5% by 2035, the path in our previous model, with the new margins, the value is $62.74. A two-stage version of the terminal value gives $87.67.
Risks to the KLA investment case
- The cycle. Chip equipment spending has fallen sharply in past downturns; KLA's revenue fell 6.5% in fiscal 2024. Our model includes no downturn, and analysts' forecasts of 38.7% growth in fiscal 2027 and 18.5% in fiscal 2028 depend on chipmakers continuing to raise spending.
- China. China was 34.5% of revenue in the September quarter and is expected at 27% to 29% in December. US export rules limit what KLA can sell there, and further restrictions or a slowdown in Chinese spending would cut revenue.
- Customer concentration. Two customers provided 21% and 13% of revenue. A delay at either would show up quickly in KLA's results.
- Supply and costs. Lead times of about 12 months and constrained optical components limit how fast KLA can ship, and high memory prices are holding gross margin below its 63% to 64% target.
- Valuation. At 26.7 times consensus fiscal 2027 EPS, the shares already assume strong growth; the price fell 49.3% from its June high to 2 November, so investors' expectations can change quickly.
- Upside risks. If the wafer equipment market exceeds $200bn in 2027 and keeps growing, or KLA beats its 2030 targets, our model would understate the value. Advanced packaging and services are growing faster than the market.
FAQ
What value does QSILabs put on KLA stock?
$85.55 a share in our base case, from a discounted cash flow model priced on 2 November 2026, when the shares closed at $153.11. Our sensitivity grid ranges from $75.26 to $100.96, and a two-stage cross-check gives $87.67. Our previous model, priced on 28 October, gave $54.87.
Is KLA stock a buy after its latest results?
The results were strong: revenue up 28.9%, GAAP EPS up 38.8% and guidance of $4.7bn for December. But on our model the shares trade well above the value of the cash flows we forecast, so they price in growth beyond consensus and KLA's 2030 targets. Analysts disagree: 20 of 29 rate it a Buy or Strong Buy. This is not investment advice.
How much revenue did KLA make in its latest quarter?
$4,136.0m in the quarter to 30 September 2026, its first quarter of fiscal 2027, up 28.9% from $3,209.7m a year earlier. Product revenue was $3,285.5m and service revenue $850.5m. KLA guided $4.7bn, plus or minus $0.2bn, for the December quarter.
What does KLA Corporation do?
KLA makes inspection and metrology tools that chipmakers use to find defects and measure features on wafers, photomasks and chip packages, plus etch and deposition tools for specialty chips and inspection tools for circuit boards. Process control accounted for $3,754.3m of its $4,136.0m of revenue in the latest quarter.
Does KLA pay a dividend?
Yes. KLA pays $0.23 a share each quarter, or $0.92 a year, a yield of about 0.60% at $153.11. It paid $305.1m of dividends and bought back $935.8m of shares in the September 2026 quarter.
What price target do analysts have for KLAC?
The 29 analysts tracked by S&P Global have an average price target of $217.58, a median of $220, a low of $175 and a high of $275, according to StockAnalysis on 30 October 2026. Their consensus rating is Buy.
How exposed is KLA to China?
China provided $1,425.7m, or 34.5%, of revenue in the September 2026 quarter, against 39.5% a year earlier. KLA expects China to be 27% to 29% of revenue in the December quarter.
How much debt does KLA have?
KLA had $5,950.0m of senior notes, at principal value, at 30 September 2026, maturing from 2029 to 2062, and $4,741.2m of cash and marketable securities, so net debt was about $1.2bn. Its $1.5bn revolving credit facility was undrawn.
When did KLA split its stock?
KLA carried out a ten-for-one stock split on 11 June 2026. Per-share figures and prices in this article are on the post-split basis.
Sources
- KLA Corporation, Q1 fiscal 2027 results (Form 8-K, Exhibit 99.1, 28 Oct 2026; accession 0000319201-26-000032) www.sec.gov
- KLA Corporation, Form 10-Q for the quarter ended 30 Sep 2026 (filed 29 Oct 2026; accession 0000319201-26-000034) www.sec.gov
- SEC XBRL company facts for KLA Corporation (CIK 319201): quarterly and annual revenue, costs and cash flow from Forms 10-Q and 10-K data.sec.gov
- KLA Q1 fiscal 2027 earnings call transcript, 28 Oct 2026, via The Motley Fool (accessed 2 Nov 2026) www.fool.com
- KLA 2030 target model slide, reproduced in KLA's Q3 fiscal 2026 earnings presentation (via Seeking Alpha) static.seekingalpha.com
- KLA Investor Day 2026 transcript, 12 Mar 2026, via StockAnalysis (accessed 2 Nov 2026) stockanalysis.com
- StockAnalysis: KLA forecast and analyst ratings, S&P Global data (updated 30 Oct 2026; accessed 2 Nov 2026) stockanalysis.com
- StockAnalysis: KLA statistics (accessed 2 Nov 2026) stockanalysis.com
- SEMI, mid-year total semiconductor equipment forecast press release, 14 Jul 2026 www.semi.org
- Yahoo Finance chart data: KLAC closing prices and dividends (November 2025 to November 2026) query1.finance.yahoo.com
- Damodaran Online: cost of capital by industry (US), January 2026 pages.stern.nyu.edu
- QSILabs KLA discounted cash flow model (internal; price as of 2 Nov 2026)
Disclaimer
This article is for information only and is not investment advice, a recommendation or an offer to buy or sell any security. QSI Labs and its authors may hold positions in the securities discussed. Forecasts and valuations are estimates that depend on assumptions that may prove wrong. Figures are taken from company filings and third-party sources believed to be reliable, but we do not guarantee their accuracy. Do your own research or consult a licensed adviser before investing.
More from QSI Labs
Related analysis: Lam Research stock Q3 2026: China and memory, Applied Materials stock Q3 2026: DRAM and China, Micron stock Q3 2026: HBM and Nvidia stock Q3 2026: Rubin.
Read our white paper, QSI Labs: An AI-Native Trading Firm Built on a Training Loop (October 2026), available on request, or browse the research index.